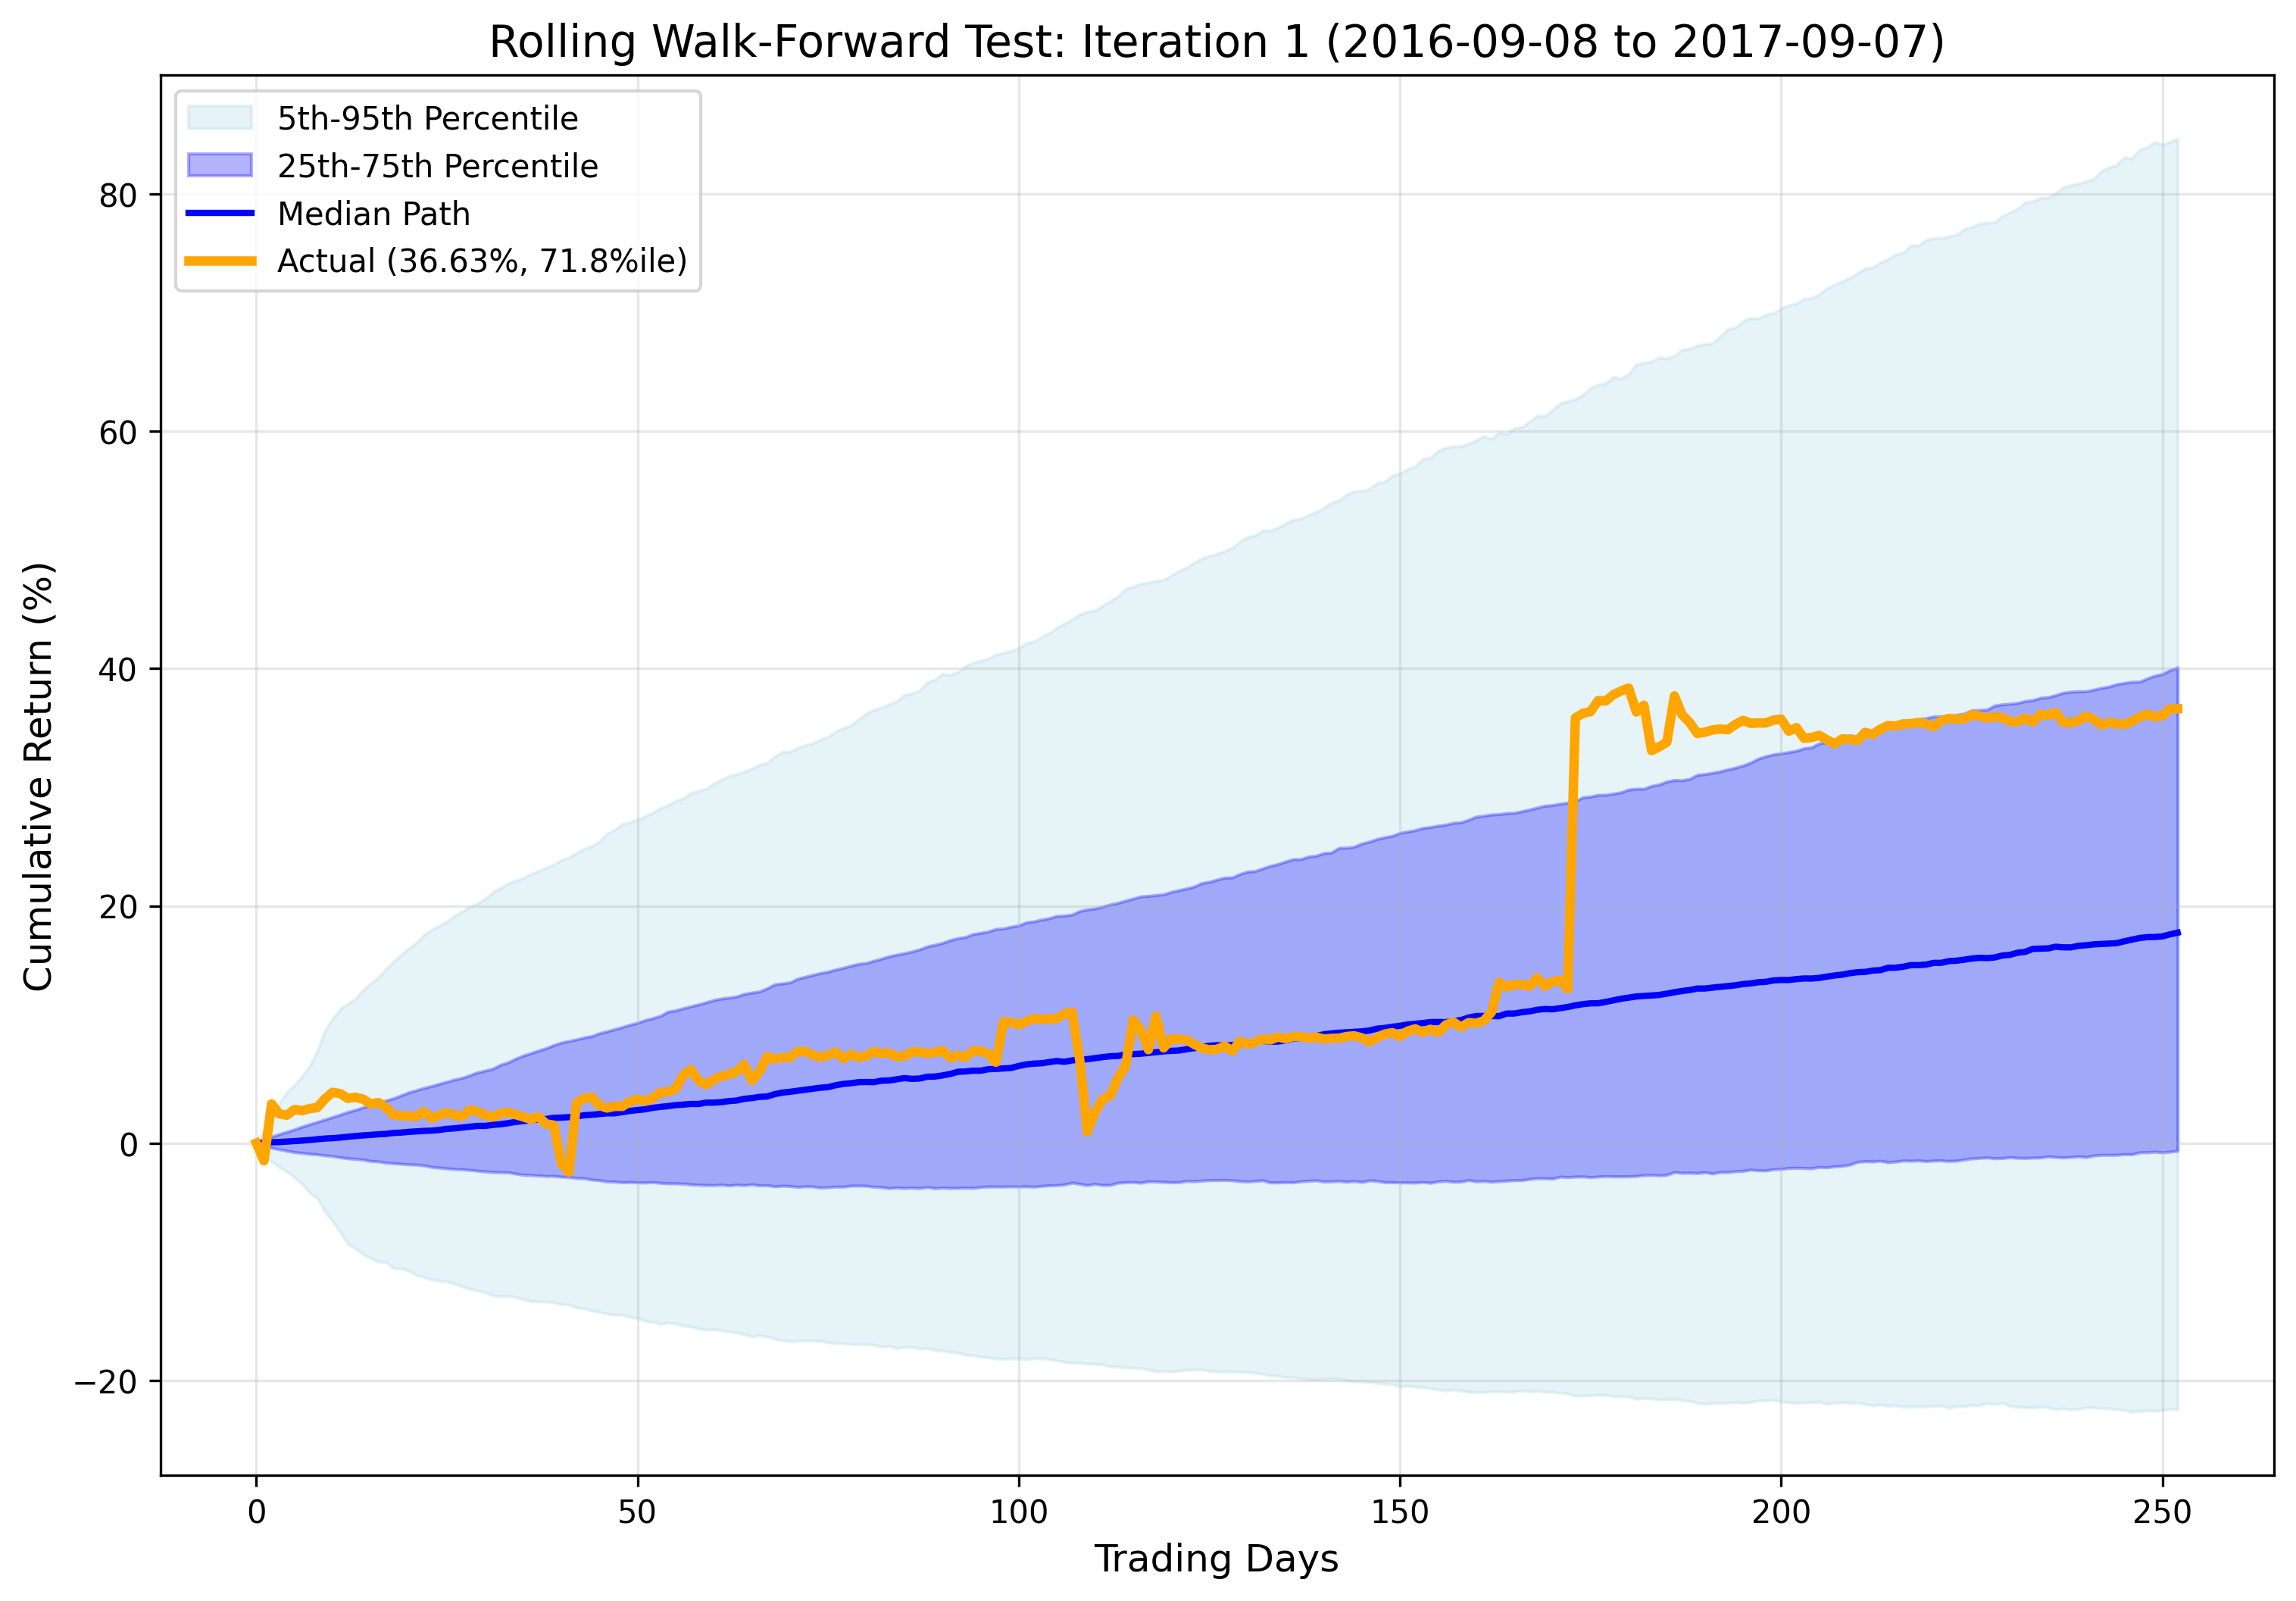
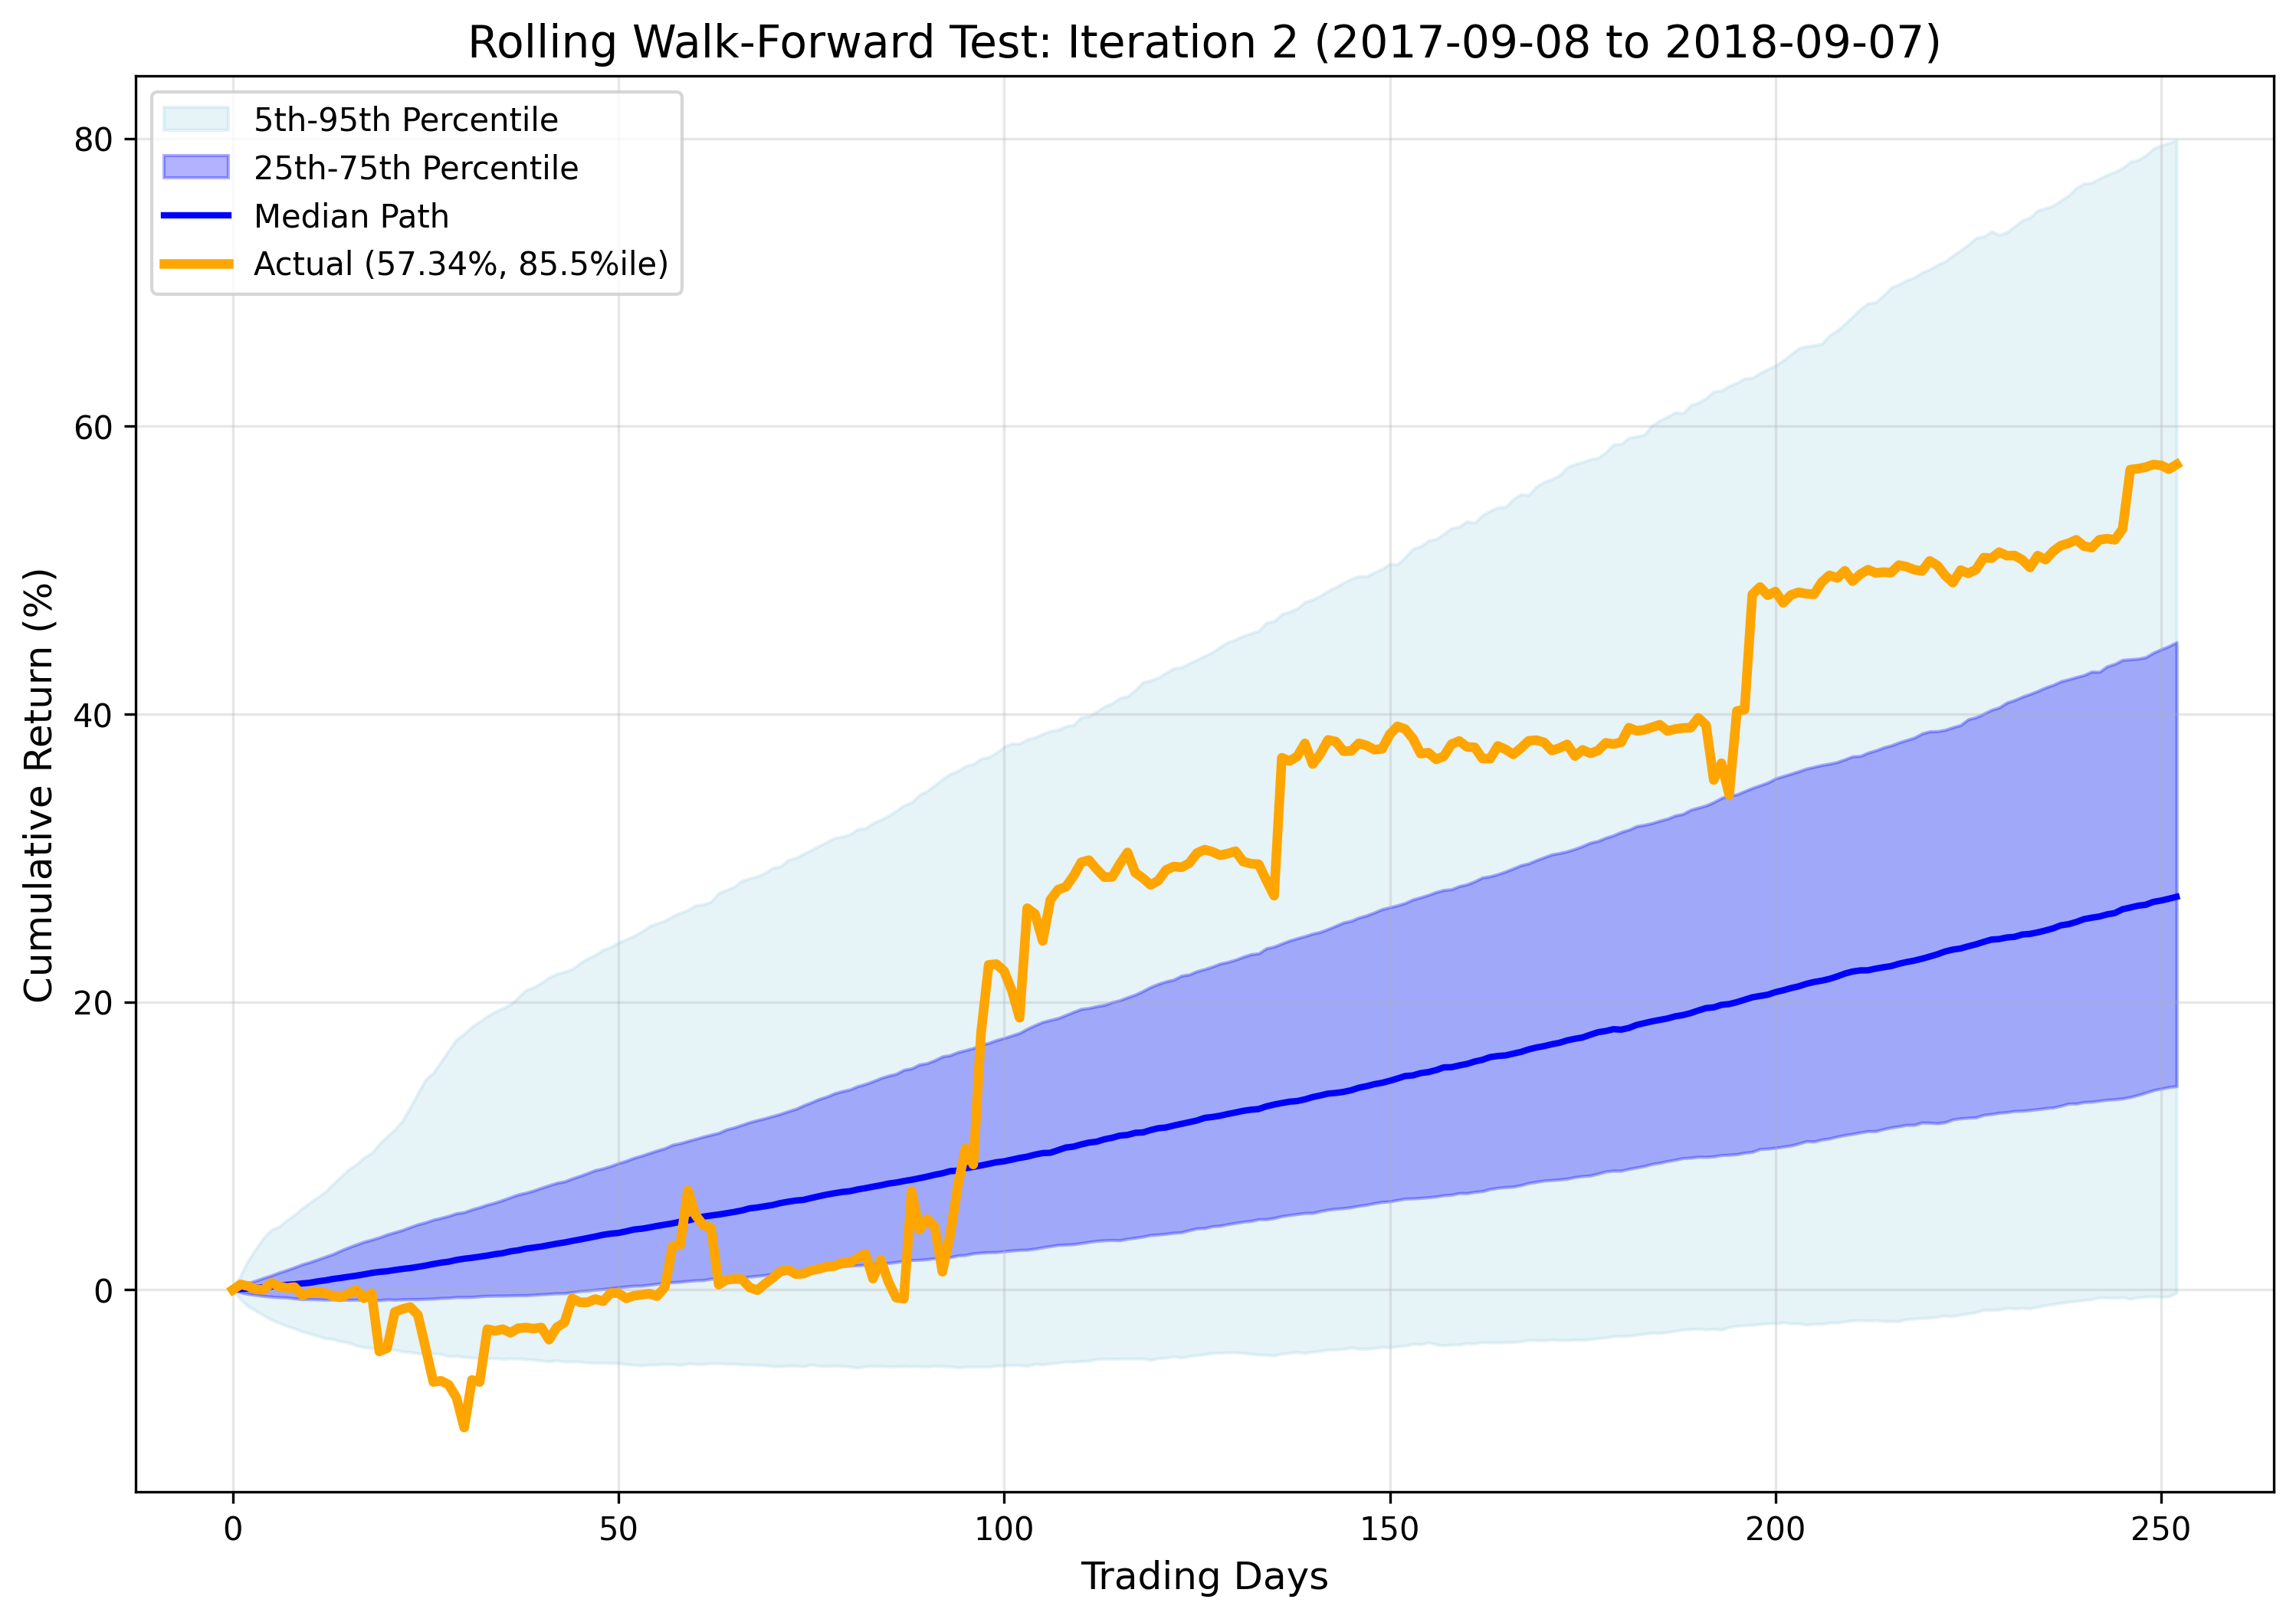
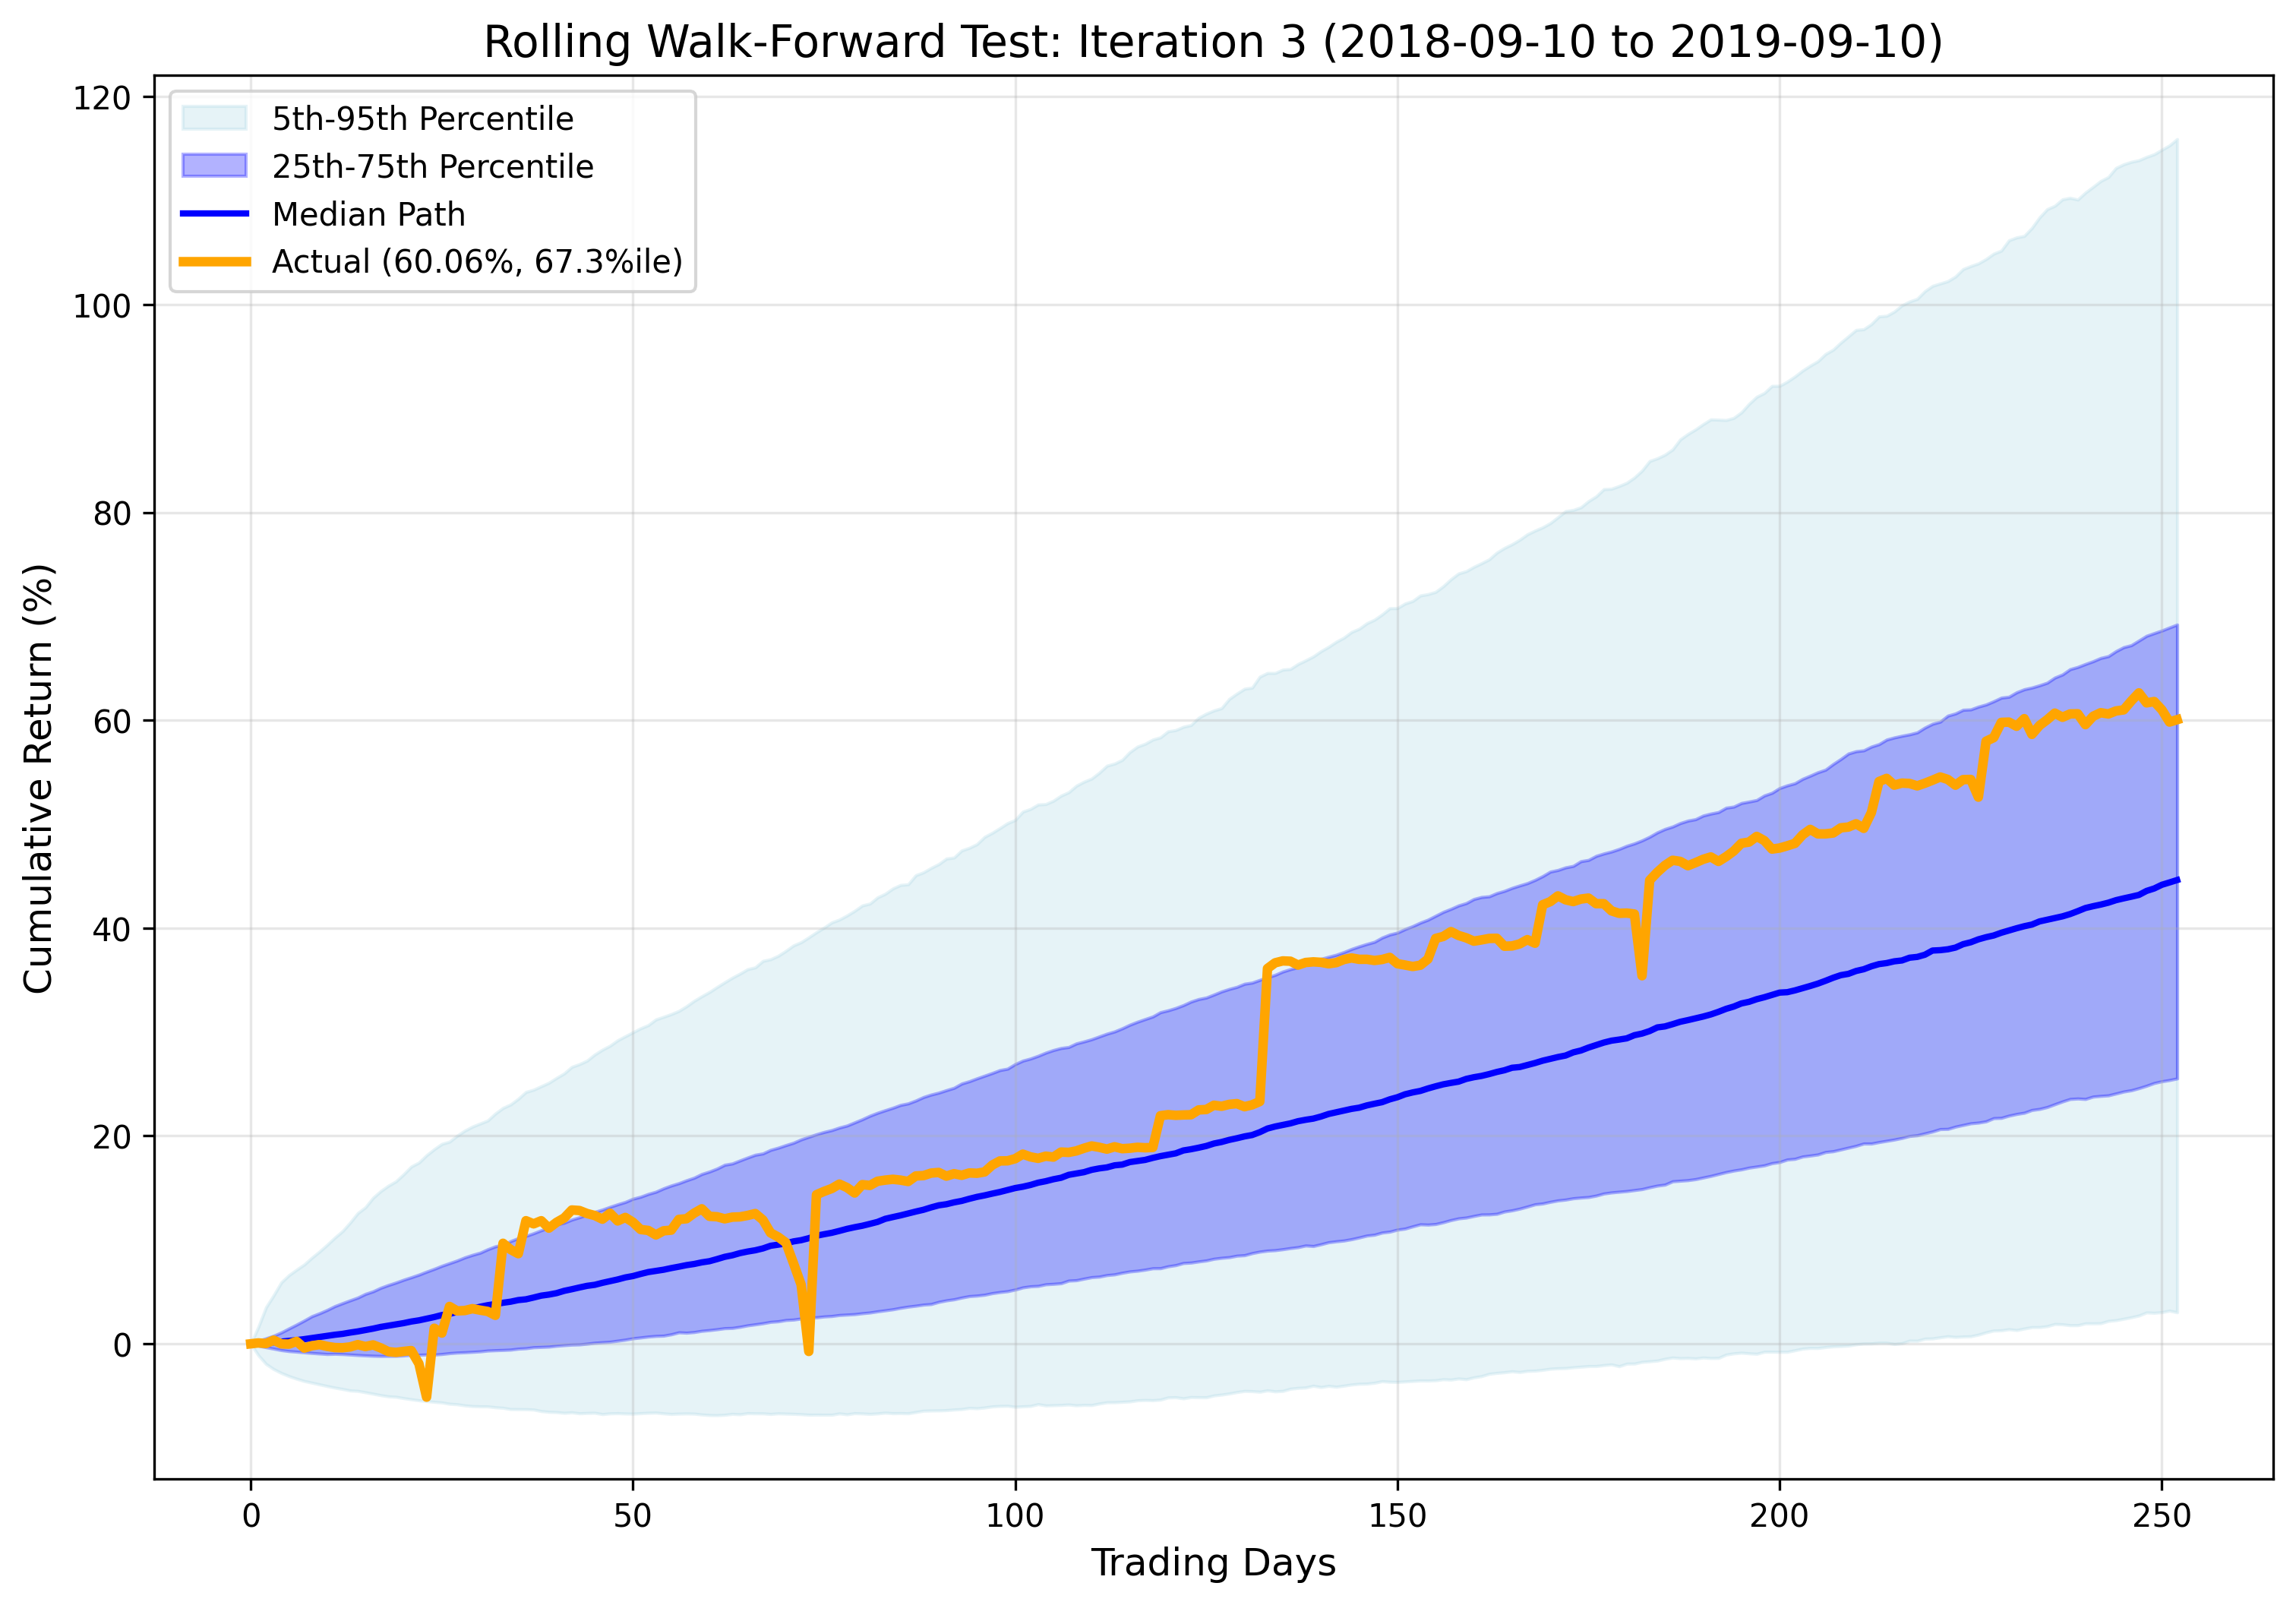
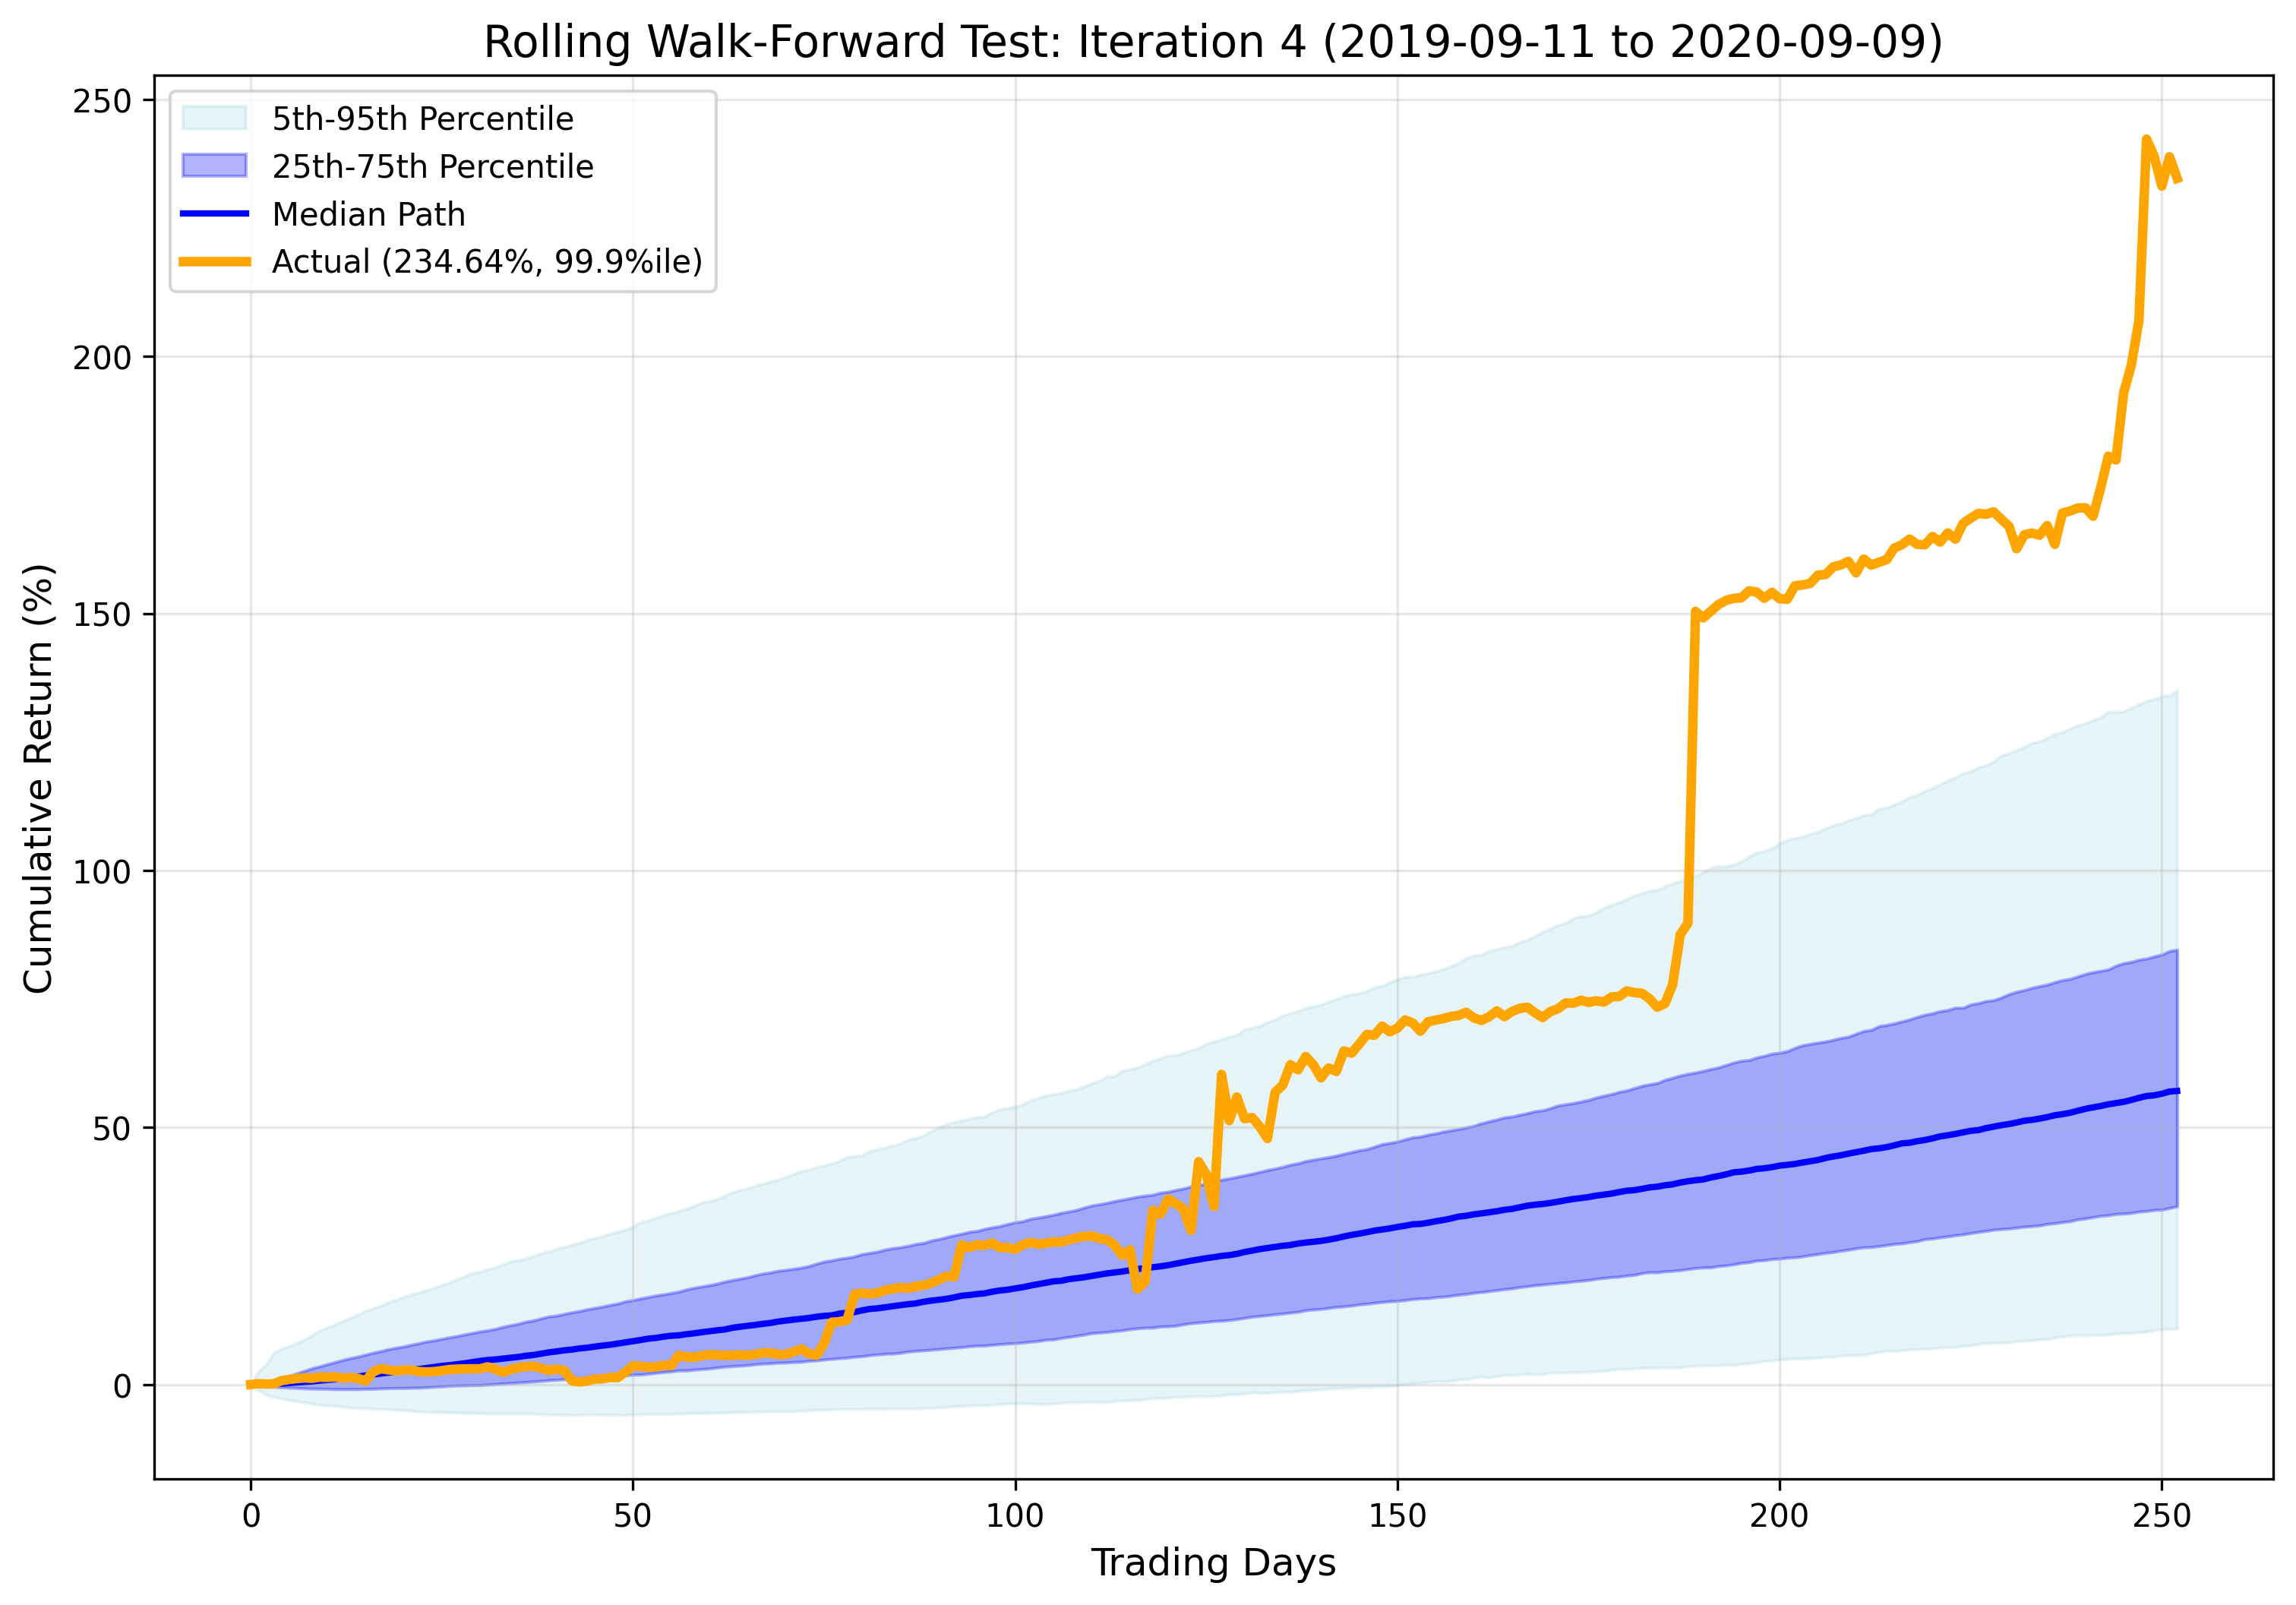
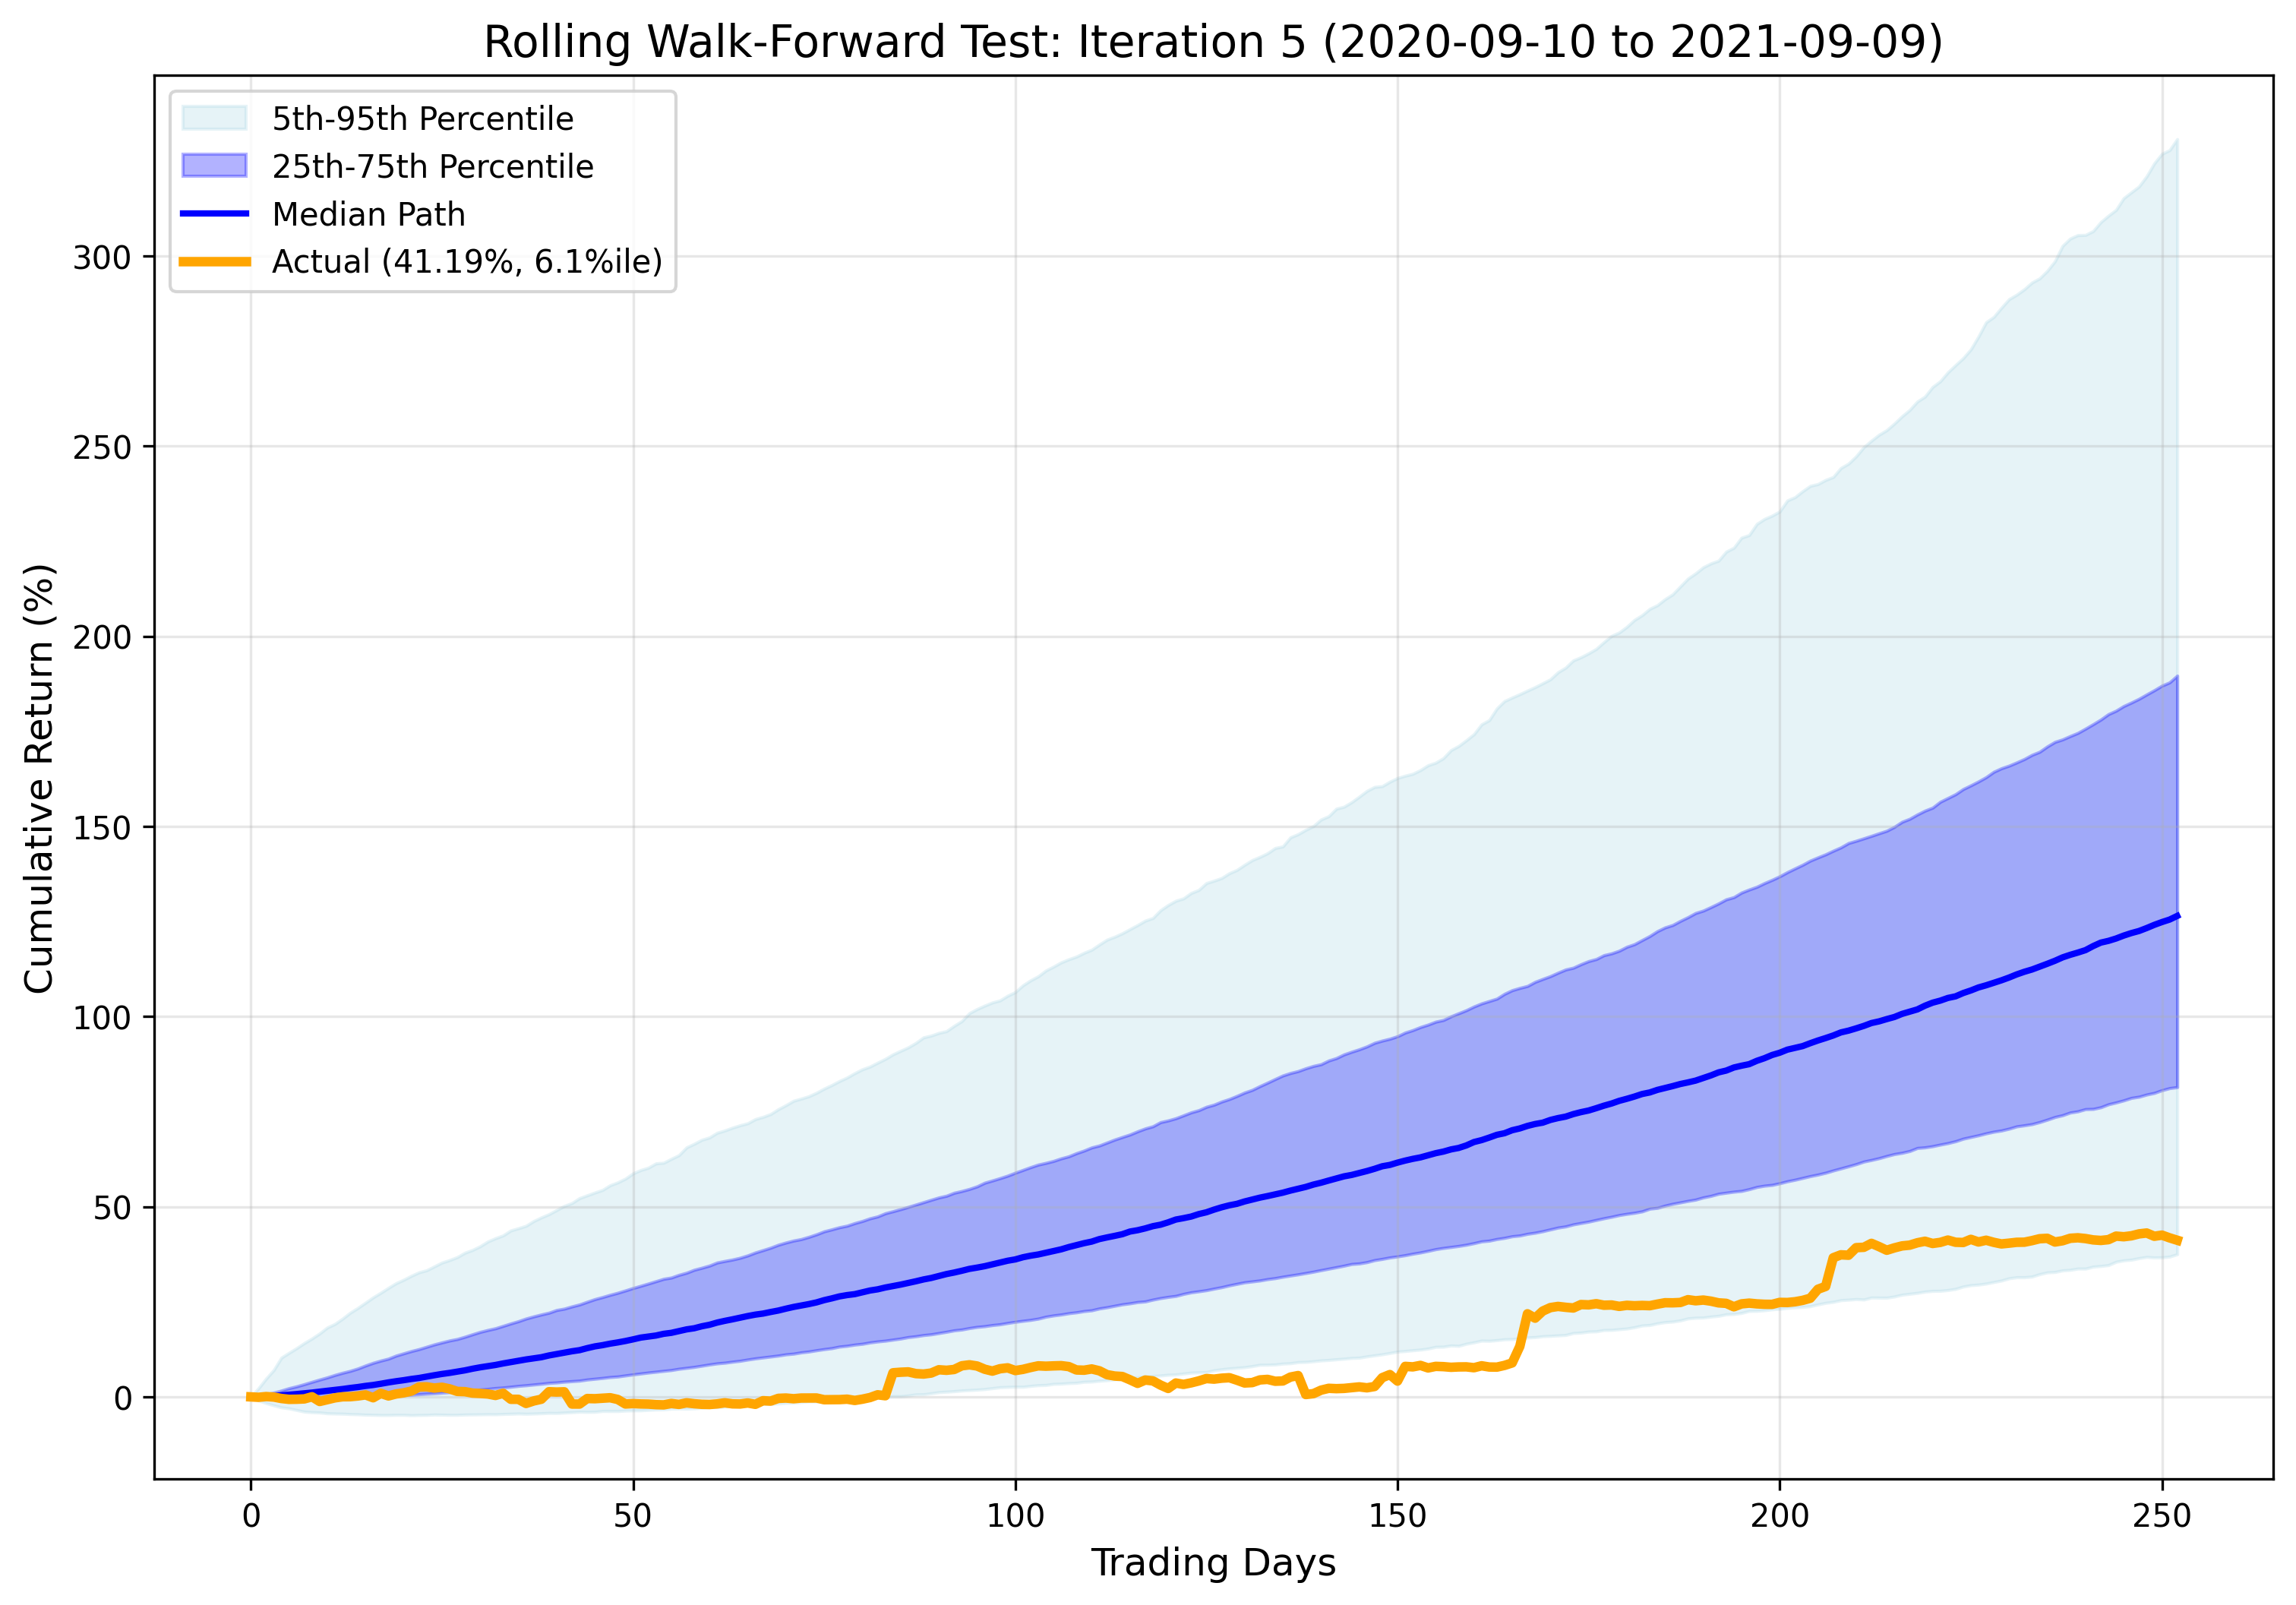
Monte Carlo robustness analysis to evaluate strategy's performance predictability using 10,000 simulations per test period within a rolling walk-forward framework
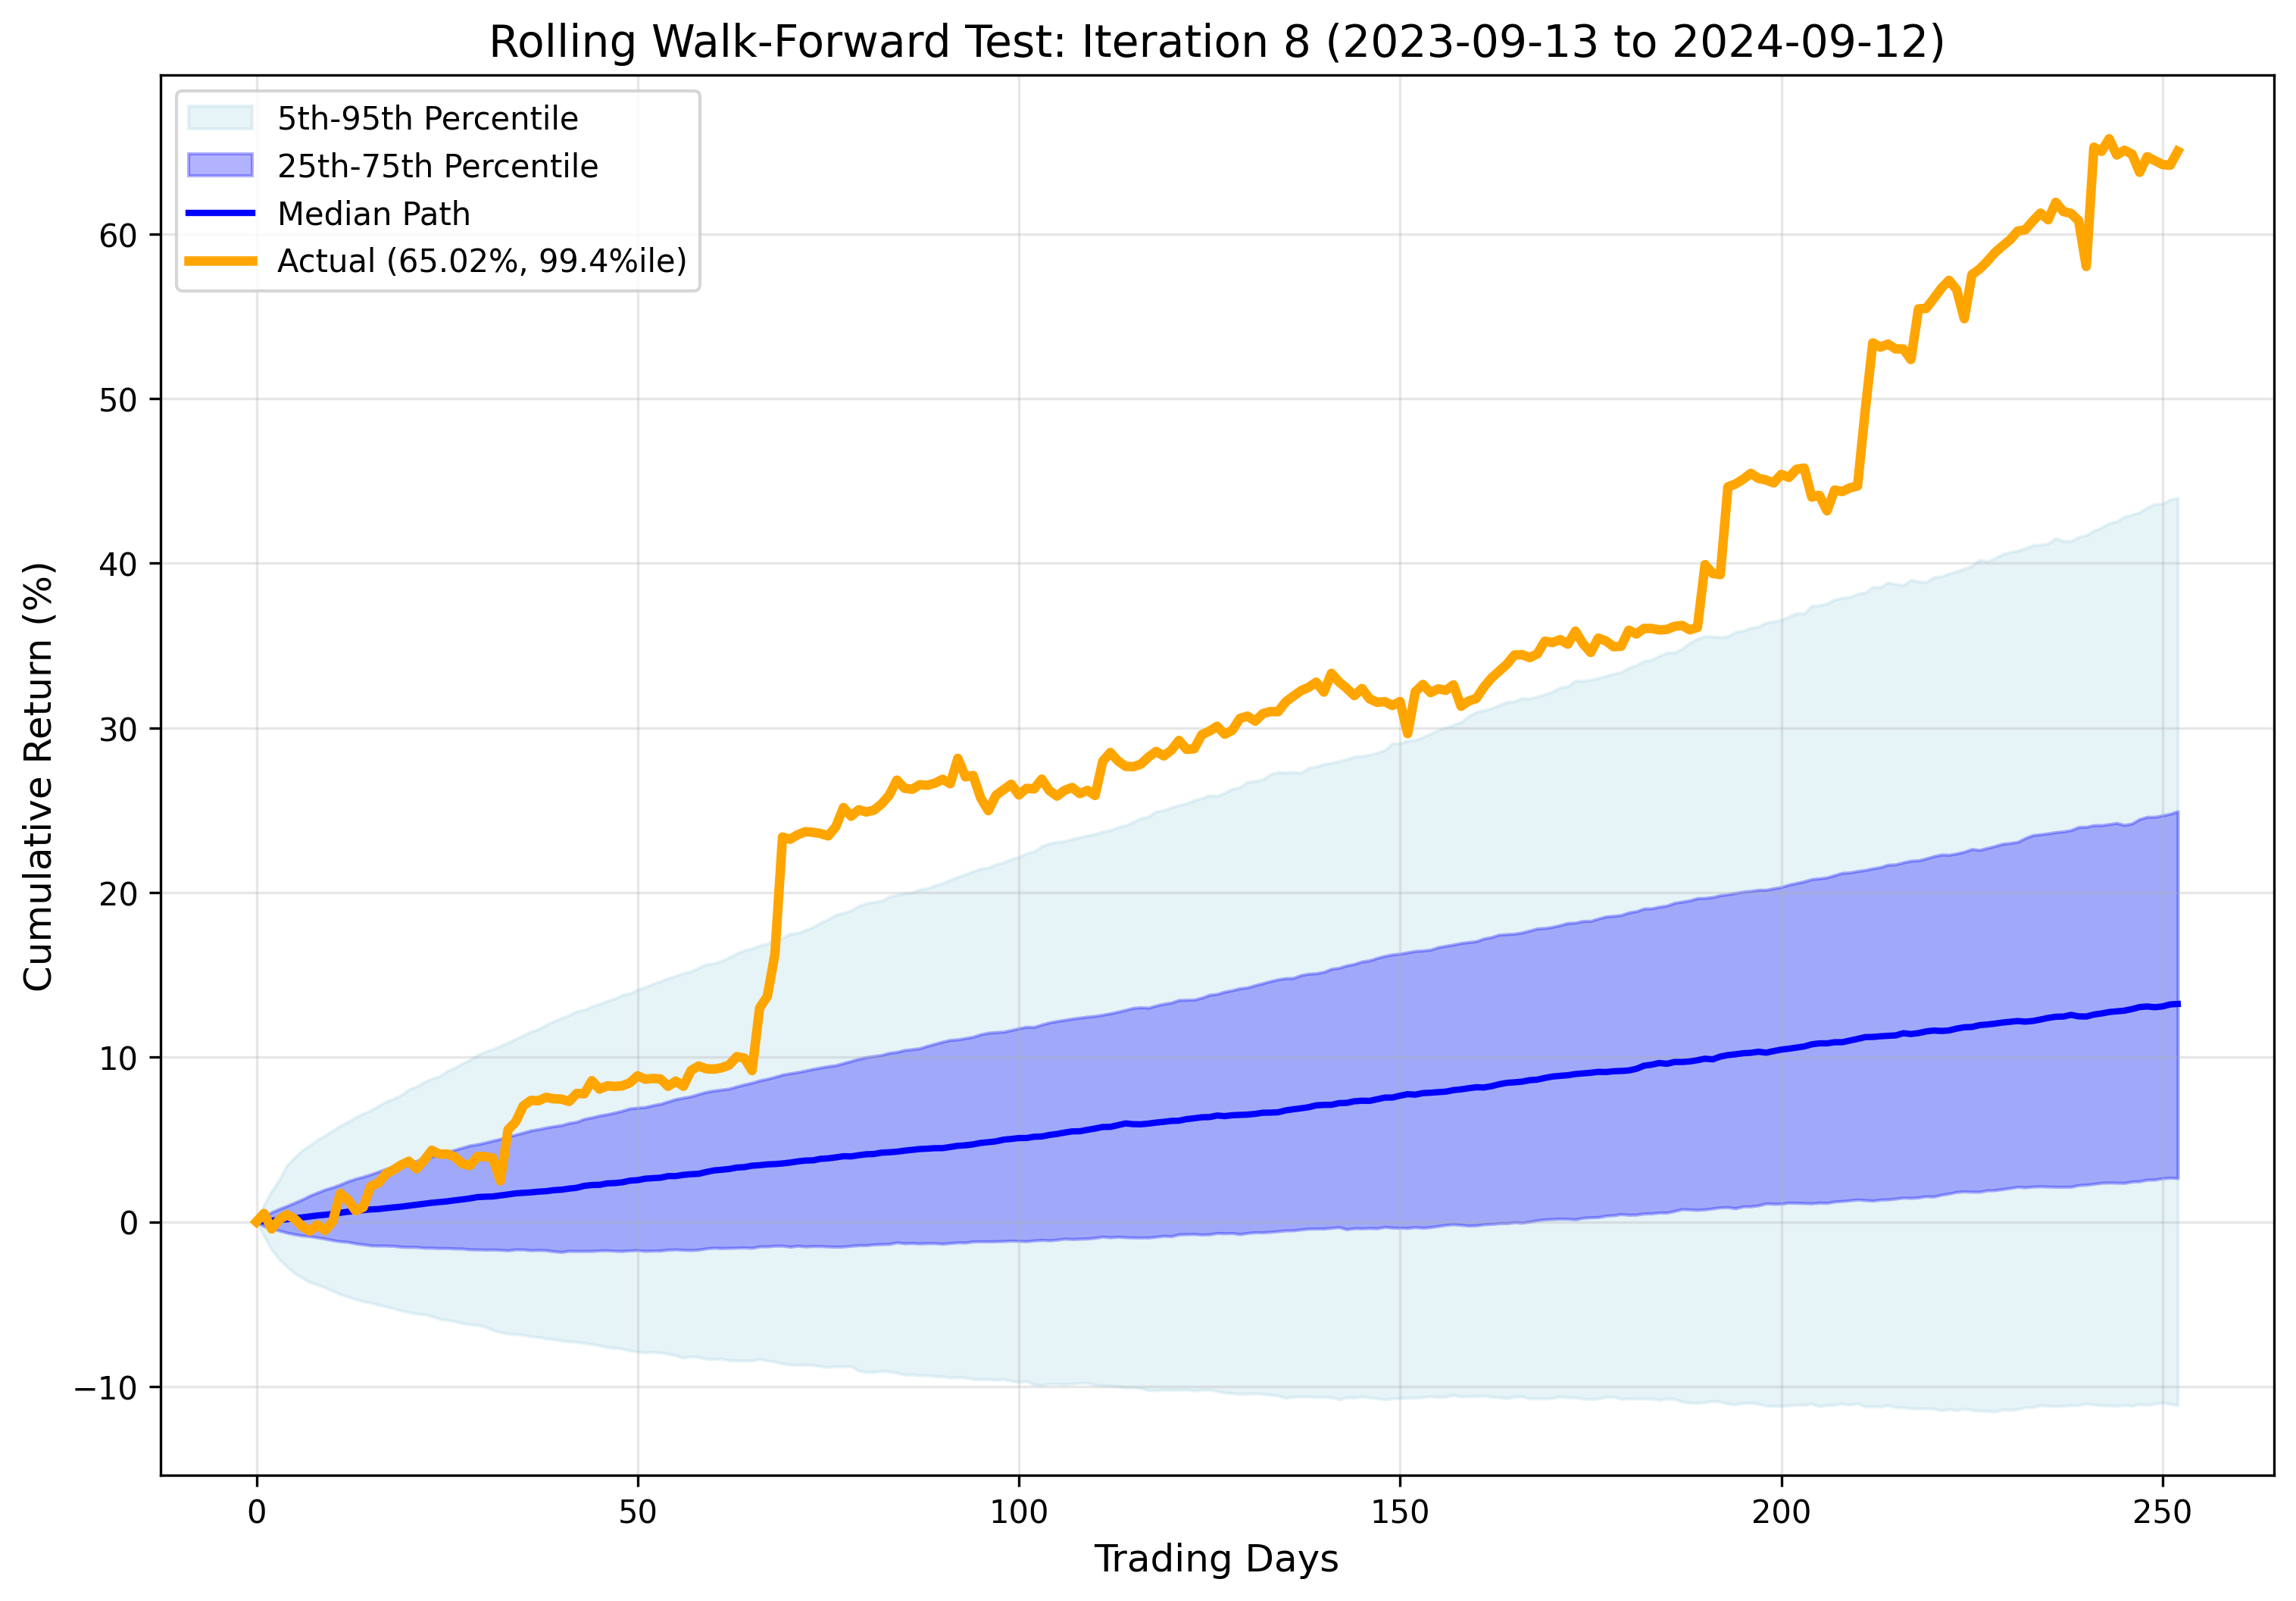
The data indicates a robust “Crisis Alpha” or “Antifragile” profile. The strategy delivers its highest velocity returns during periods of market distress, while preserving capital during grinding bear market. This asymmetry makes it a prime candidate for aggressive wealth accumulation.
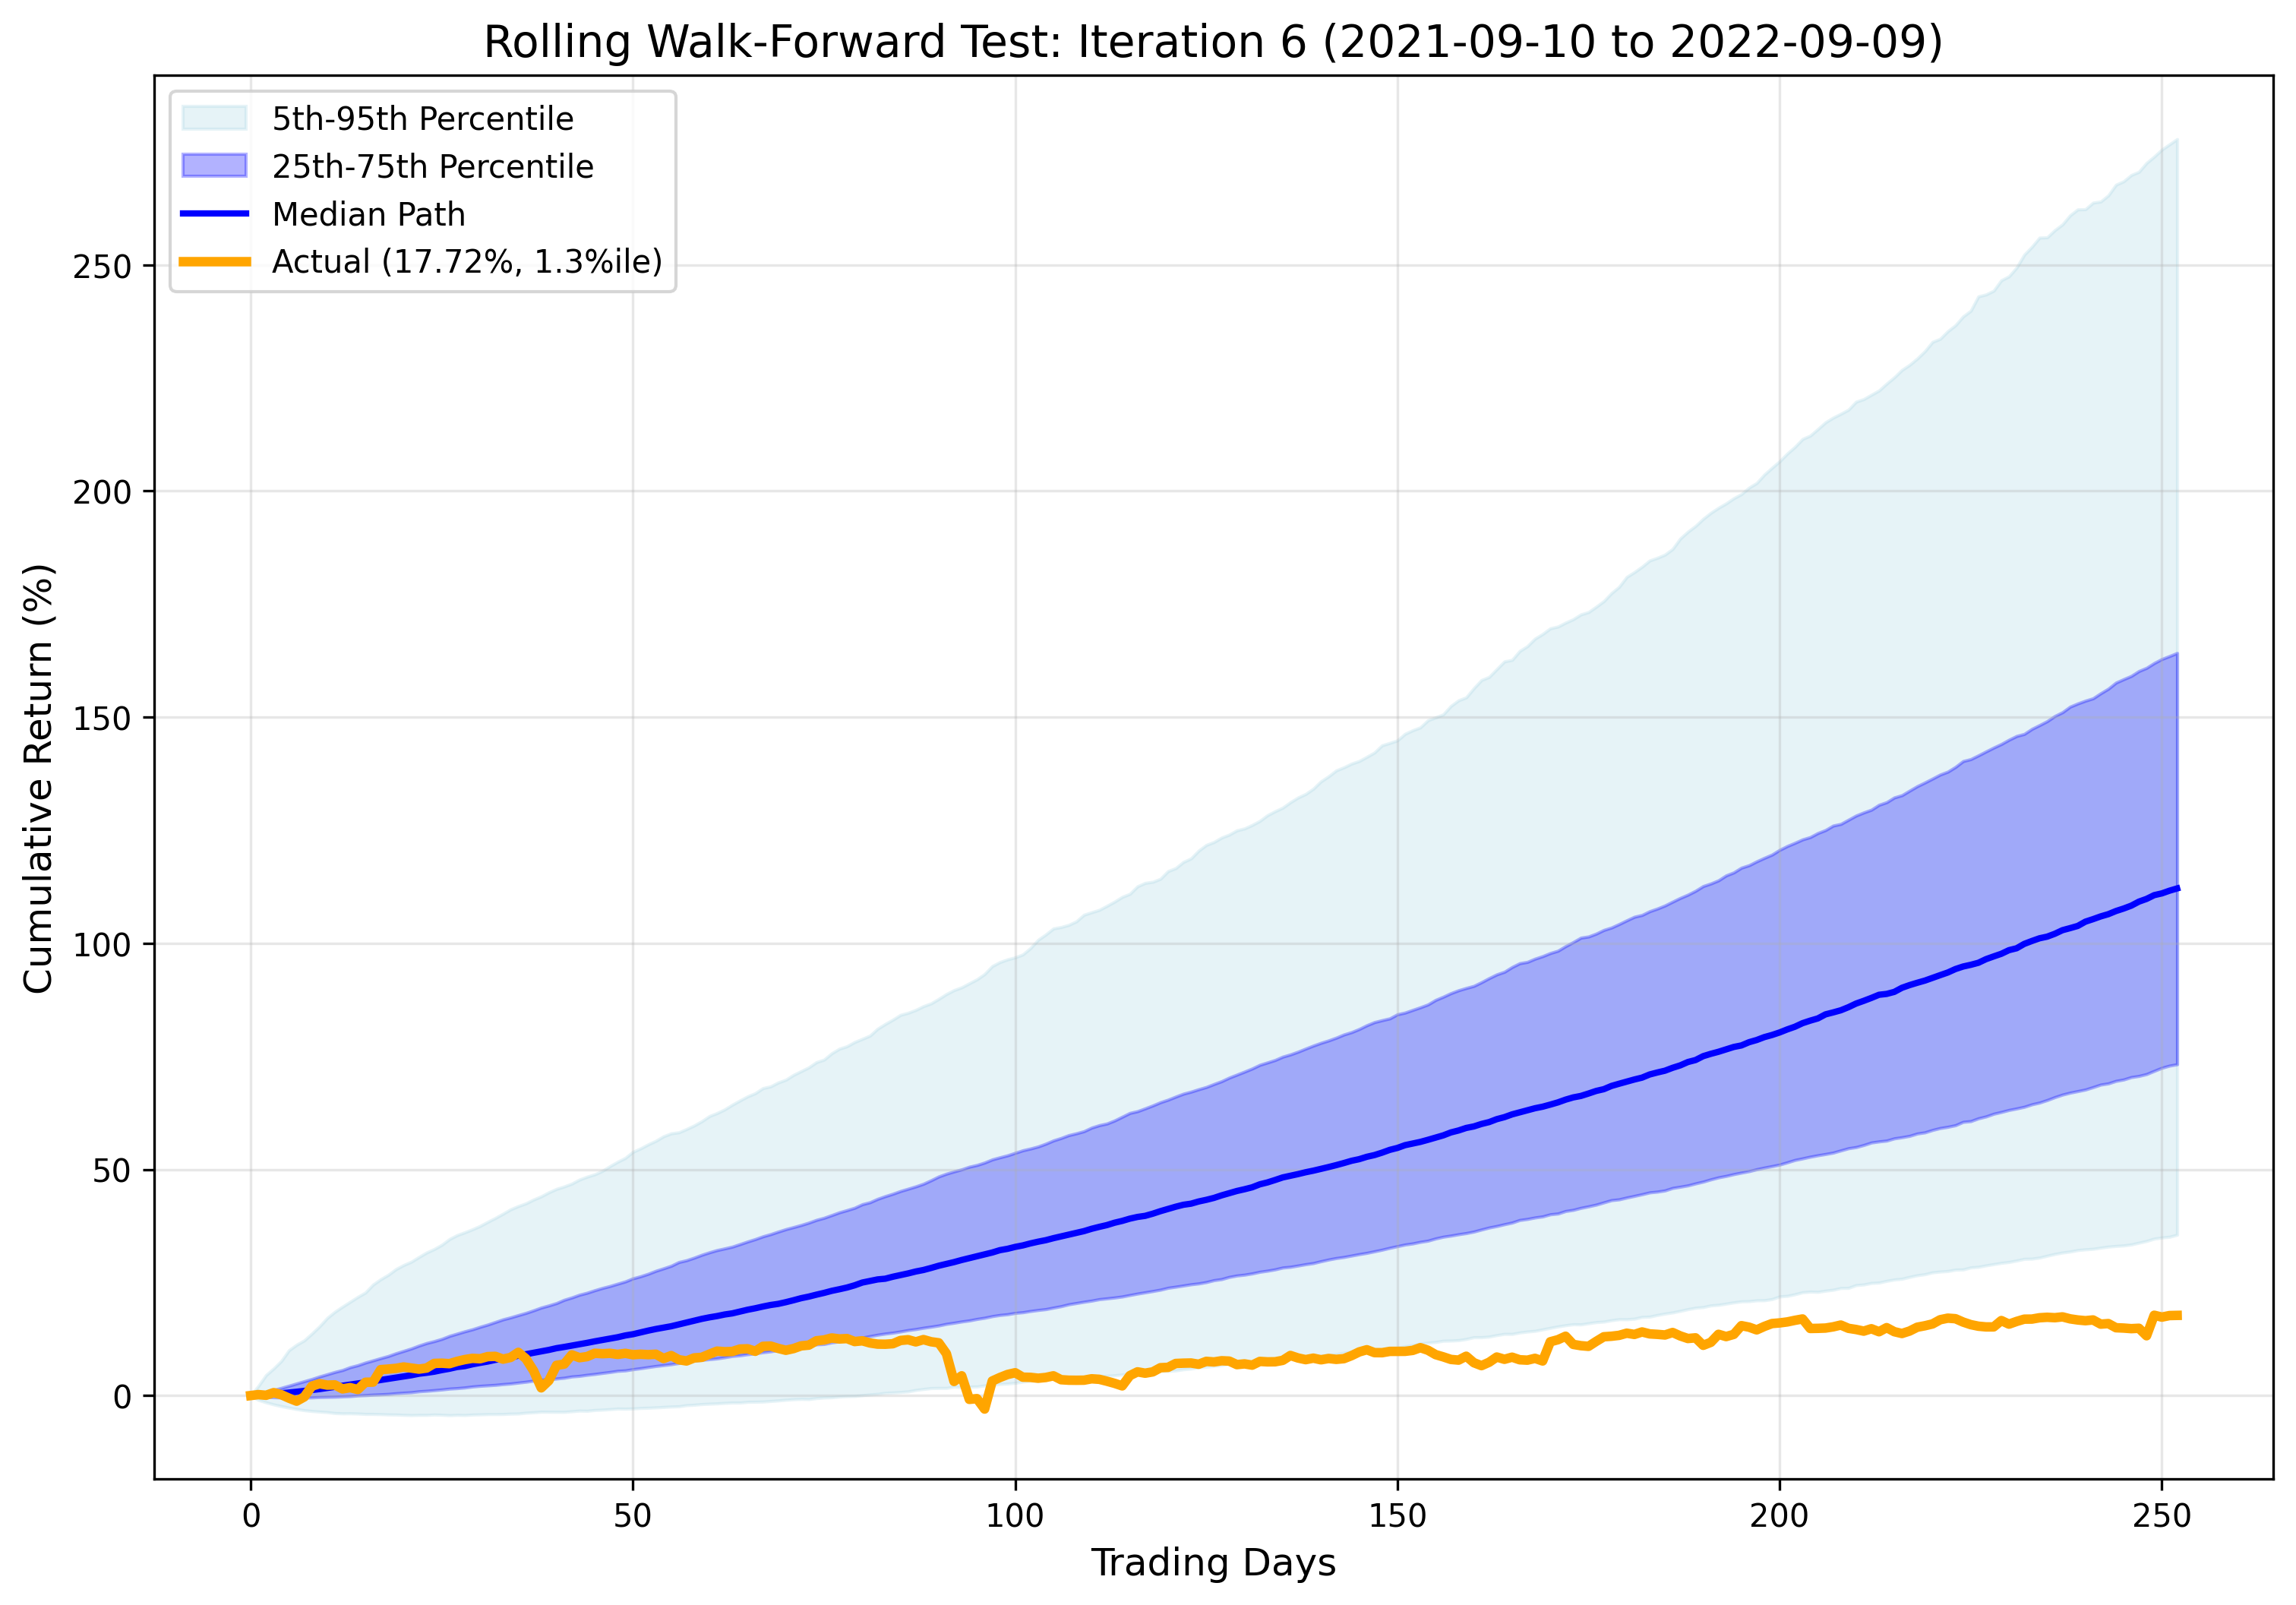
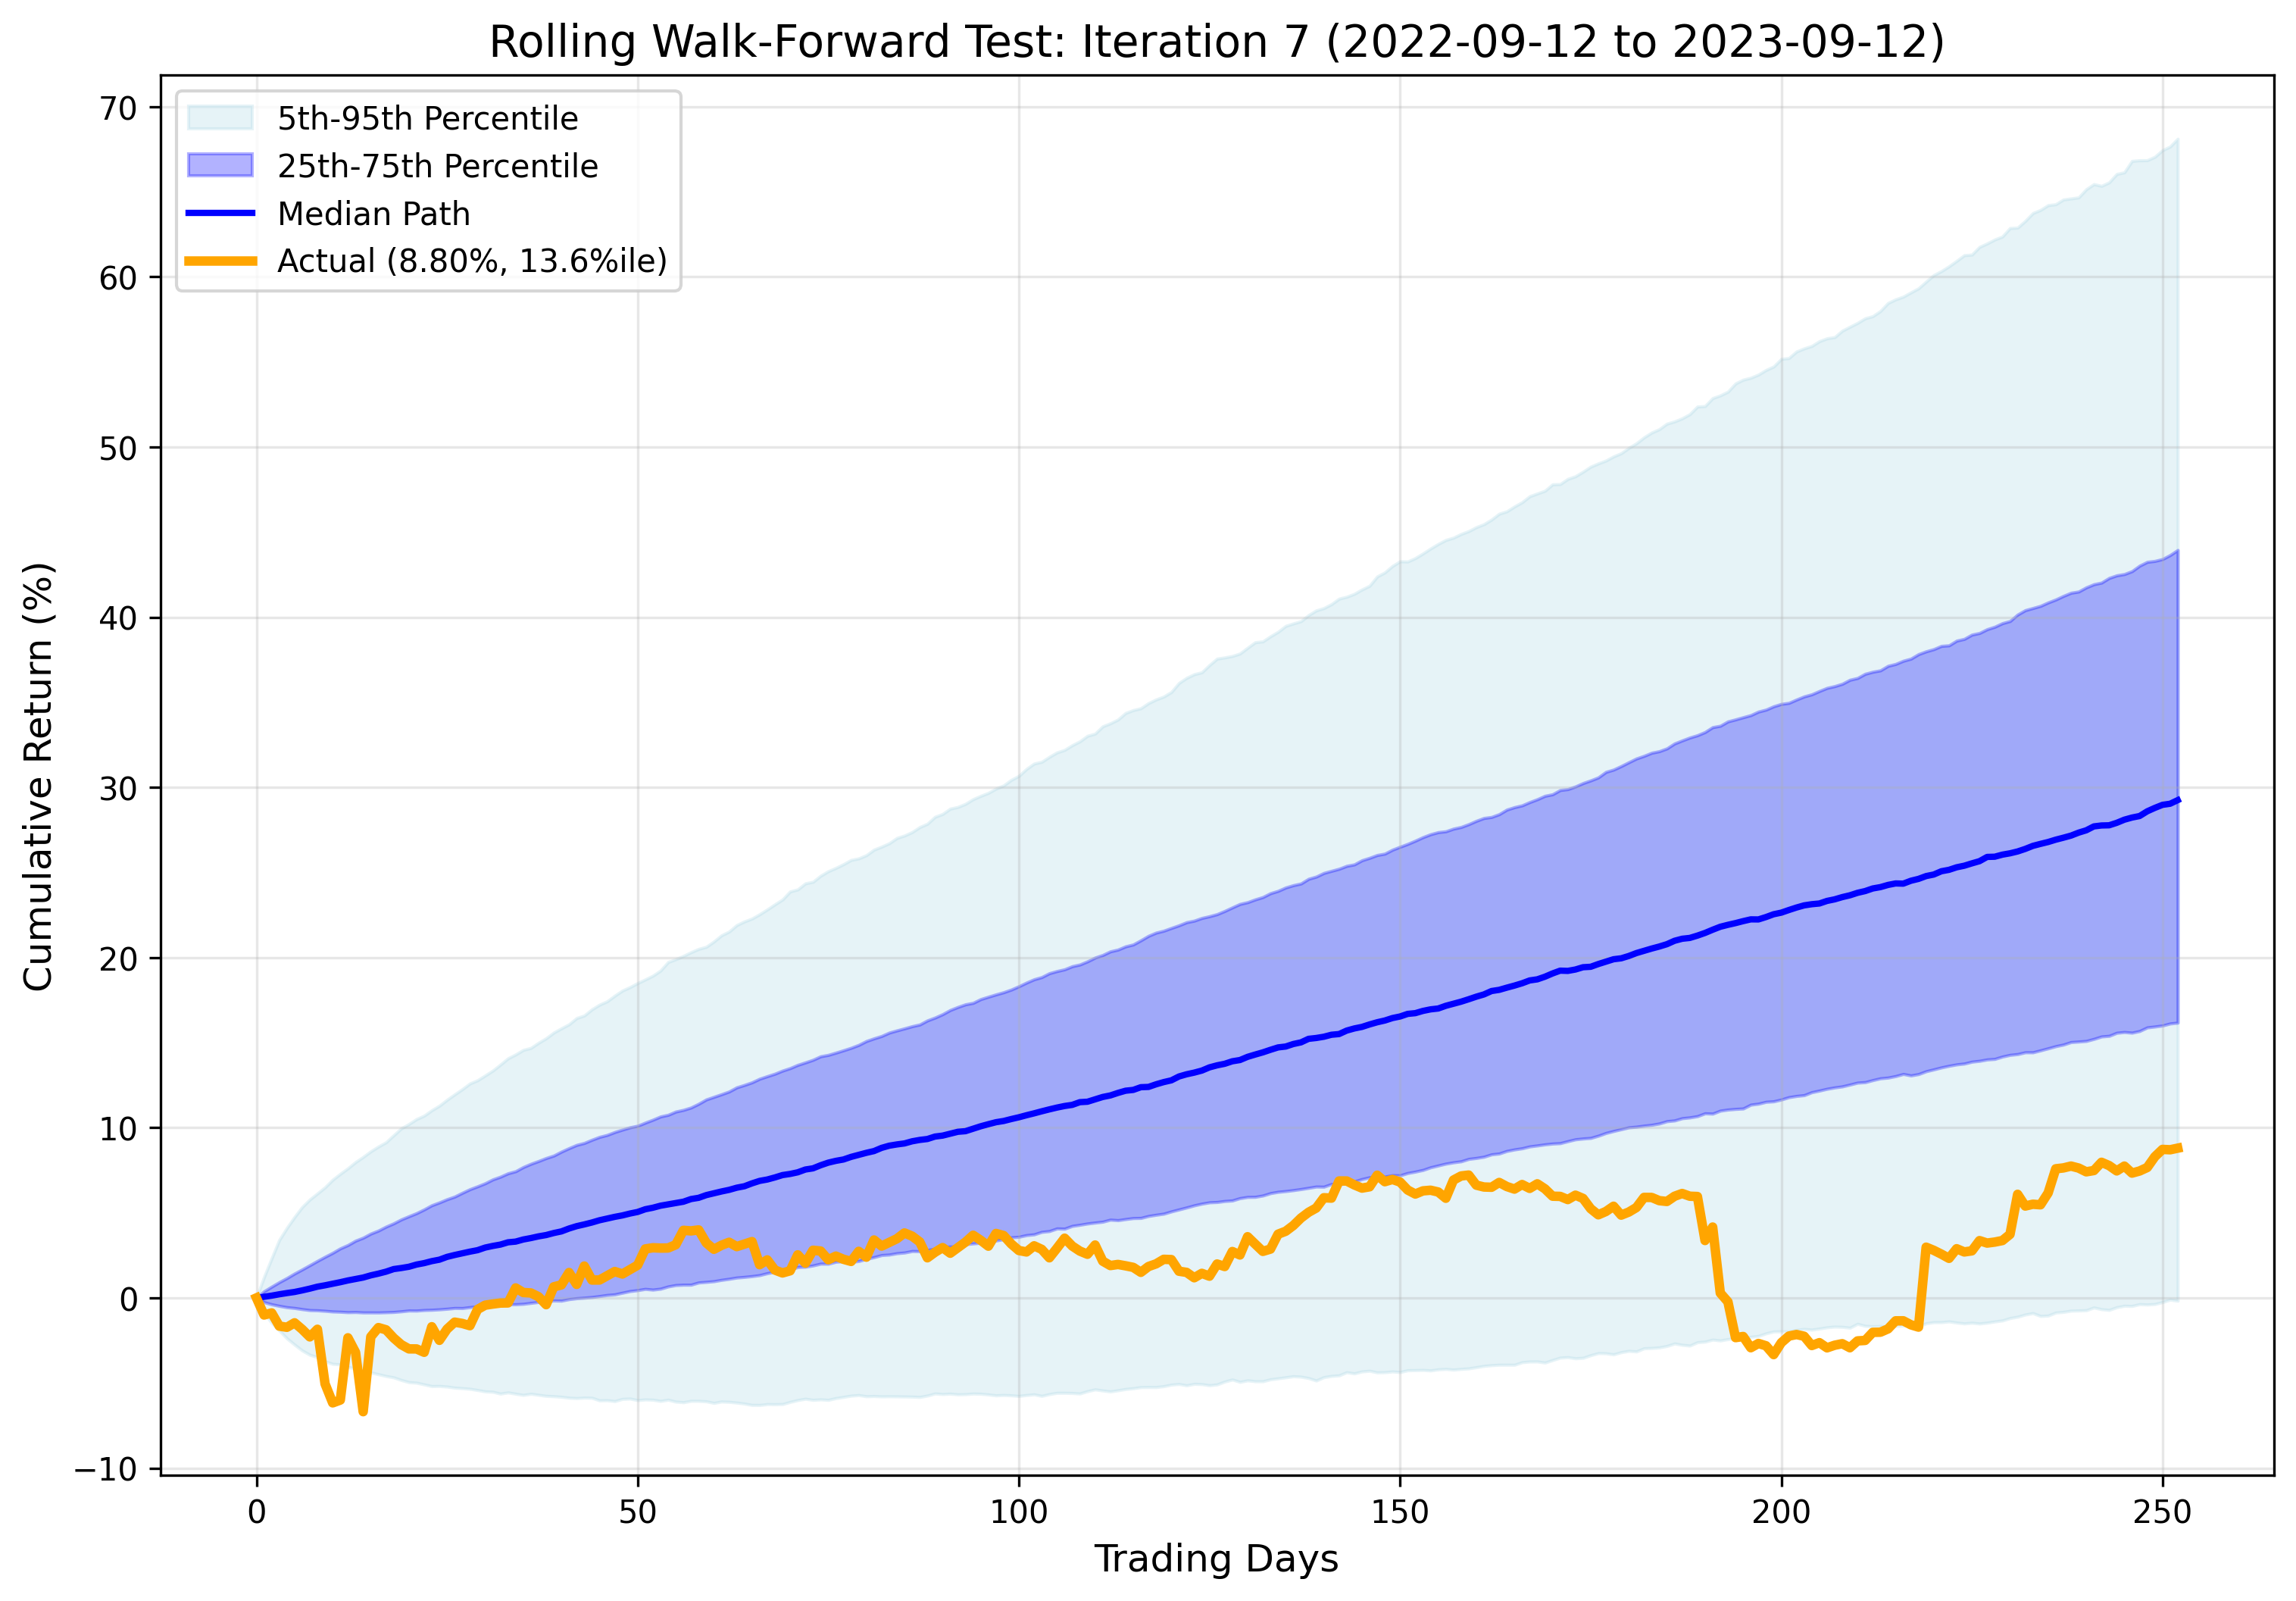
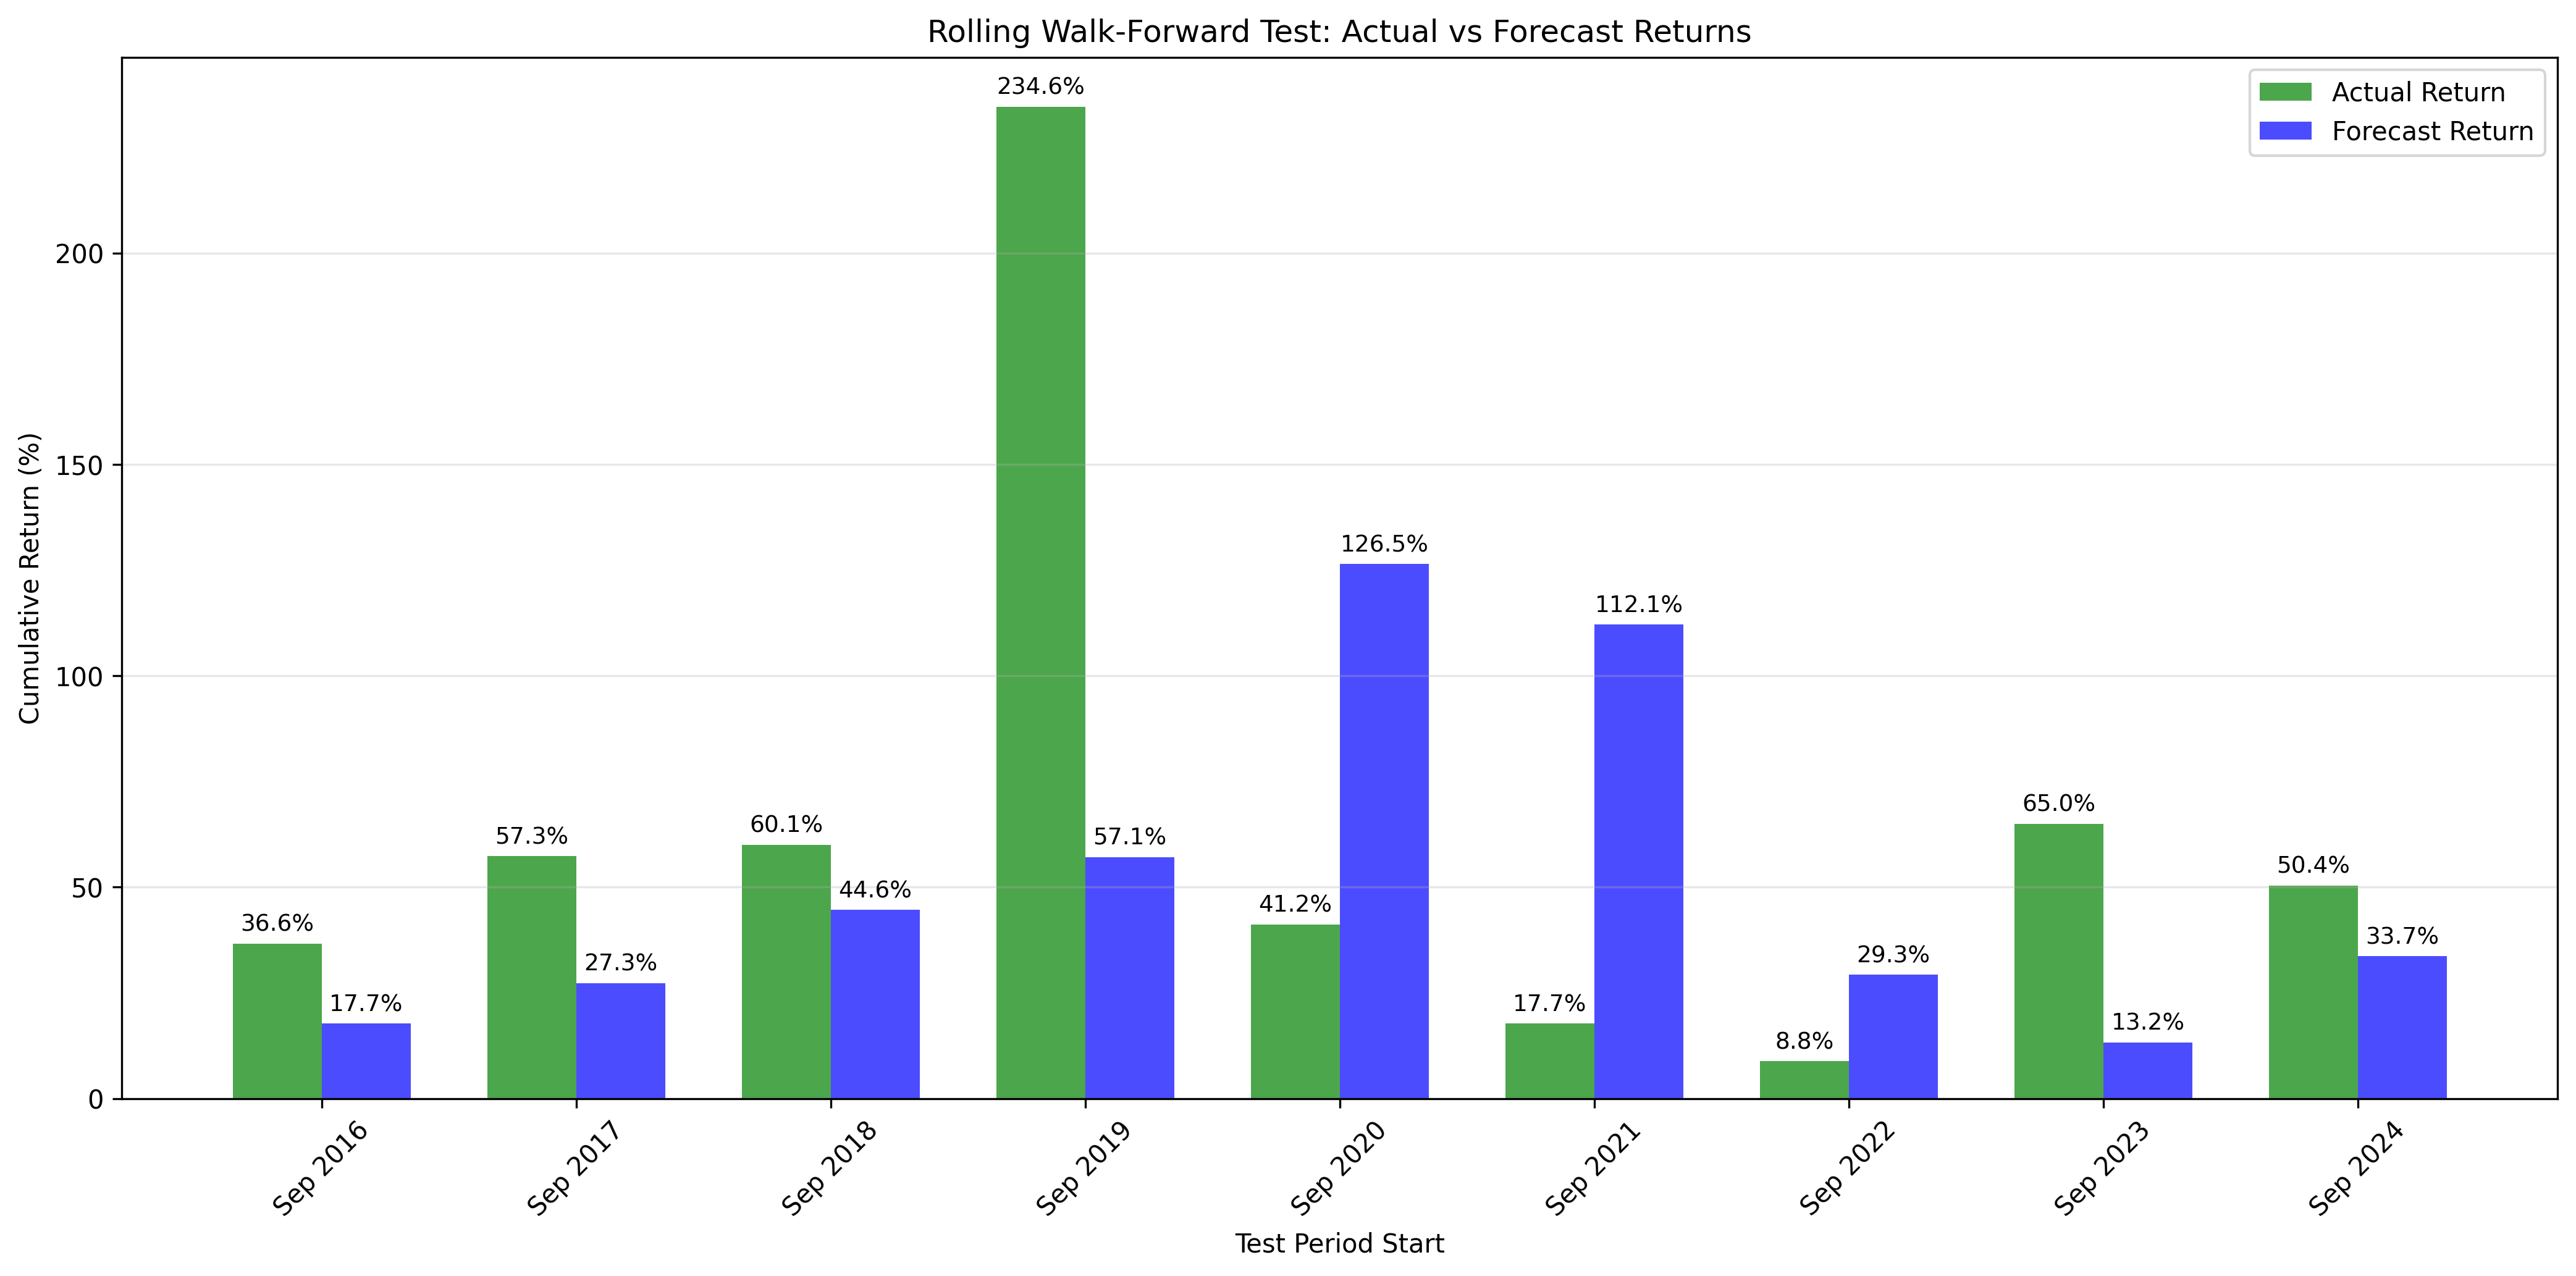
Across 9 distinct out-of-sample variations, the strategy remained positive in every single iteration. Even in the hardest trading environments (e.g., Iteration 7), the strategy yielded a positive return while the broader market collapsed.
NOTE: This strategy is intentionally designed to capture outlier returns during specific market conditions. Following the periods of exceptional performance, Monte Carlo forecasts may appear overly optimistic in subsequent iterations, consequently making the strategy appear to underperform during those iterations. This is expected behavior as the simulations incorporate recent extreme returns into their probability distributions.
| Rank | Trading Days | Calendar Days | Max Drawdown | Start Date | End Date |
|---|---|---|---|---|---|
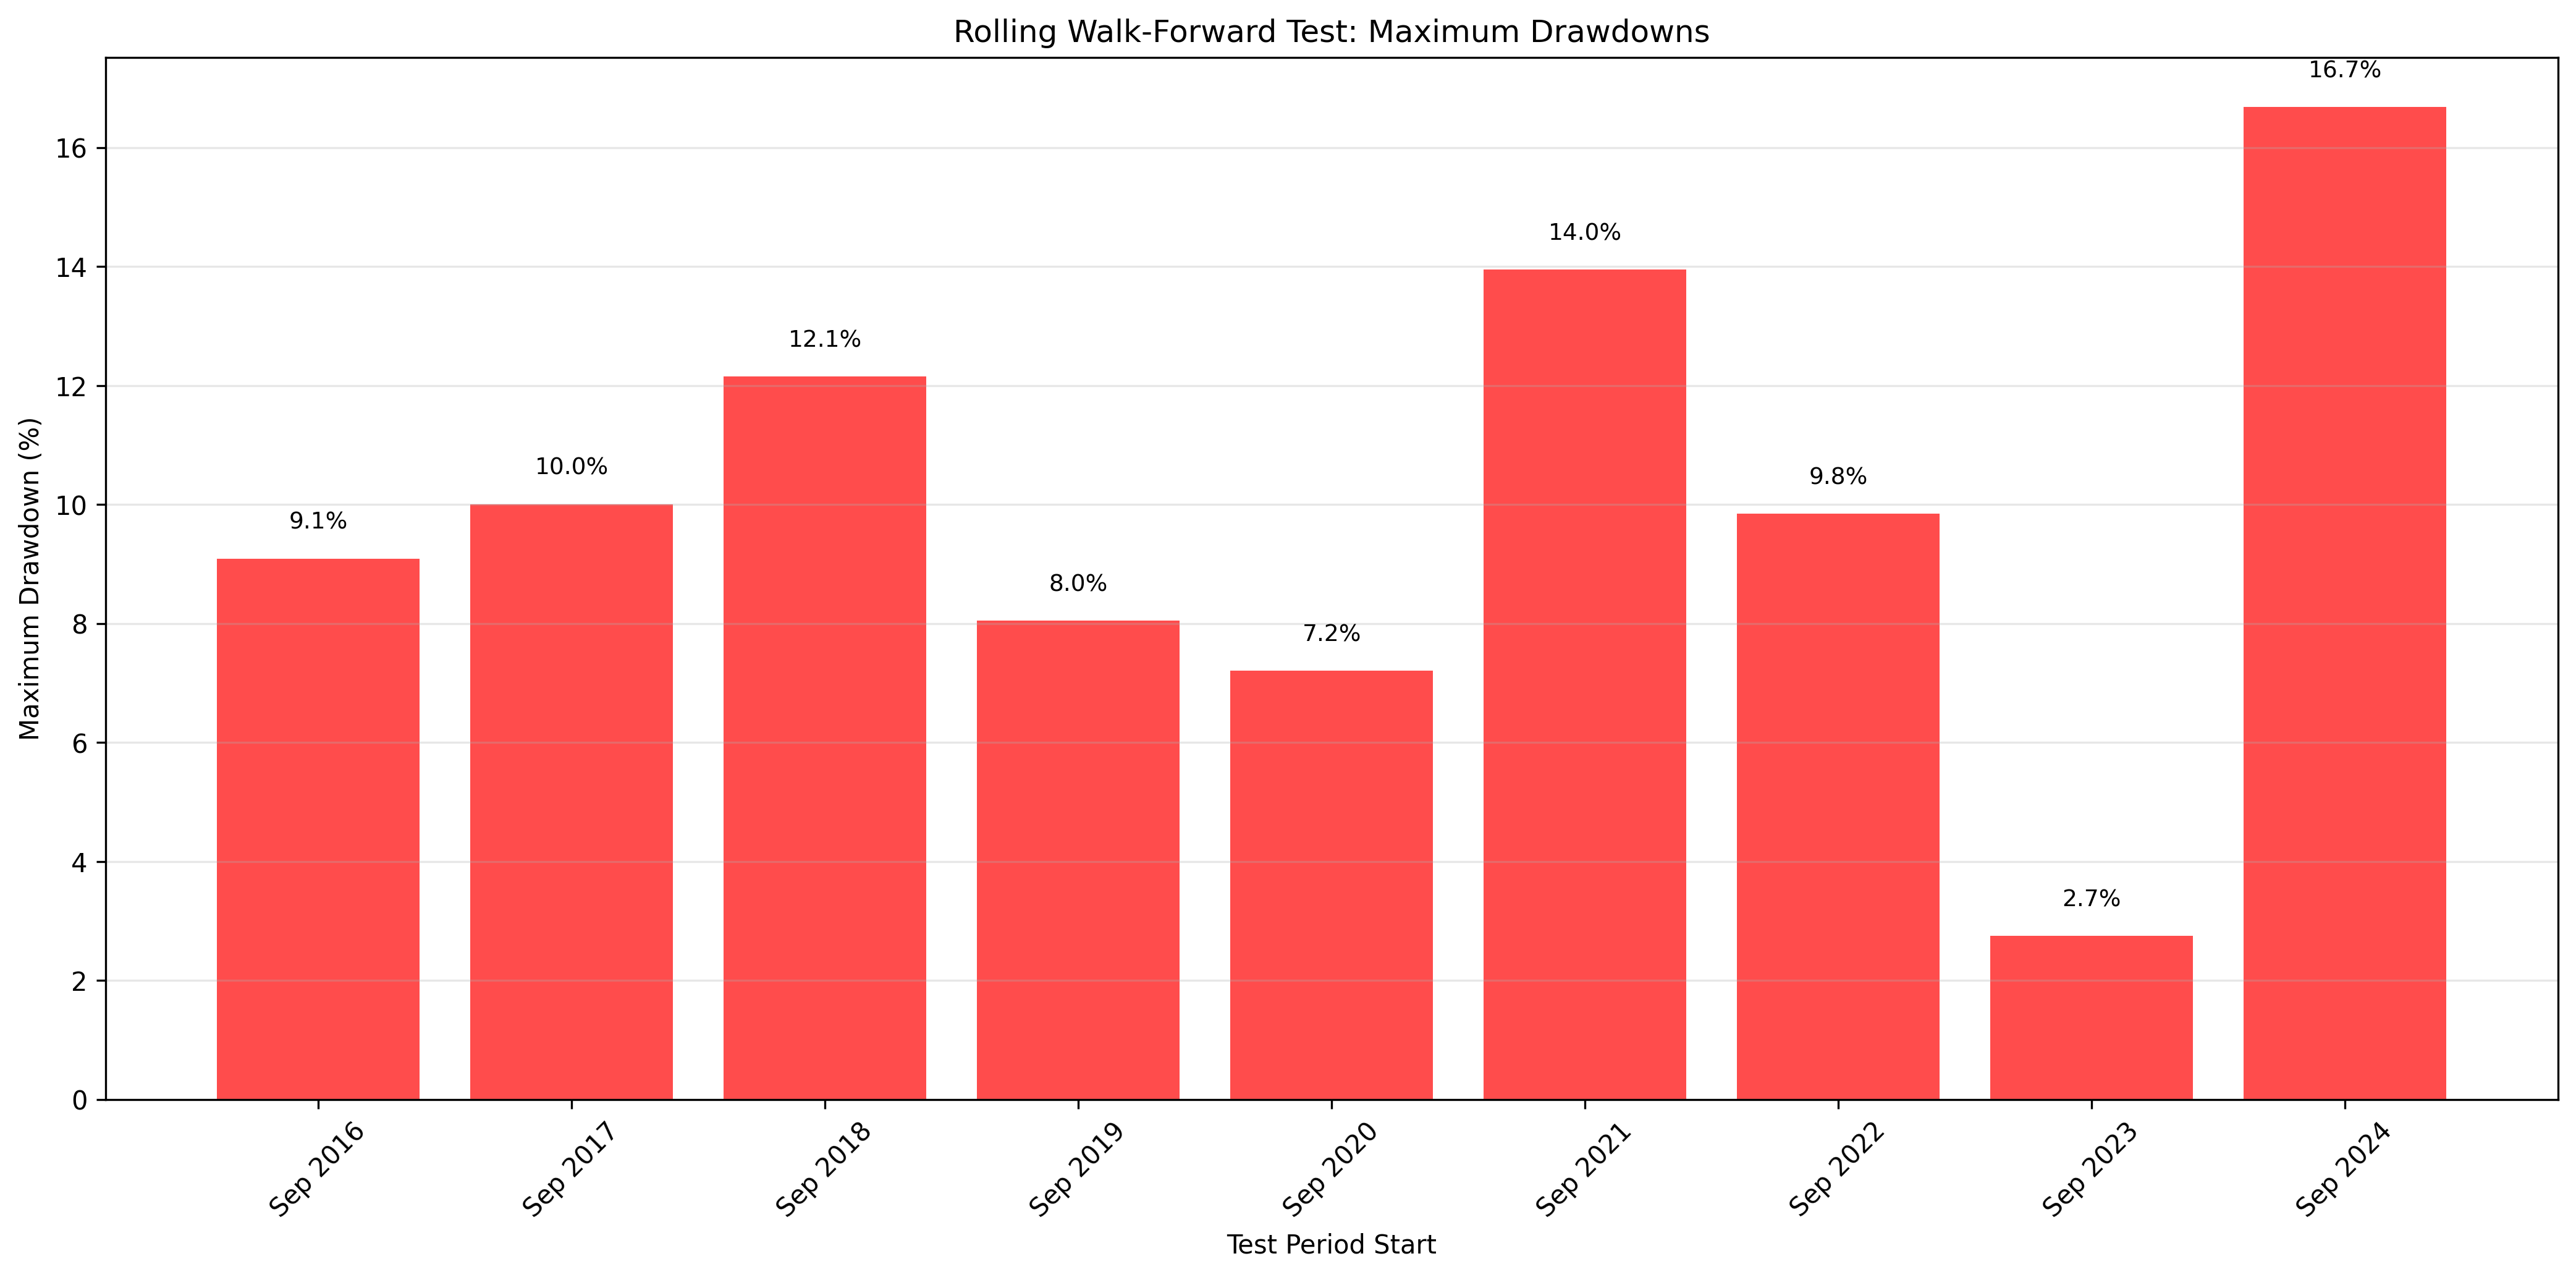
| 1 | 55 | 81 | 9.09% | 2017-02-10 | 2017-05-02 |
| 2 | 42 | 60 | 6.45% | 2016-09-22 | 2016-11-21 |
| 3 | 72 | 104 | 3.81% | 2017-05-26 | 2017-09-07 |
| 4 | 17 | 28 | 0.58% | 2016-12-20 | 2017-01-17 |
| Rank | Trading Days | Calendar Days | Max Drawdown | Start Date | End Date |
|---|---|---|---|---|---|
| 1 | 51 | 74 | 10.01% | 2017-09-15 | 2017-11-28 |
| 2 | 34 | 53 | 7.04% | 2017-12-01 | 2018-01-23 |
| 3 | 33 | 48 | 1.65% | 2018-04-17 | 2018-06-04 |
| Rank | Trading Days | Calendar Days | Max Drawdown | Start Date | End Date |
|---|---|---|---|---|---|
| 1 | 14 | 21 | 12.15% | 2018-12-03 | 2018-12-24 |
| 2 | 20 | 28 | 5.47% | 2018-09-13 | 2018-10-11 |
| 3 | 16 | 23 | 2.13% | 2018-11-07 | 2018-11-30 |
No significant drawdown periods (>20 calendar days) found.
| Rank | Trading Days | Calendar Days | Max Drawdown | Start Date | End Date |
|---|---|---|---|---|---|
| 1 | 70 | 100 | 7.20% | 2021-01-26 | 2021-05-06 |
| 2 | 60 | 87 | 4.62% | 2020-10-13 | 2021-01-08 |
| 3 | 15 | 21 | 1.49% | 2021-06-10 | 2021-07-01 |
| Rank | Trading Days | Calendar Days | Max Drawdown | Start Date | End Date |
|---|---|---|---|---|---|
| 1 | 95 | 138 | 13.95% | 2021-12-29 | 2022-05-16 |
| 2 | 25 | 38 | 7.18% | 2021-10-29 | 2021-12-06 |
| 3 | 18 | 27 | 2.75% | 2022-07-01 | 2022-07-28 |
| Rank | Trading Days | Calendar Days | Max Drawdown | Start Date | End Date |
|---|---|---|---|---|---|
| 1 | 76 | 109 | 9.84% | 2023-05-01 | 2023-08-18 |
| 2 | 33 | 45 | 6.69% | 2022-09-12 | 2022-10-27 |
| 3 | 77 | 115 | 2.71% | 2022-12-02 | 2023-03-27 |
| Rank | Trading Days | Calendar Days | Max Drawdown | Start Date | End Date |
|---|---|---|---|---|---|
| 1 | 21 | 31 | 2.75% | 2024-04-05 | 2024-05-06 |
| 2 | 19 | 28 | 2.48% | 2024-01-25 | 2024-02-22 |
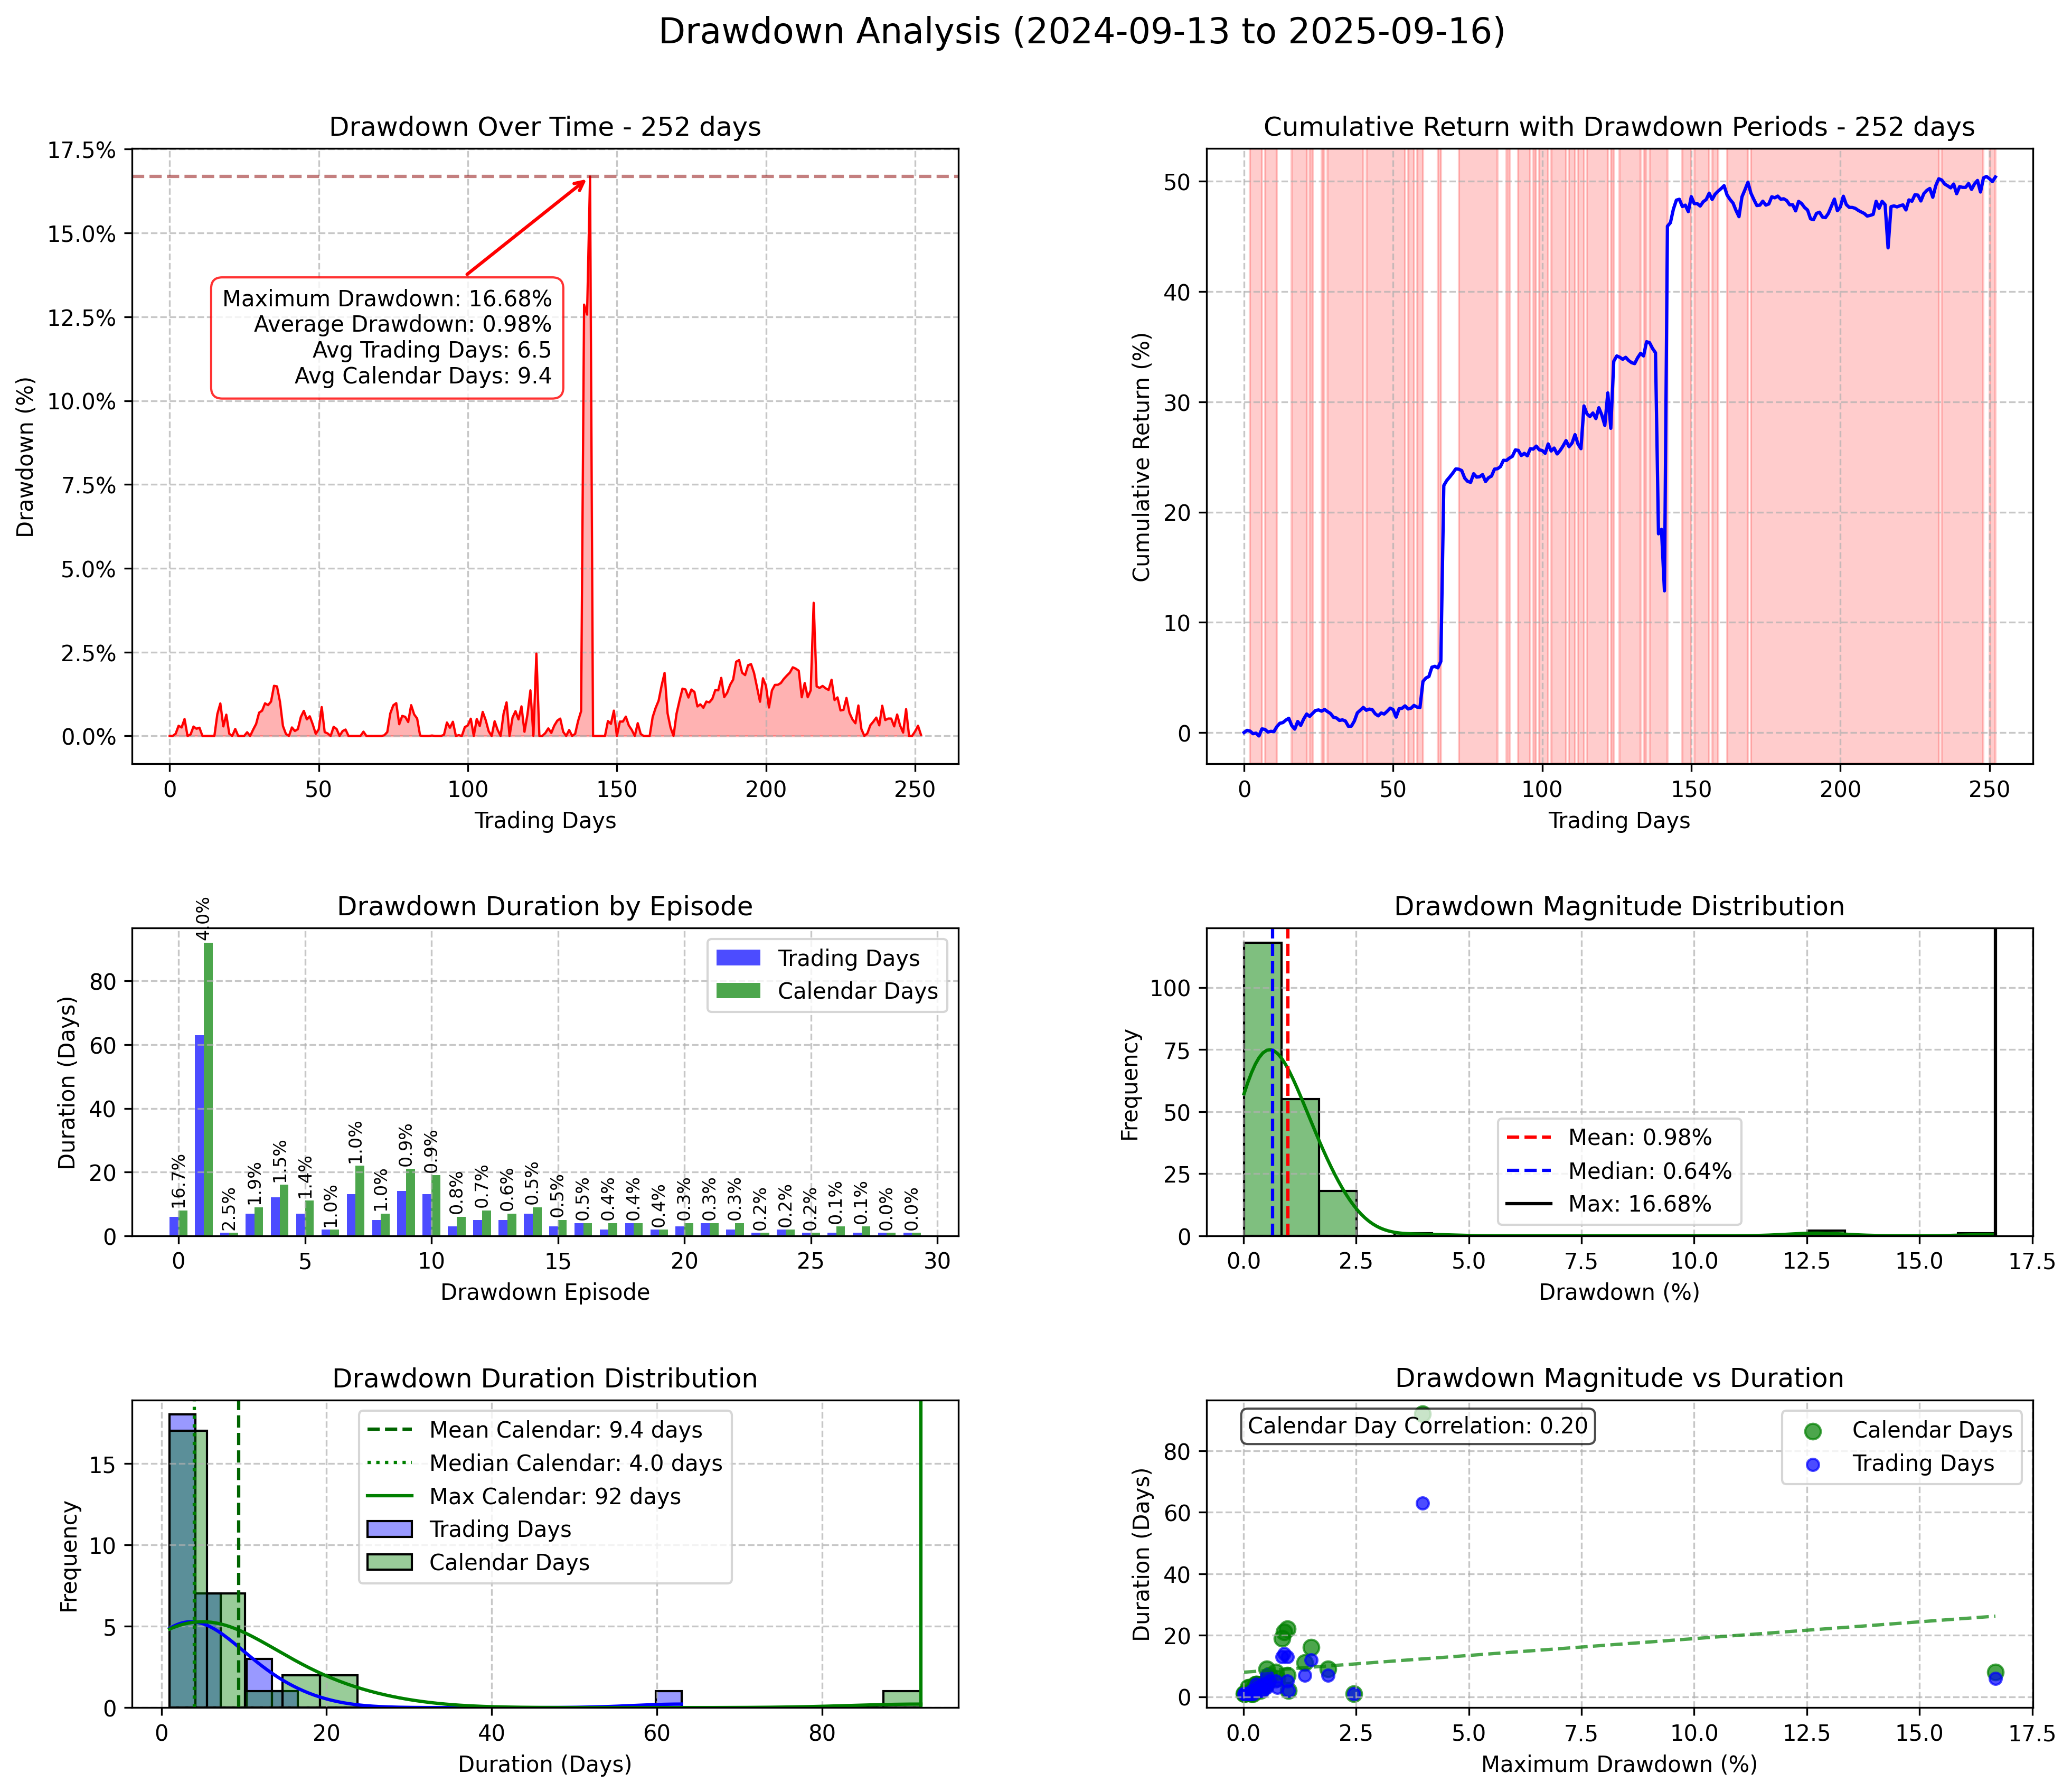
| Rank | Trading Days | Calendar Days | Max Drawdown | Start Date | End Date |
|---|---|---|---|---|---|
| 1 | 63 | 92 | 3.97% | 2025-05-19 | 2025-08-19 |
| 2 | 13 | 22 | 0.98% | 2024-12-24 | 2025-01-15 |
| 3 | 14 | 21 | 0.90% | 2025-08-20 | 2025-09-10 |
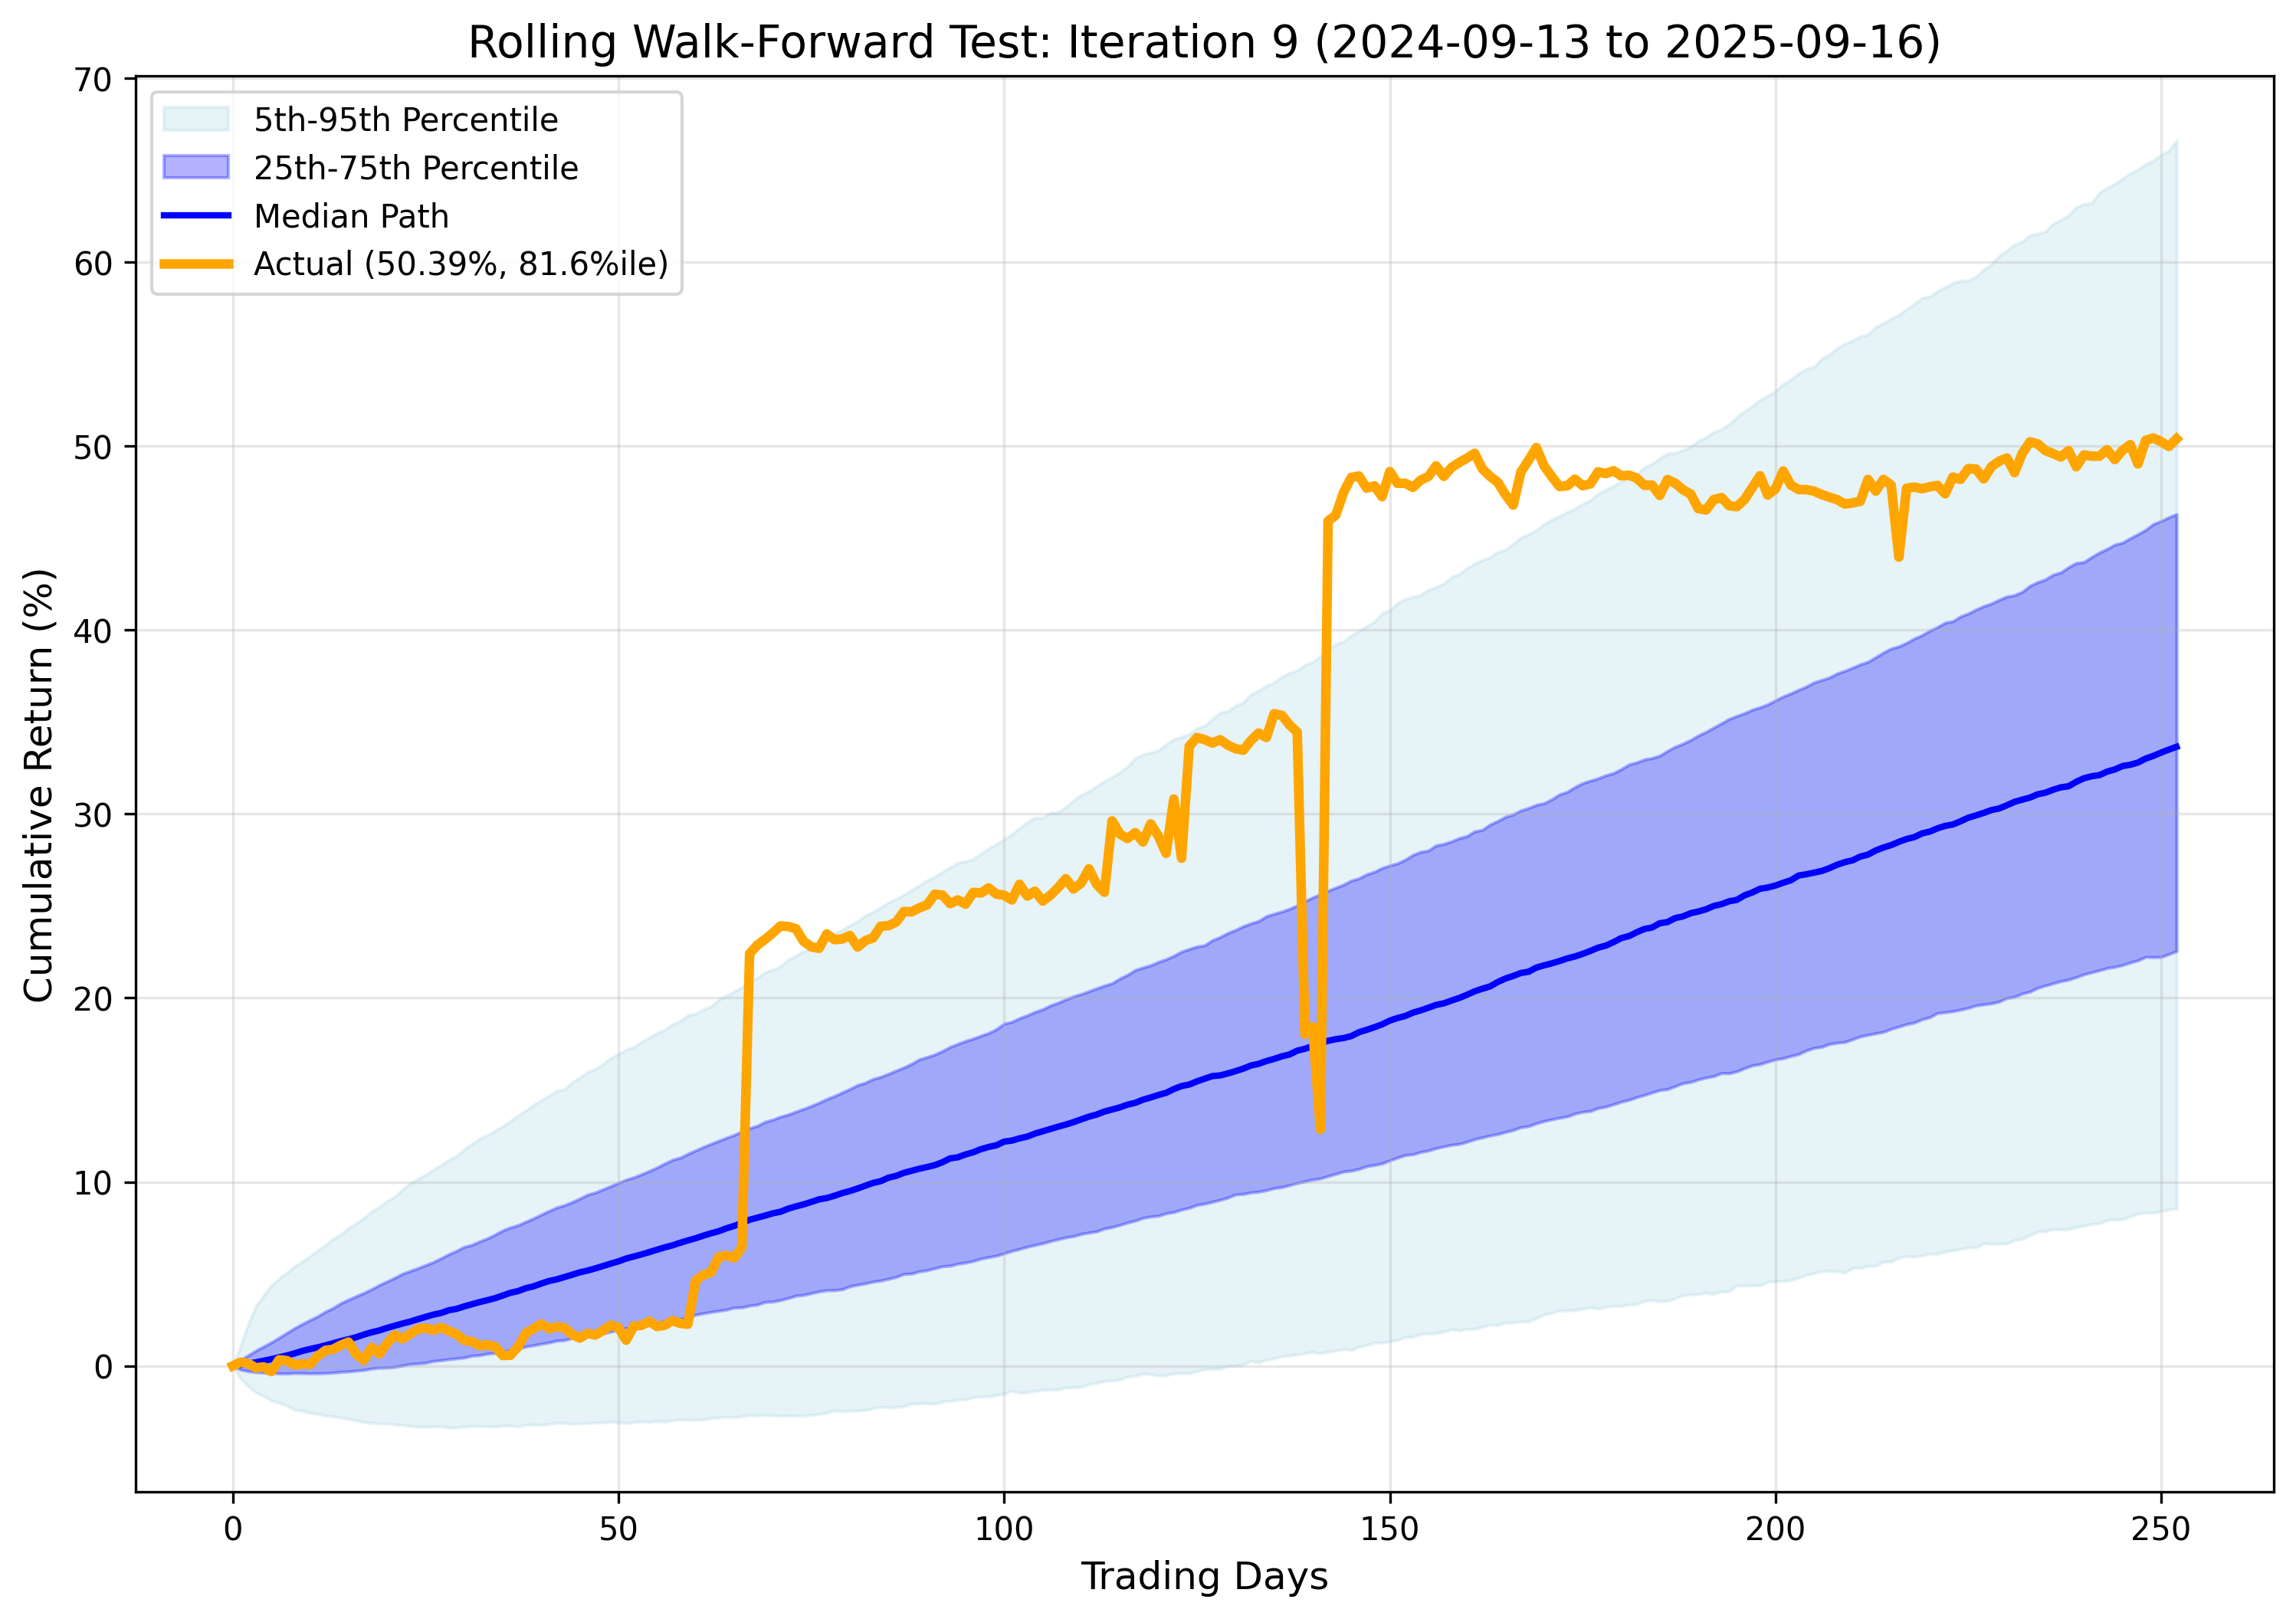
| Metric | Value |
|---|---|
| Average Actual Return | 63.53% |
| Average Forecast Return | 51.28% |
| Average Error | 12.25% |
| Average Percentile | 58.5% |
| Average Max Drawdown | 9.97% |
| Average Actual CAGR | 63.53% |
| Average Forecast CAGR | 51.28% |
Please wait while we get Zehnvisor on the line for you...