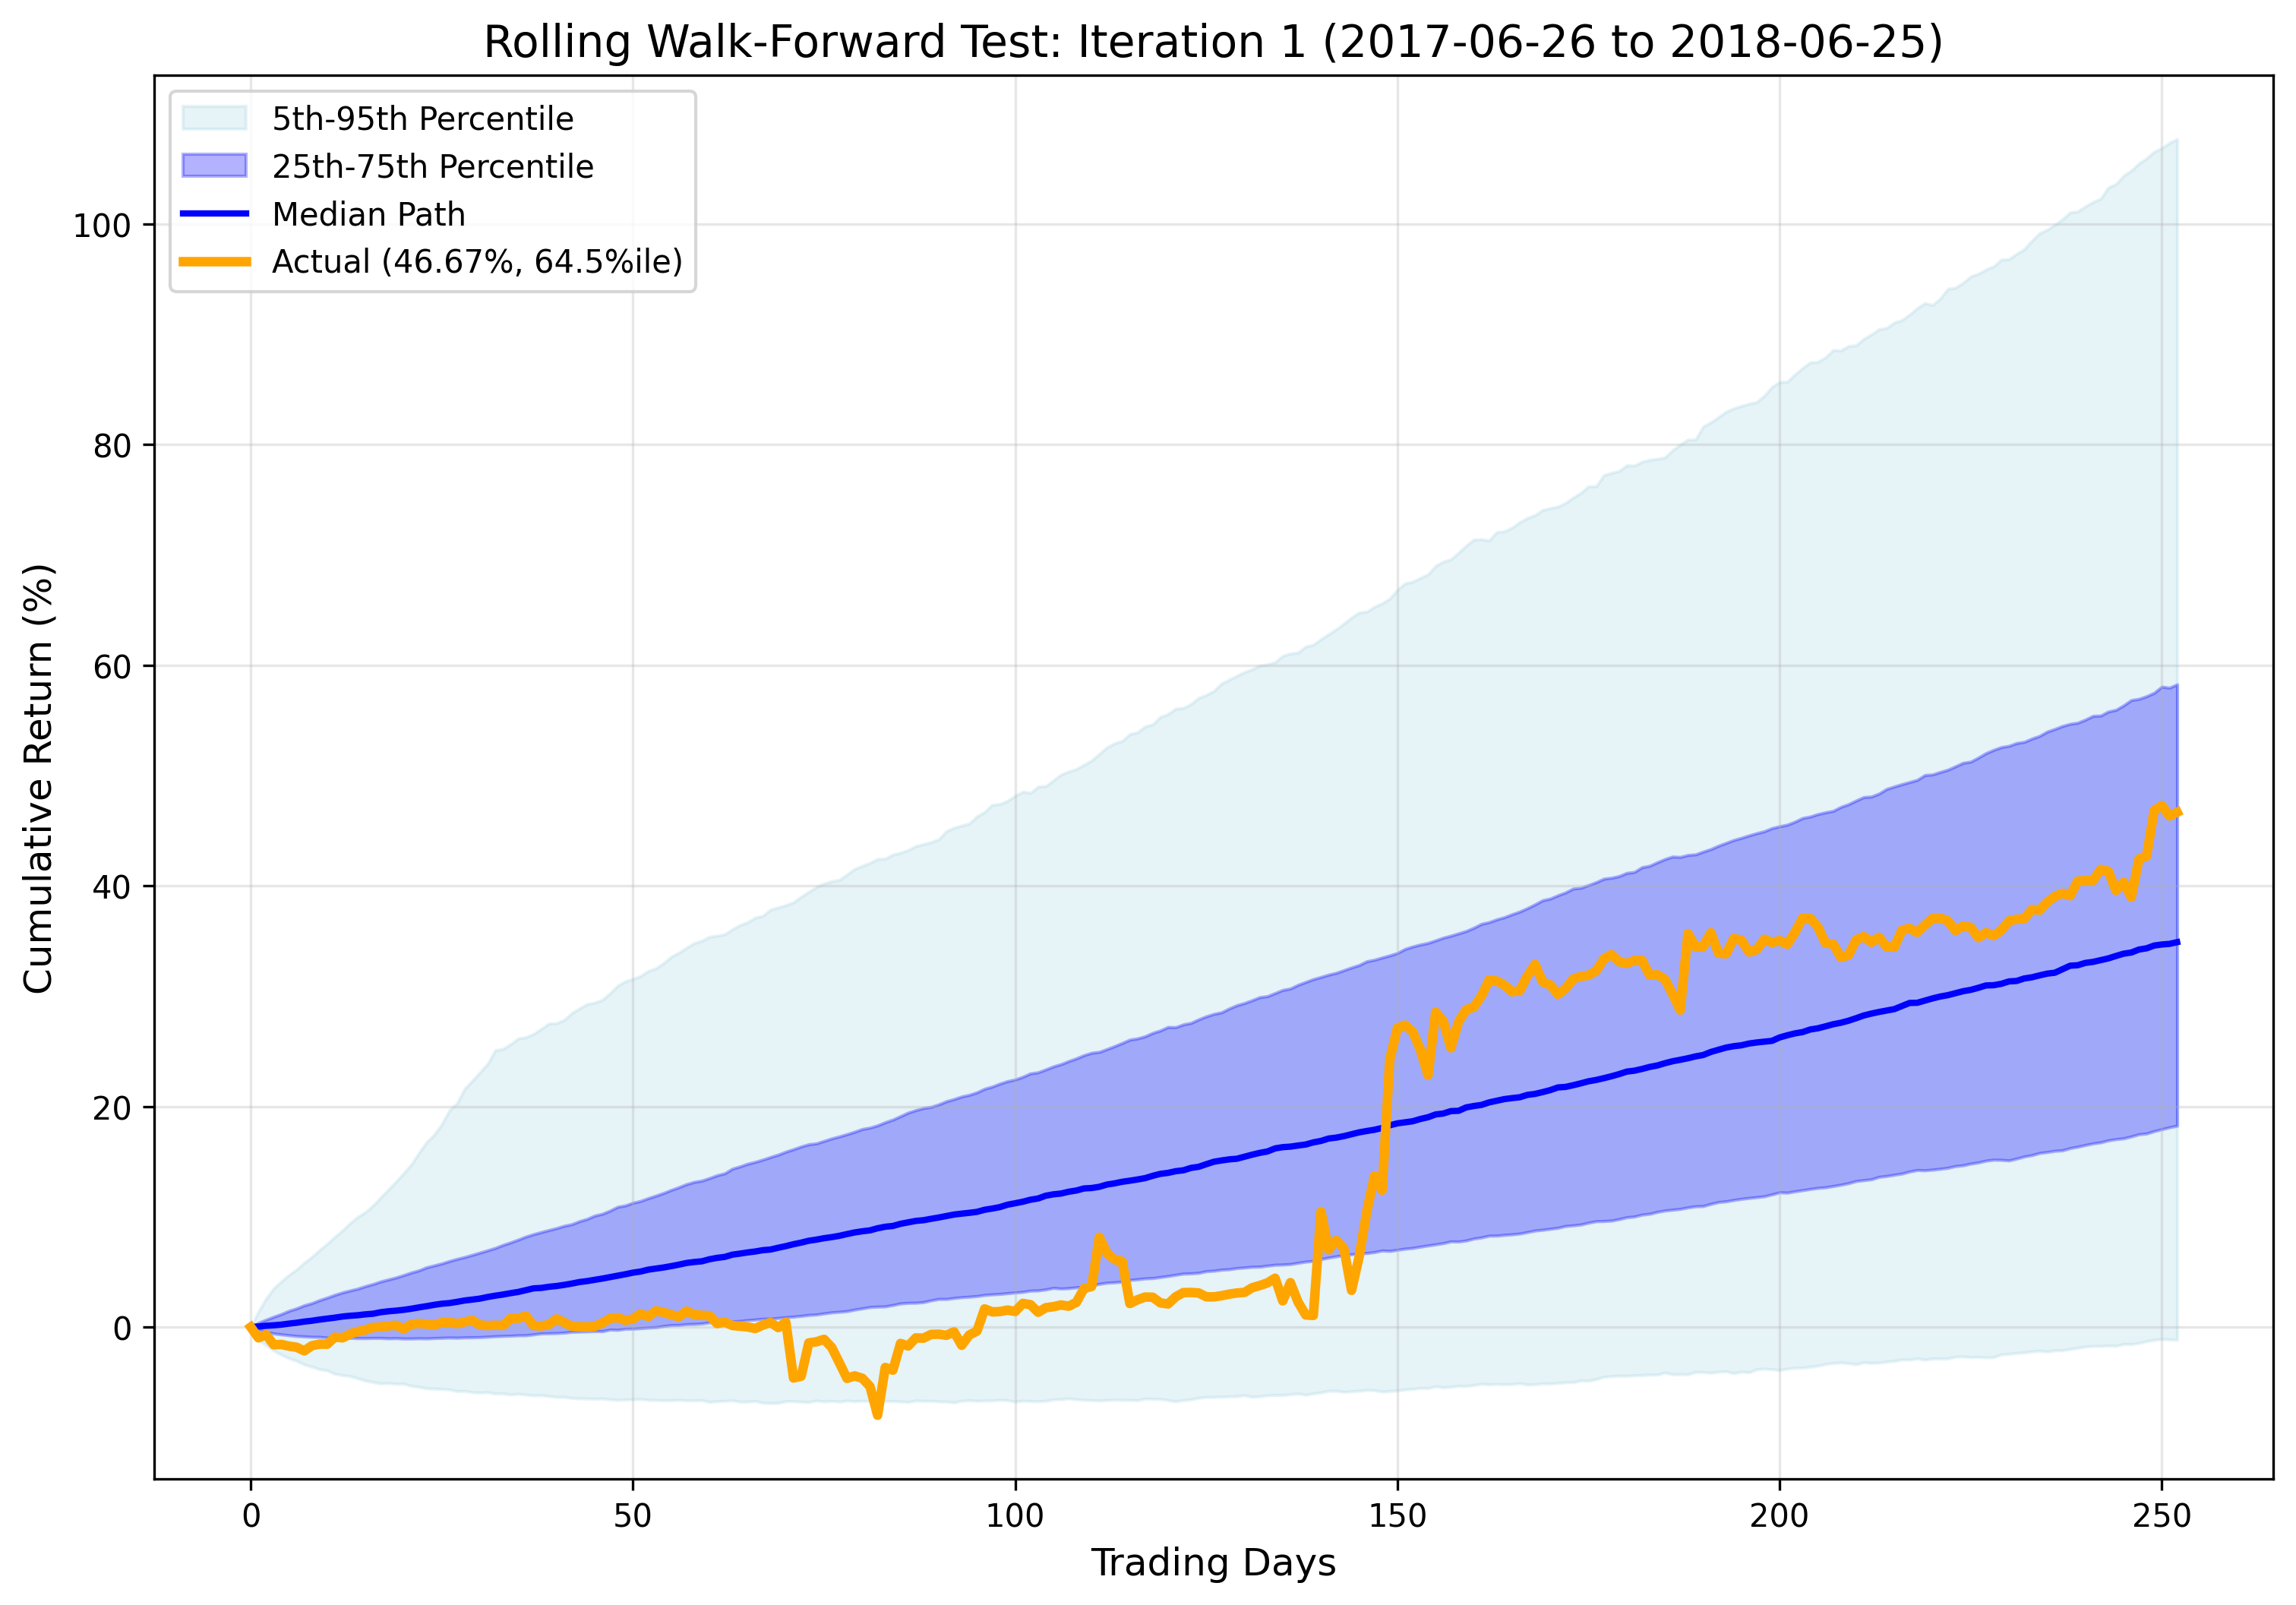
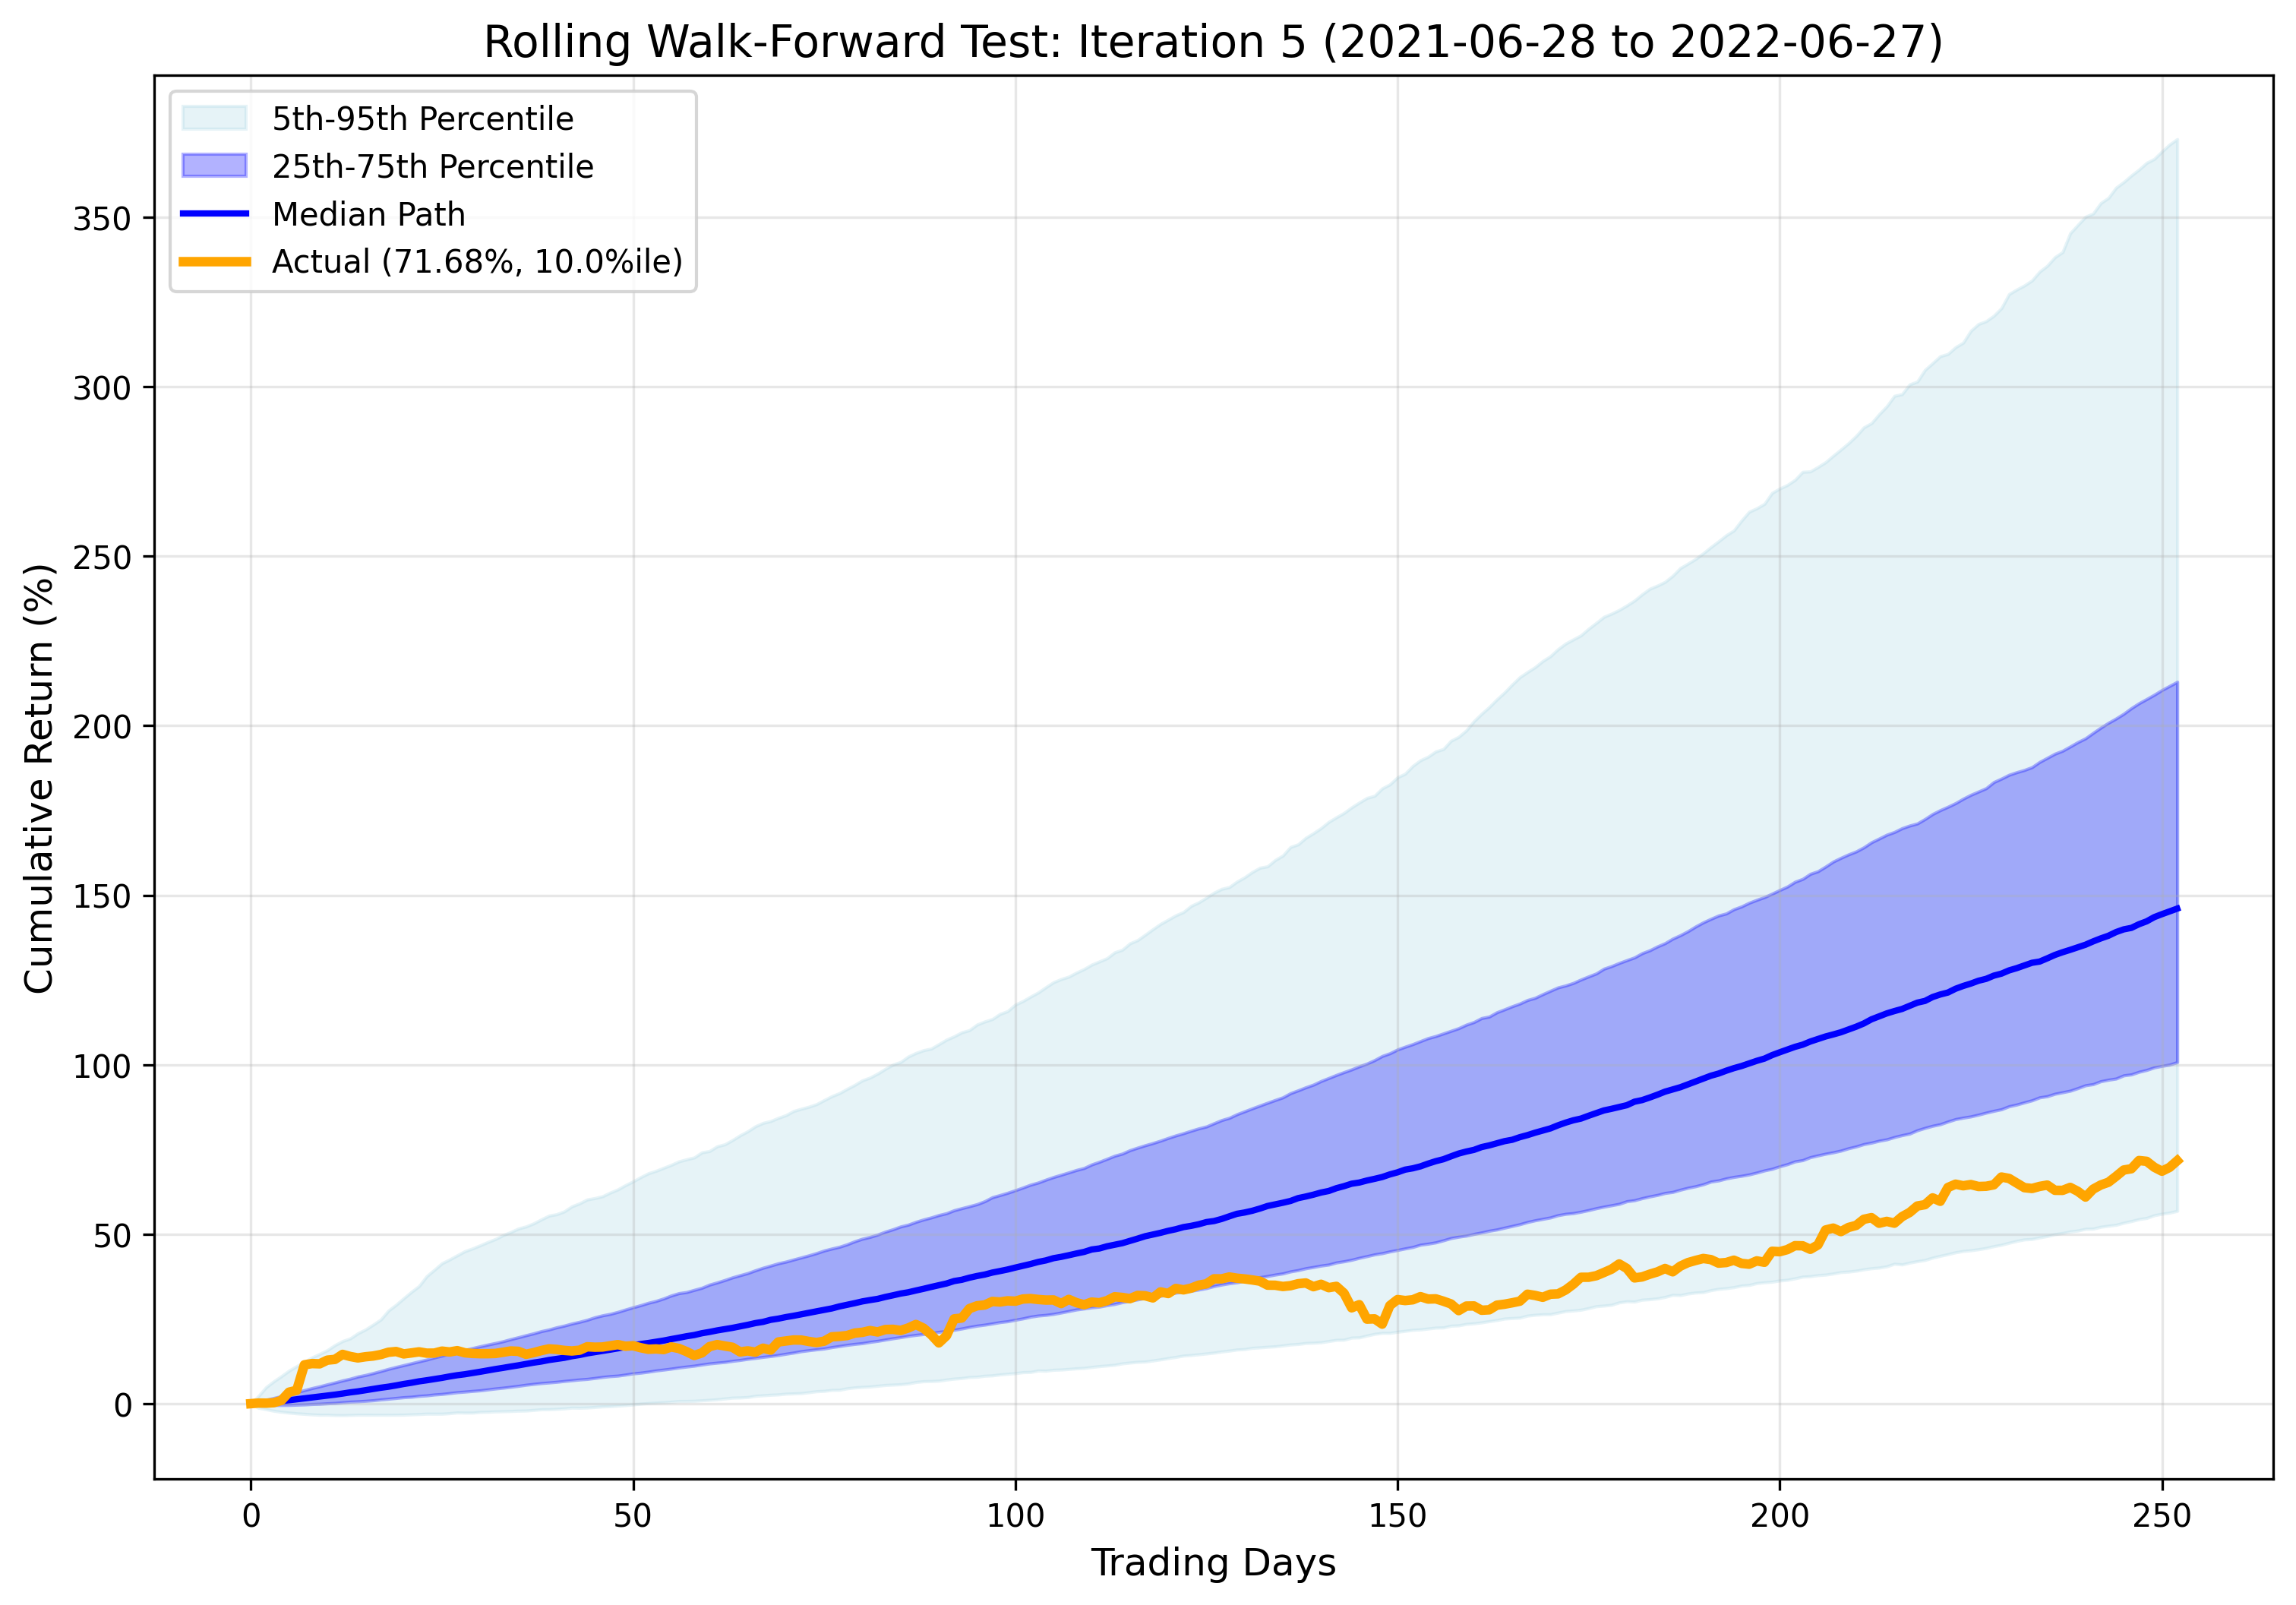
Monte Carlo robustness analysis to evaluate strategy's performance predictability using 10,000 simulations per test period within a rolling walk-forward framework
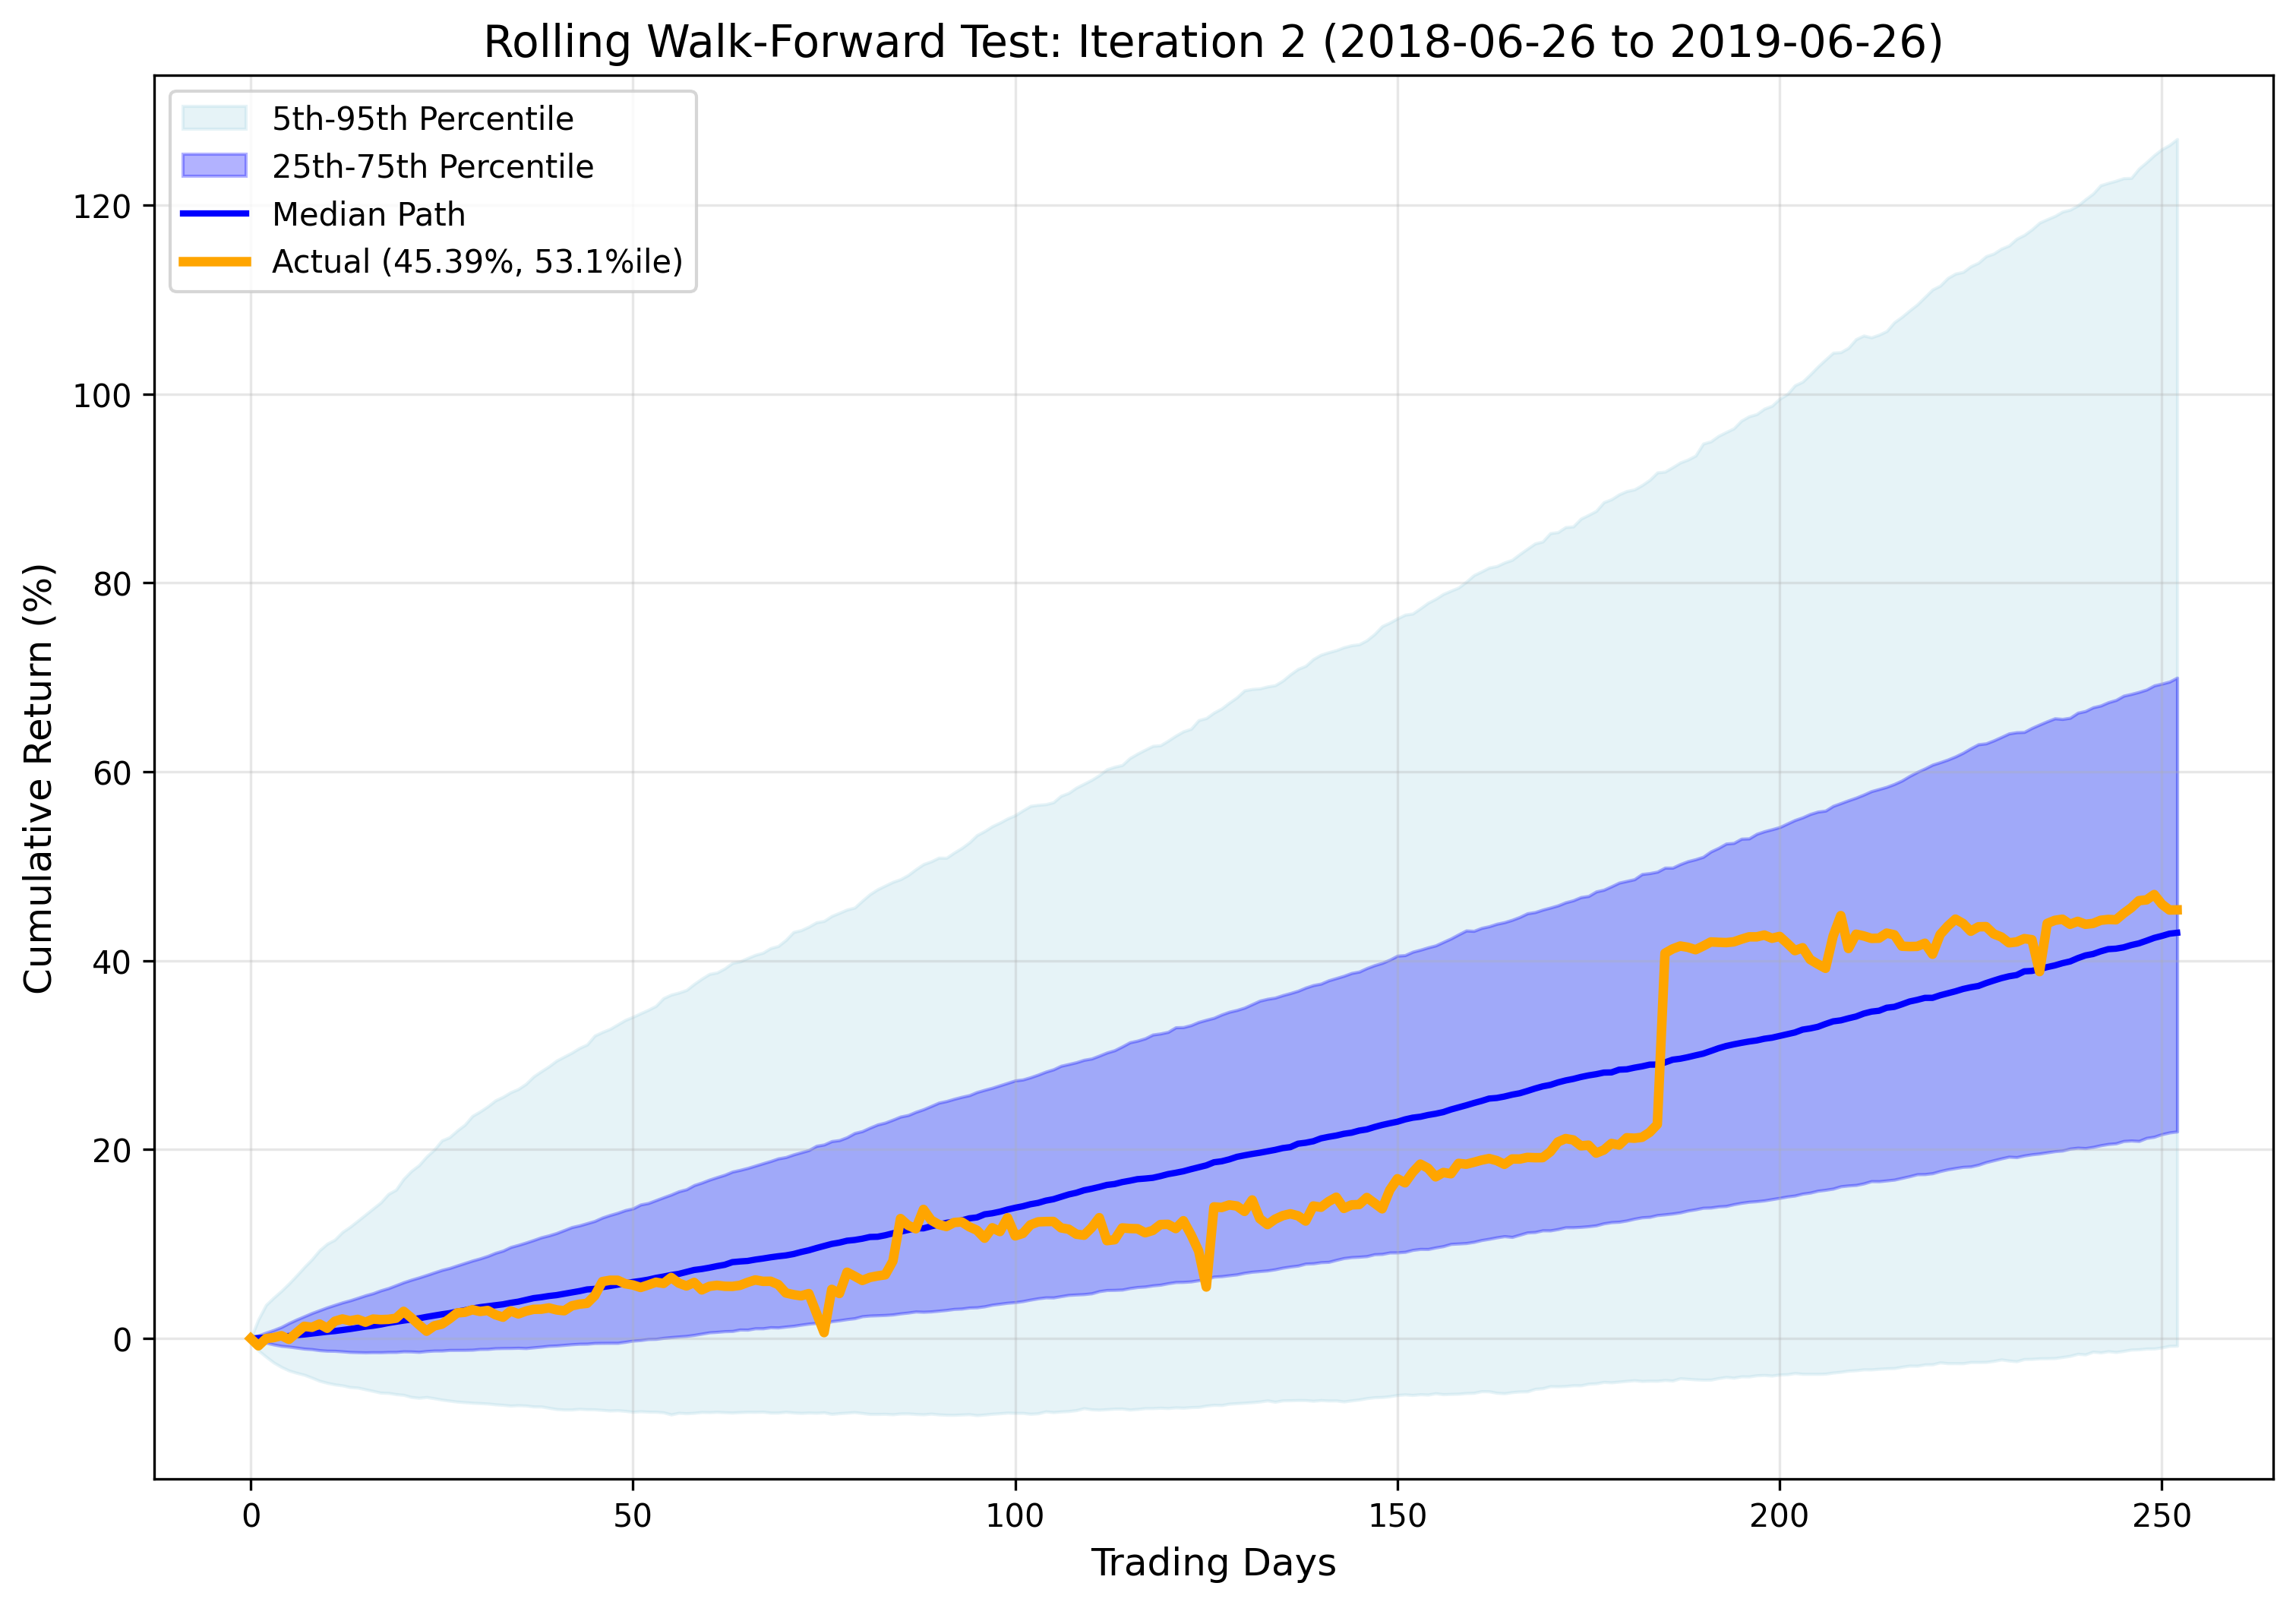
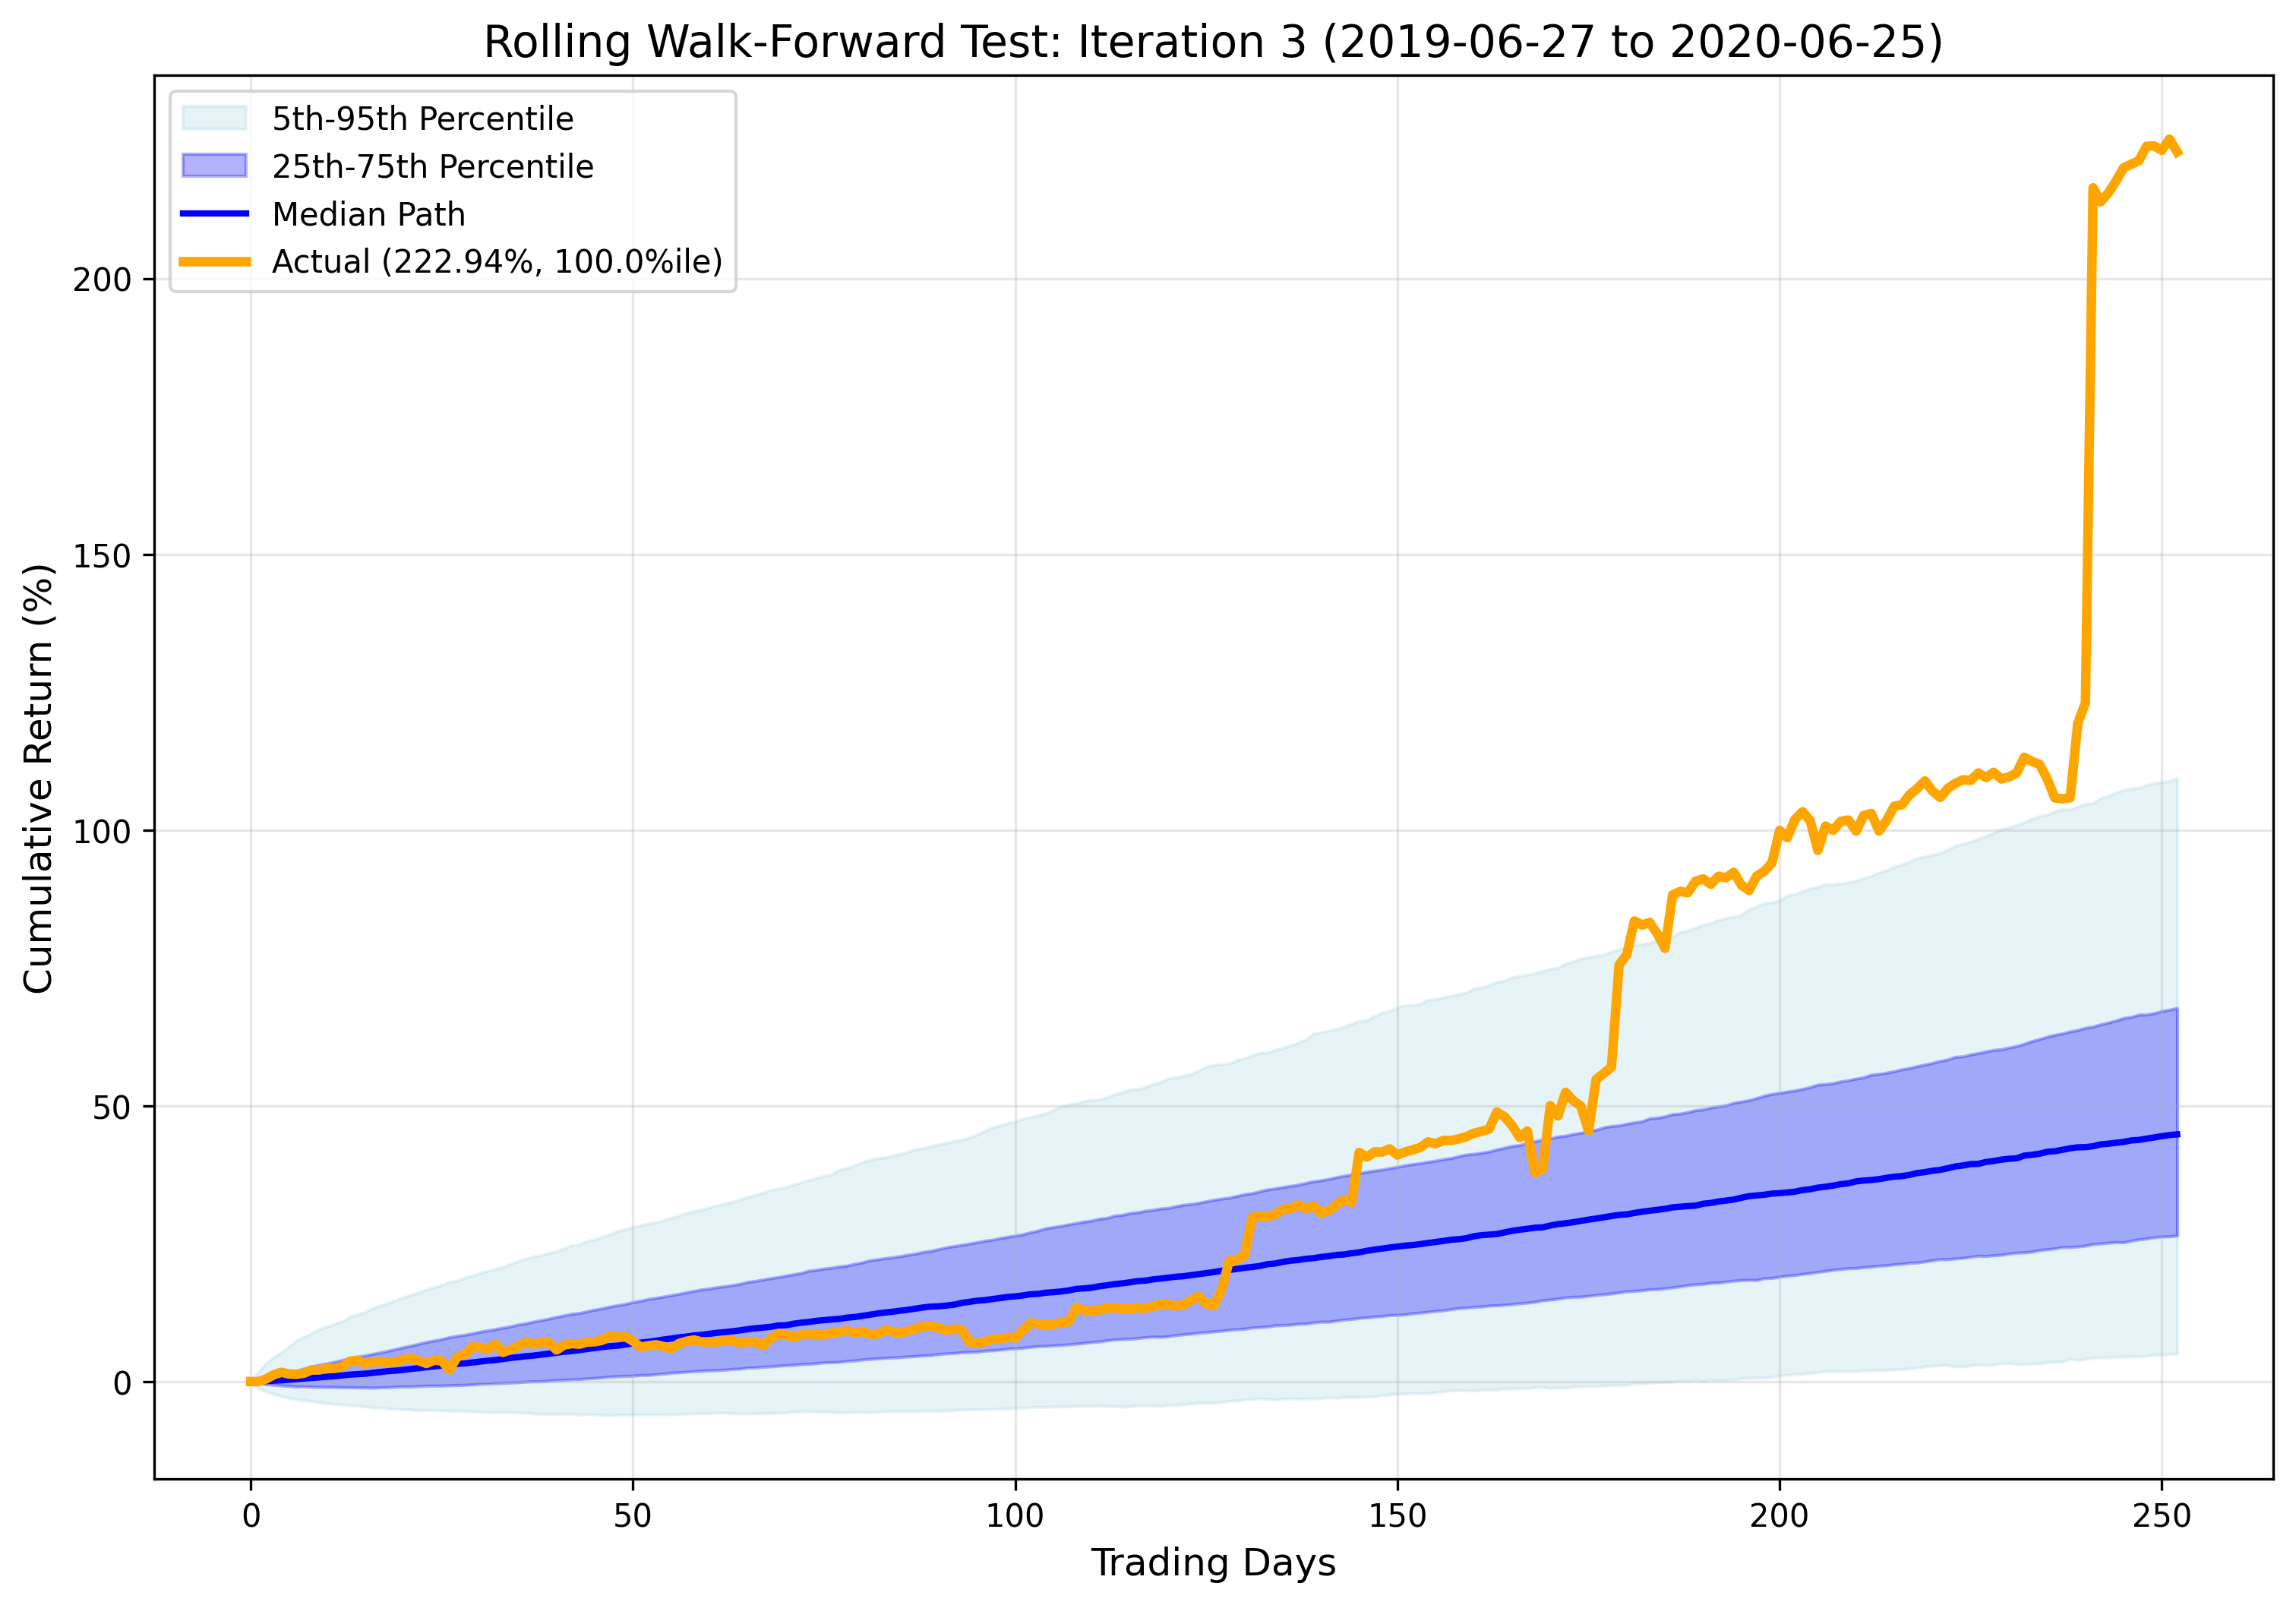
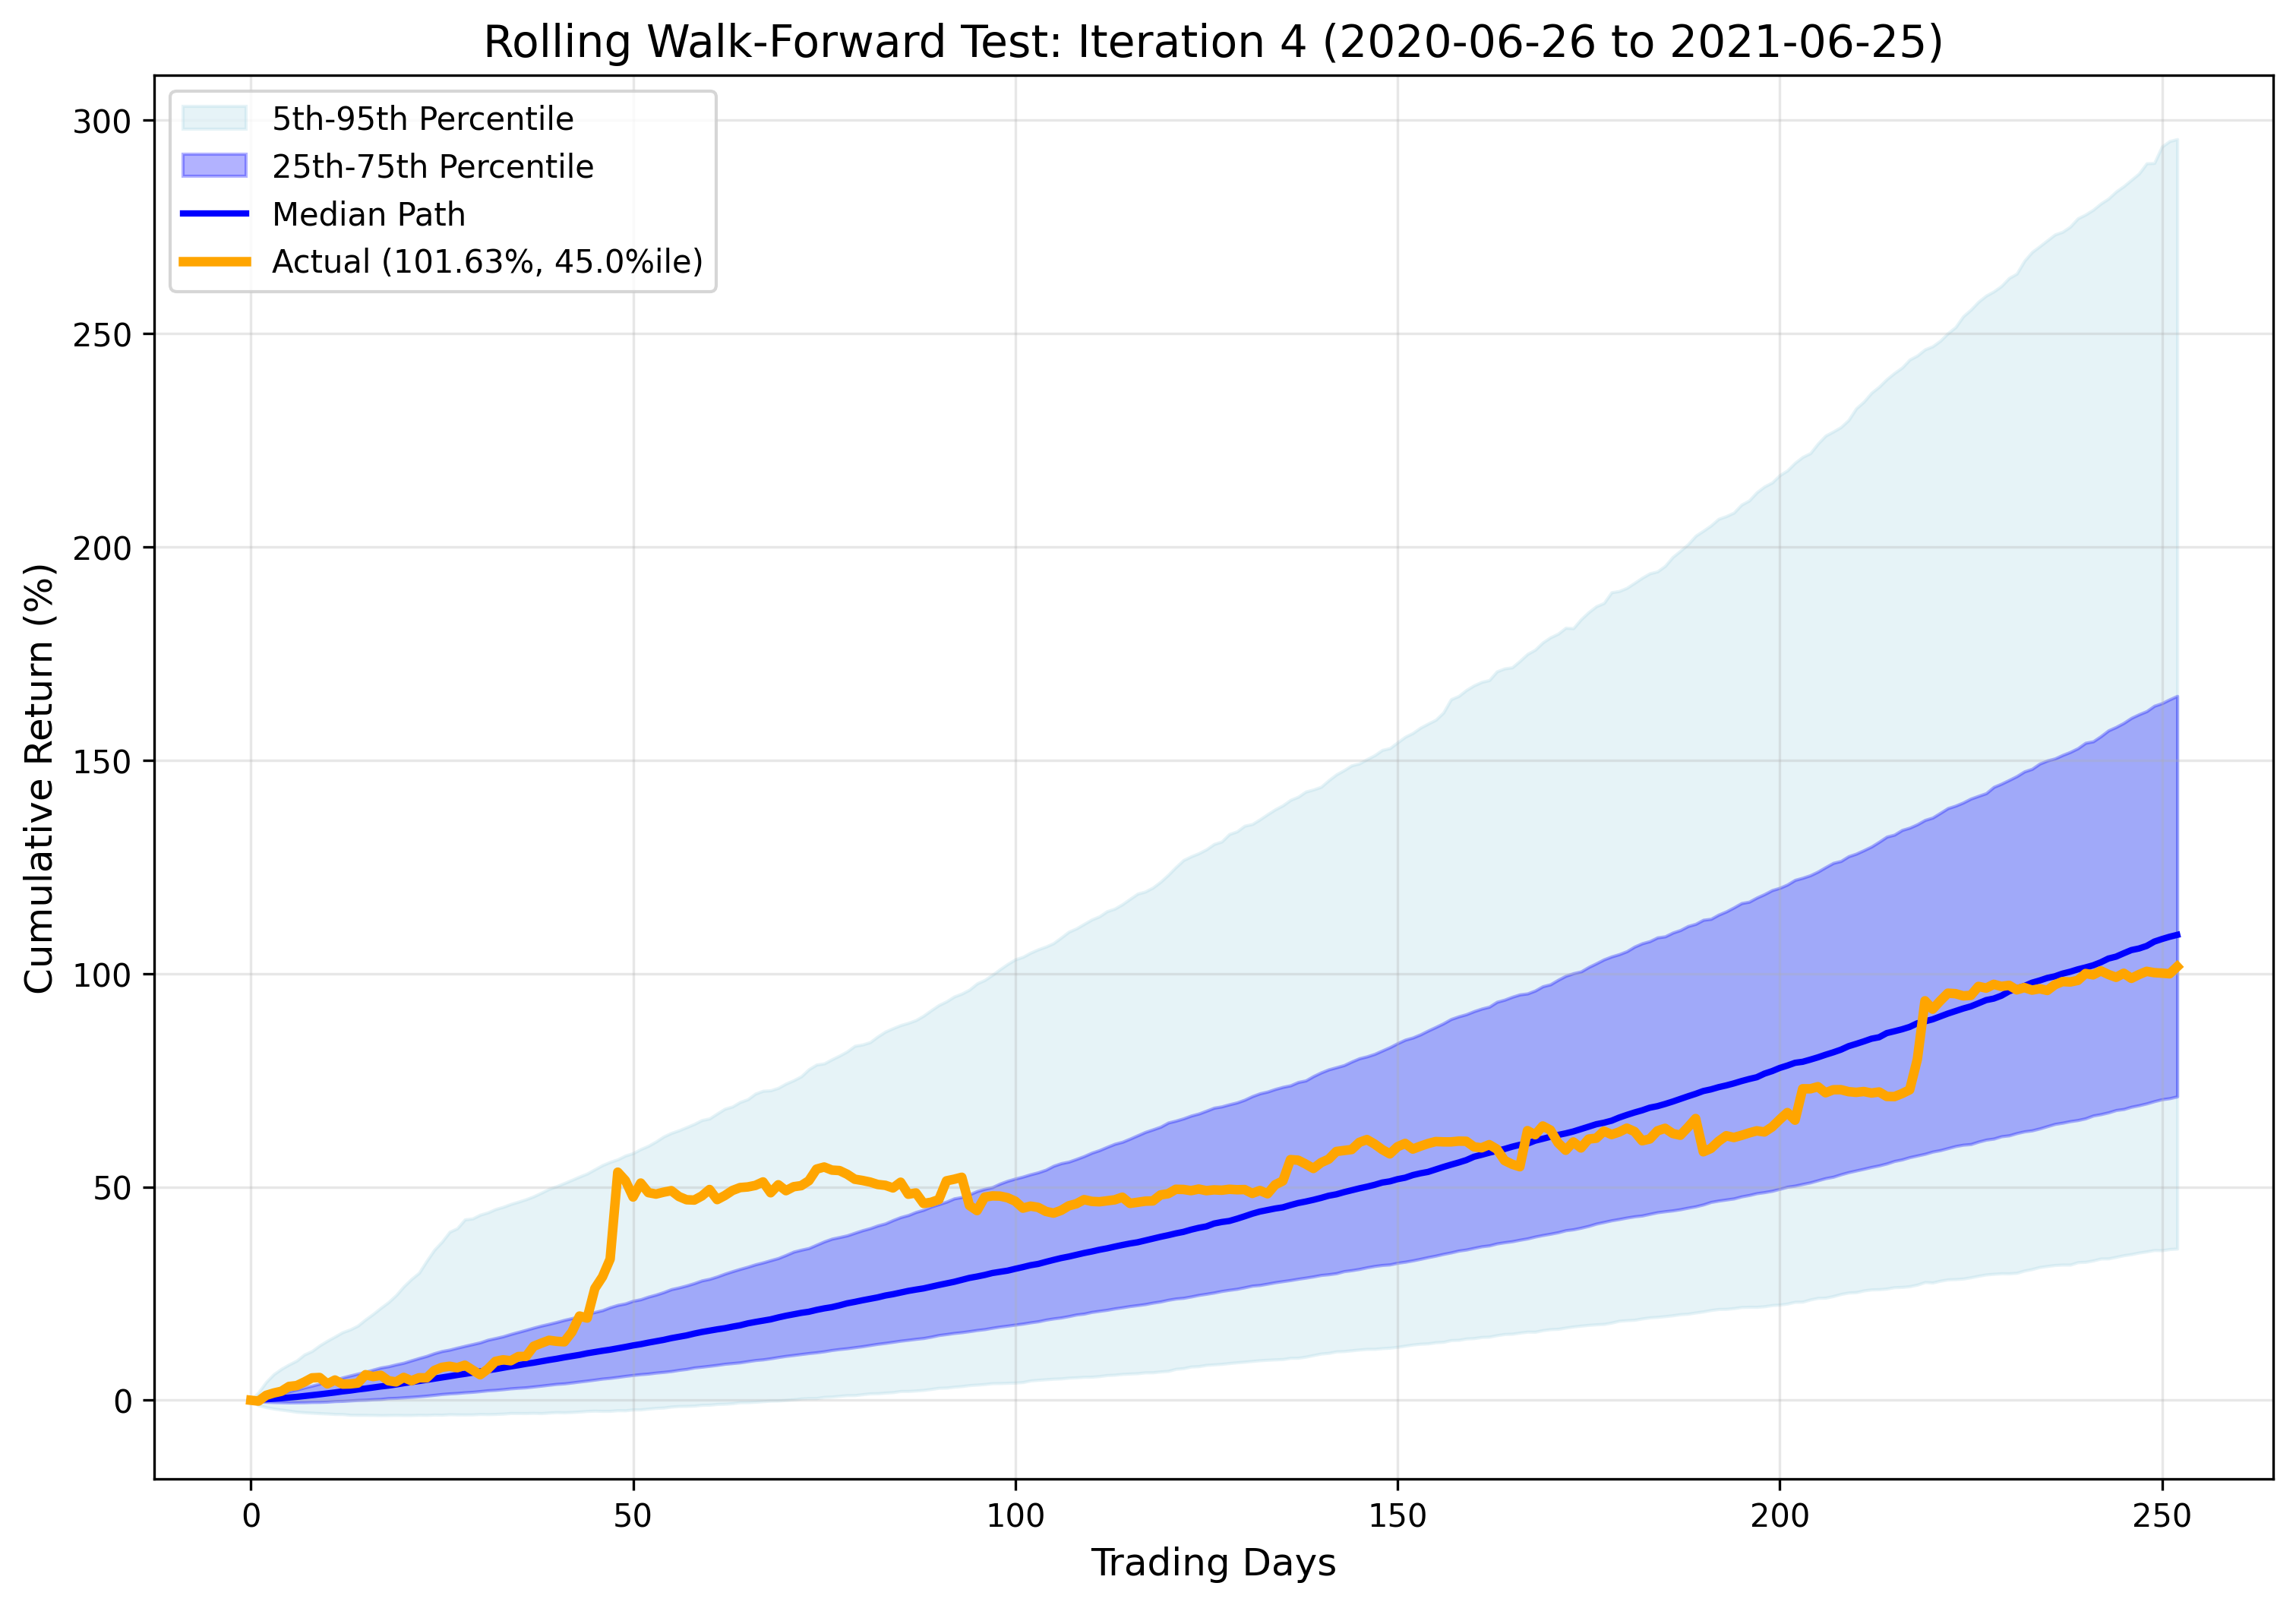
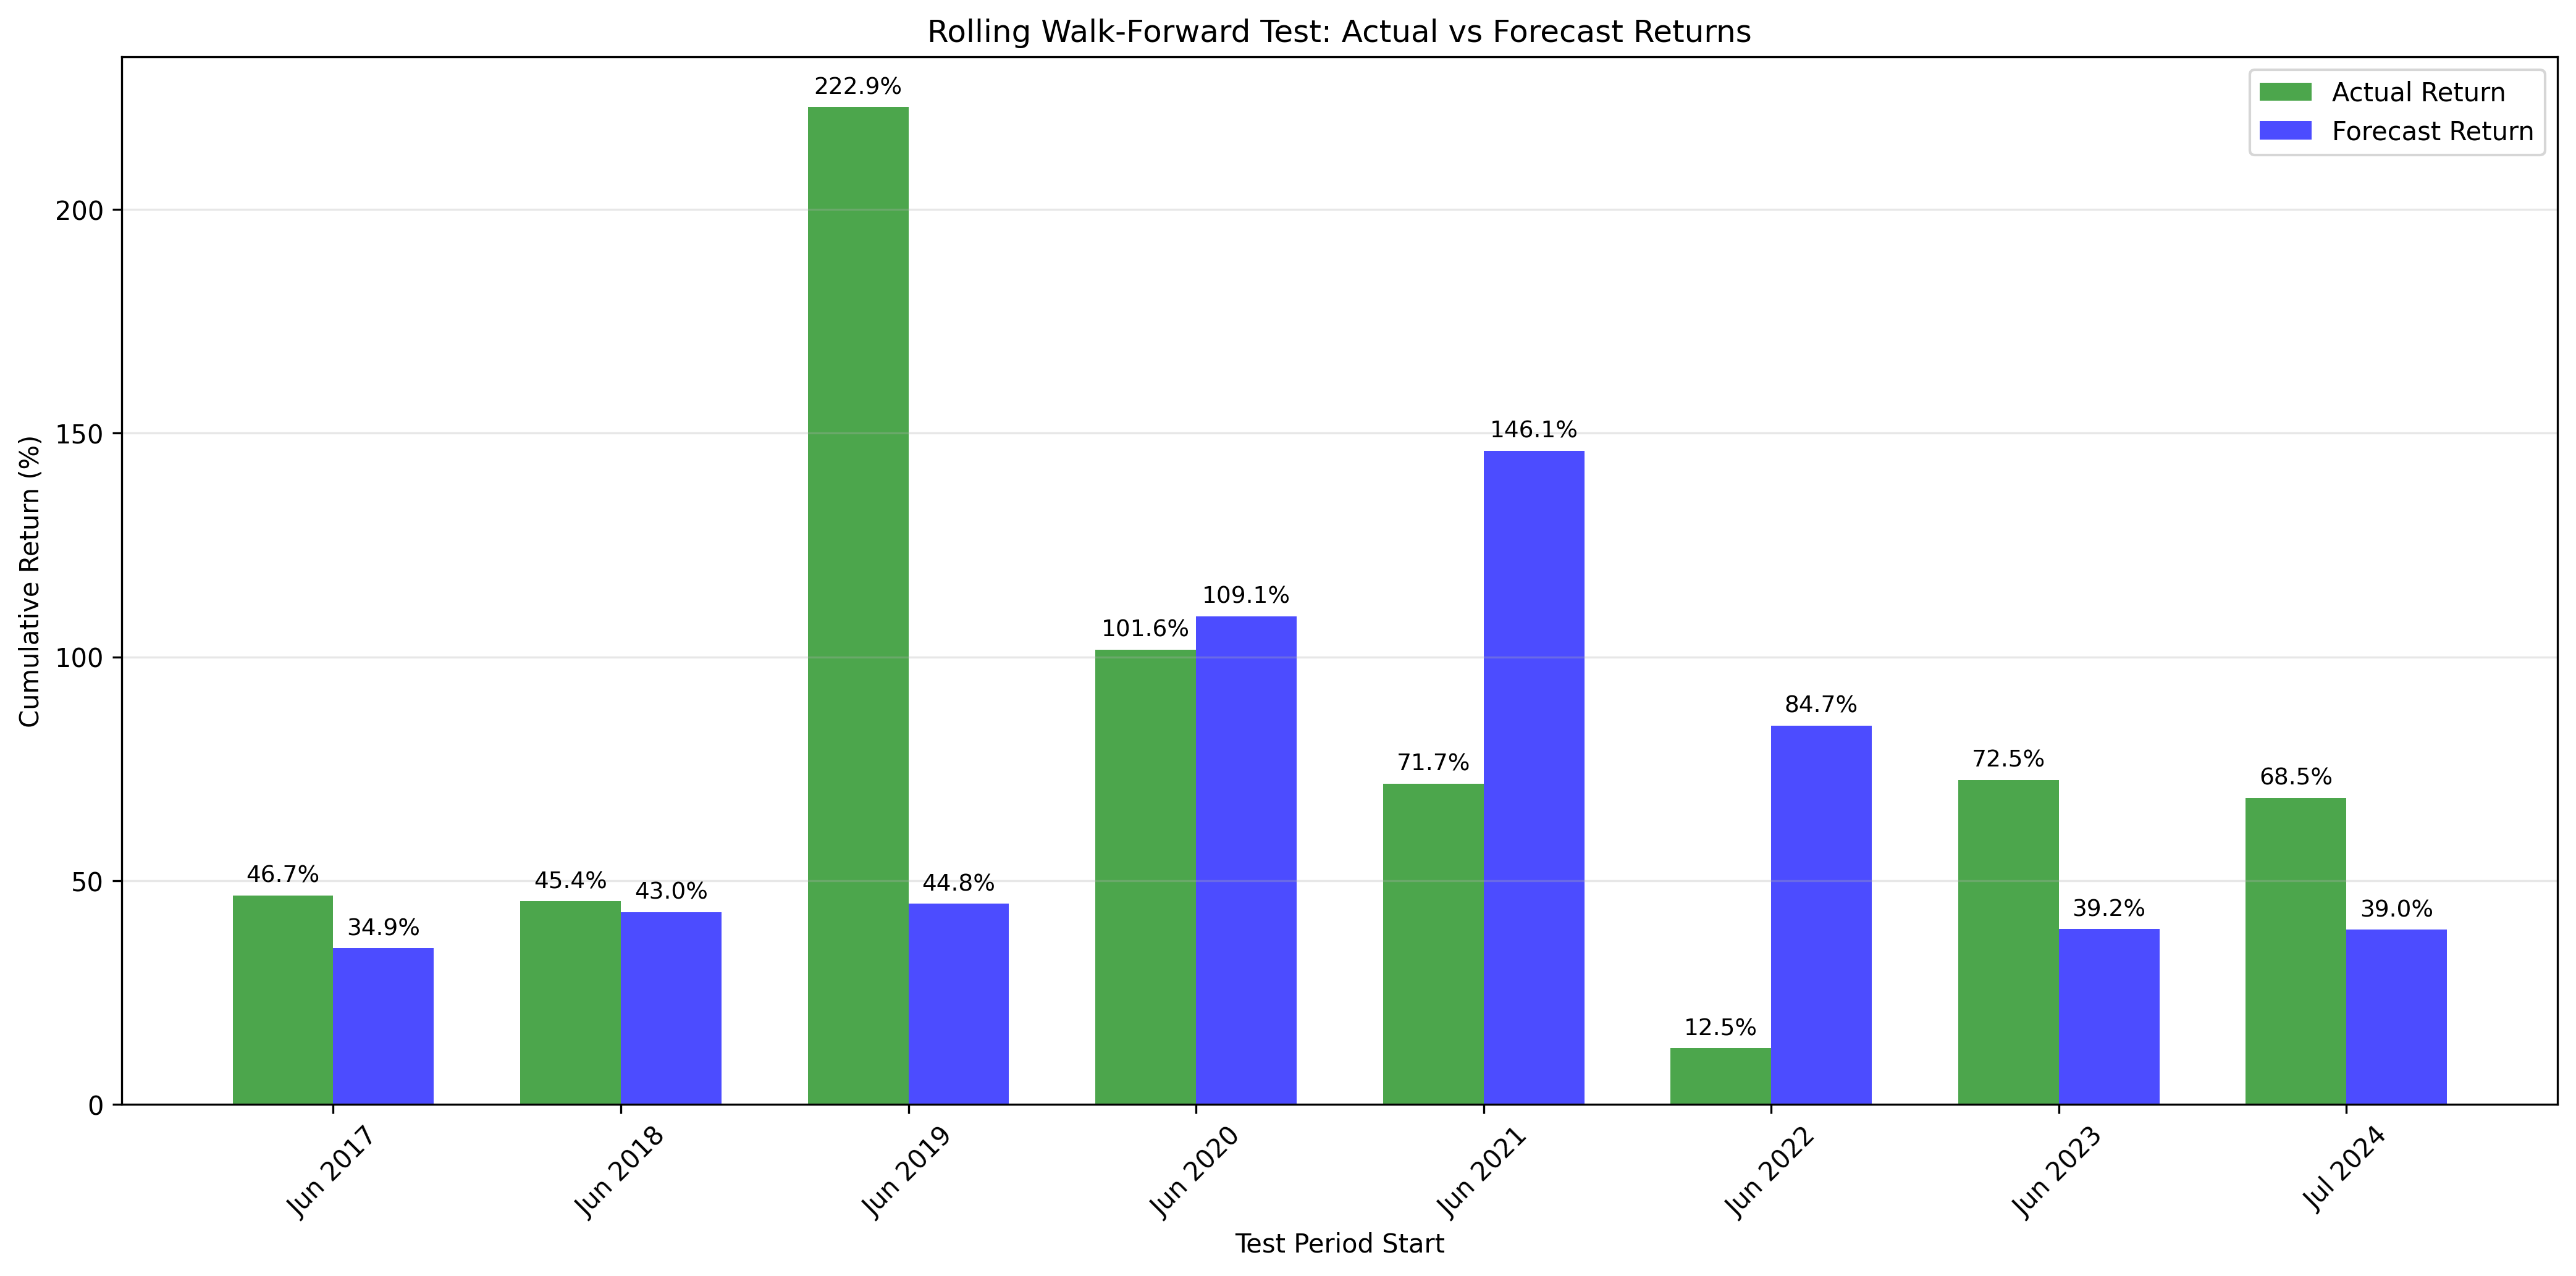
The strategy’s edge is not an artifact of a single lucky period. The Walk-Forward Analysis (8 iterations) demonstrates resilience across varied market regimes (2015–2025).
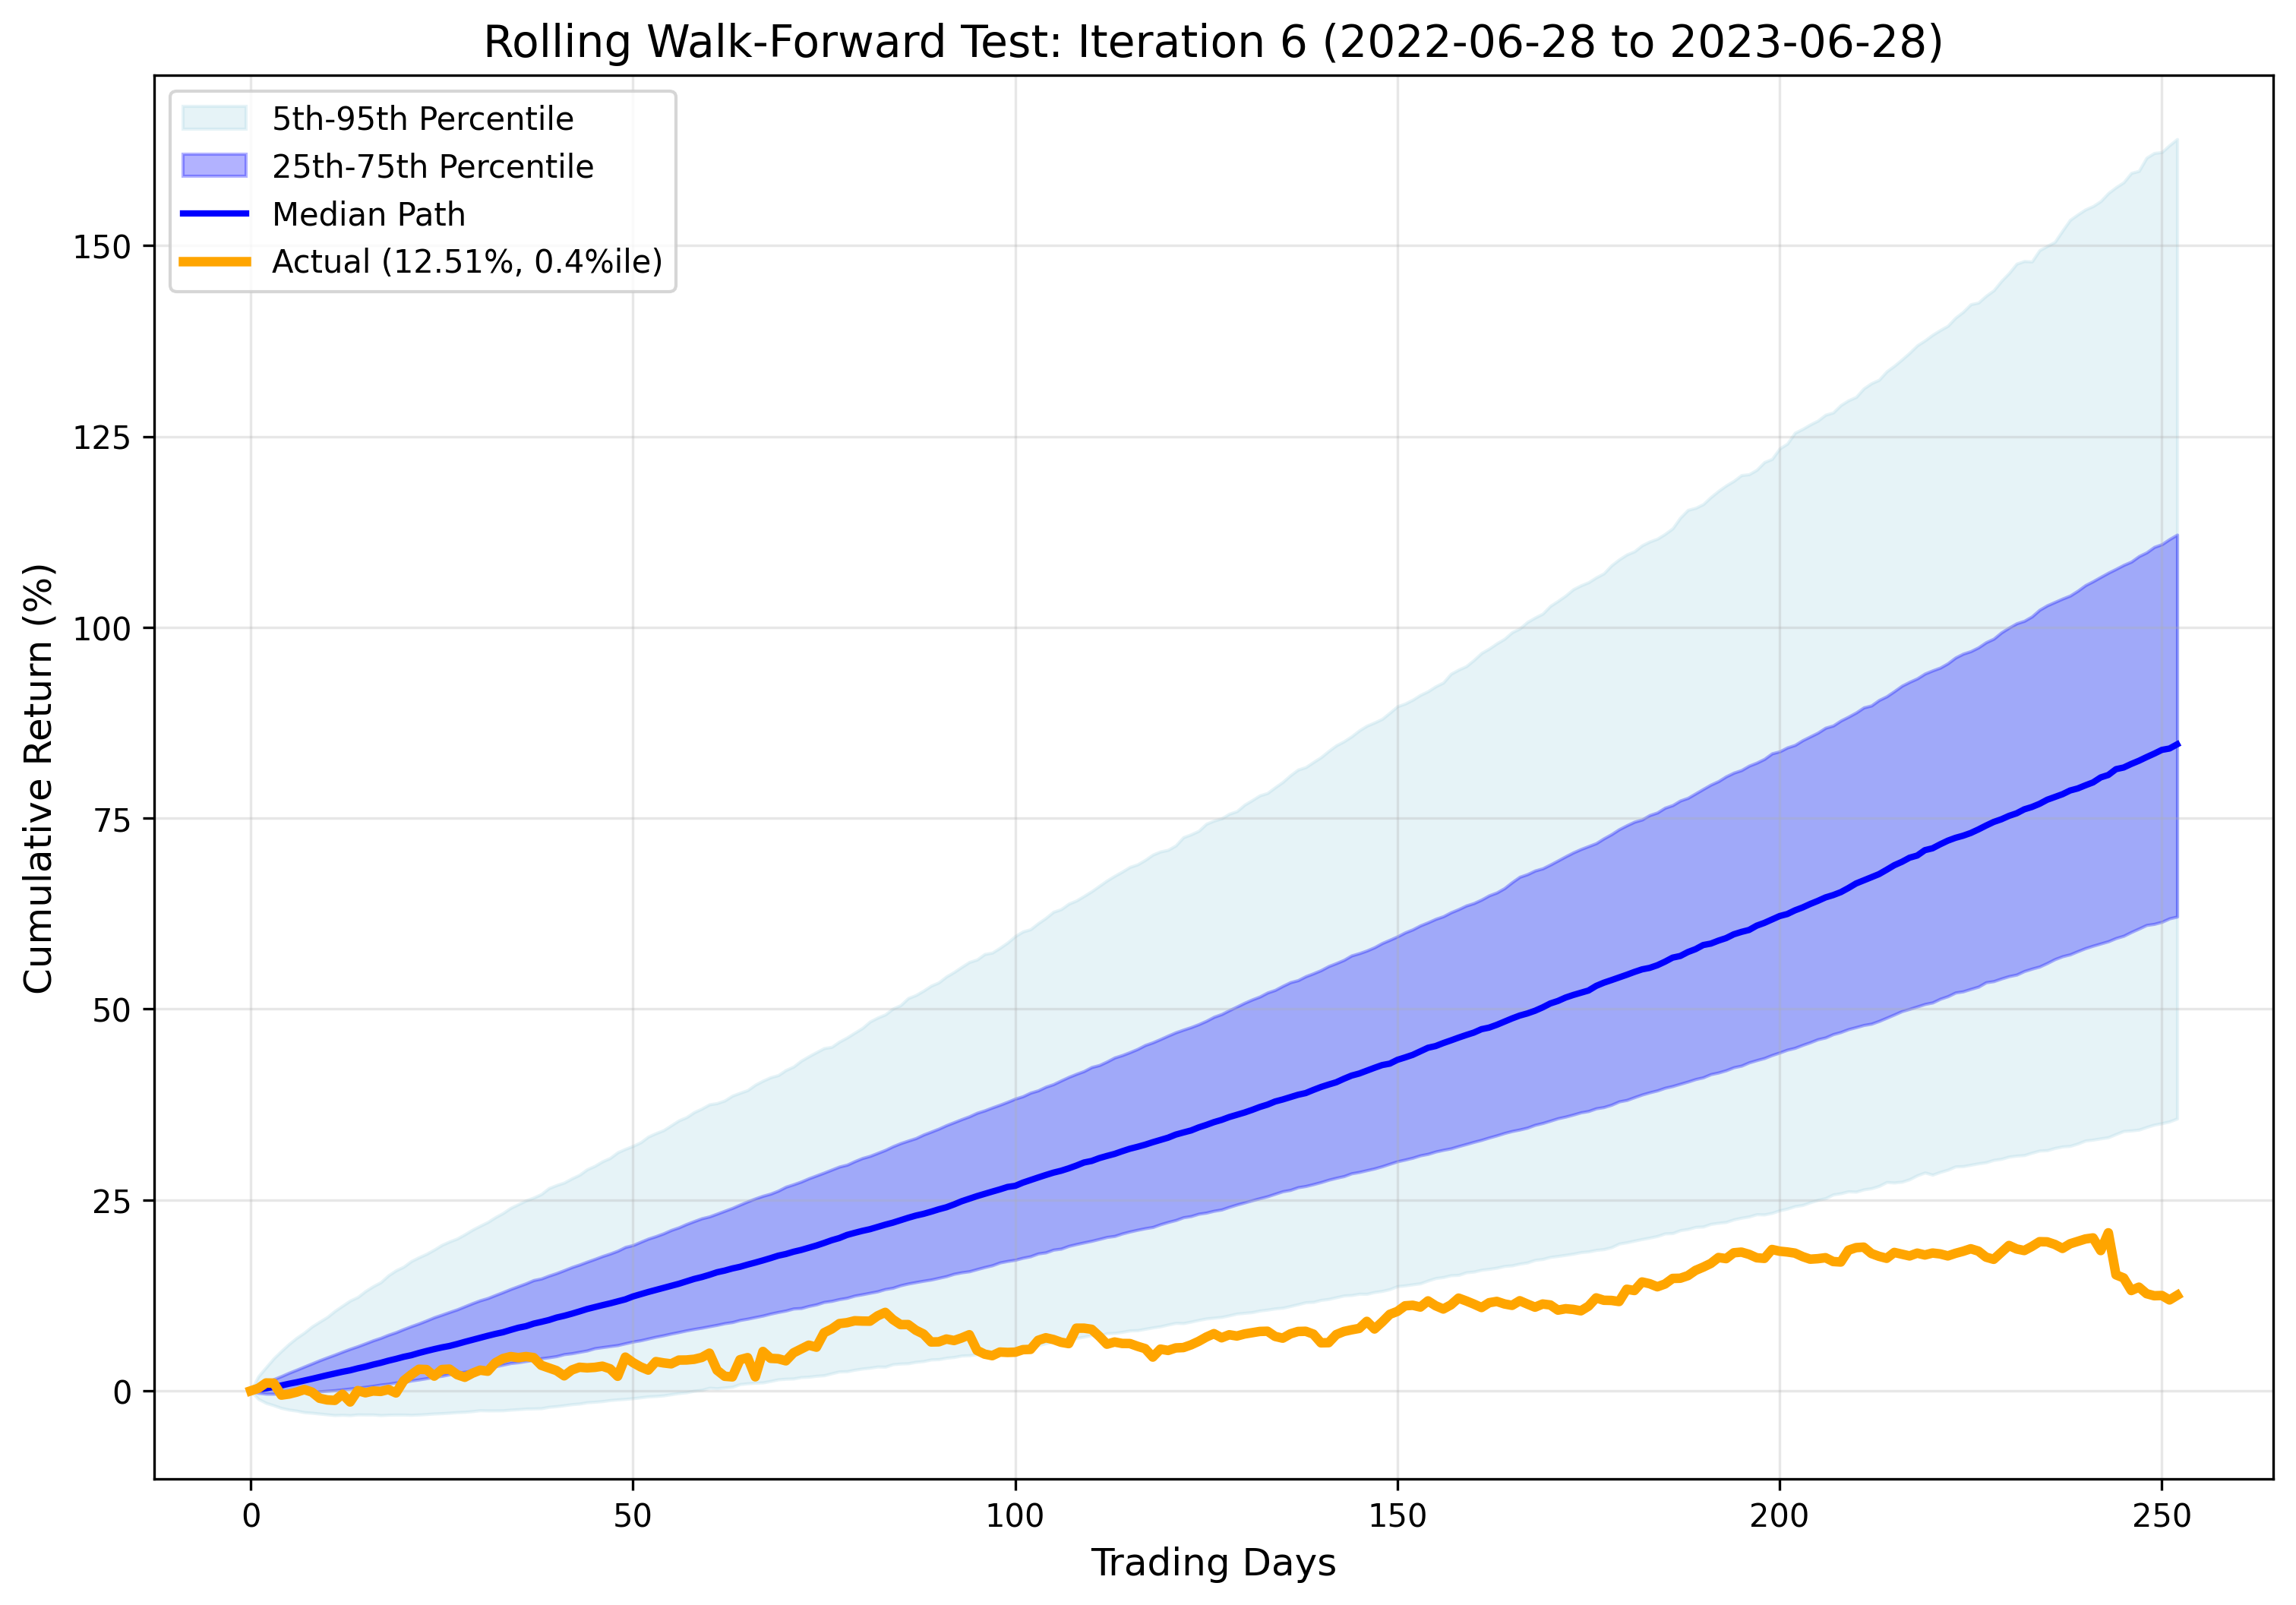
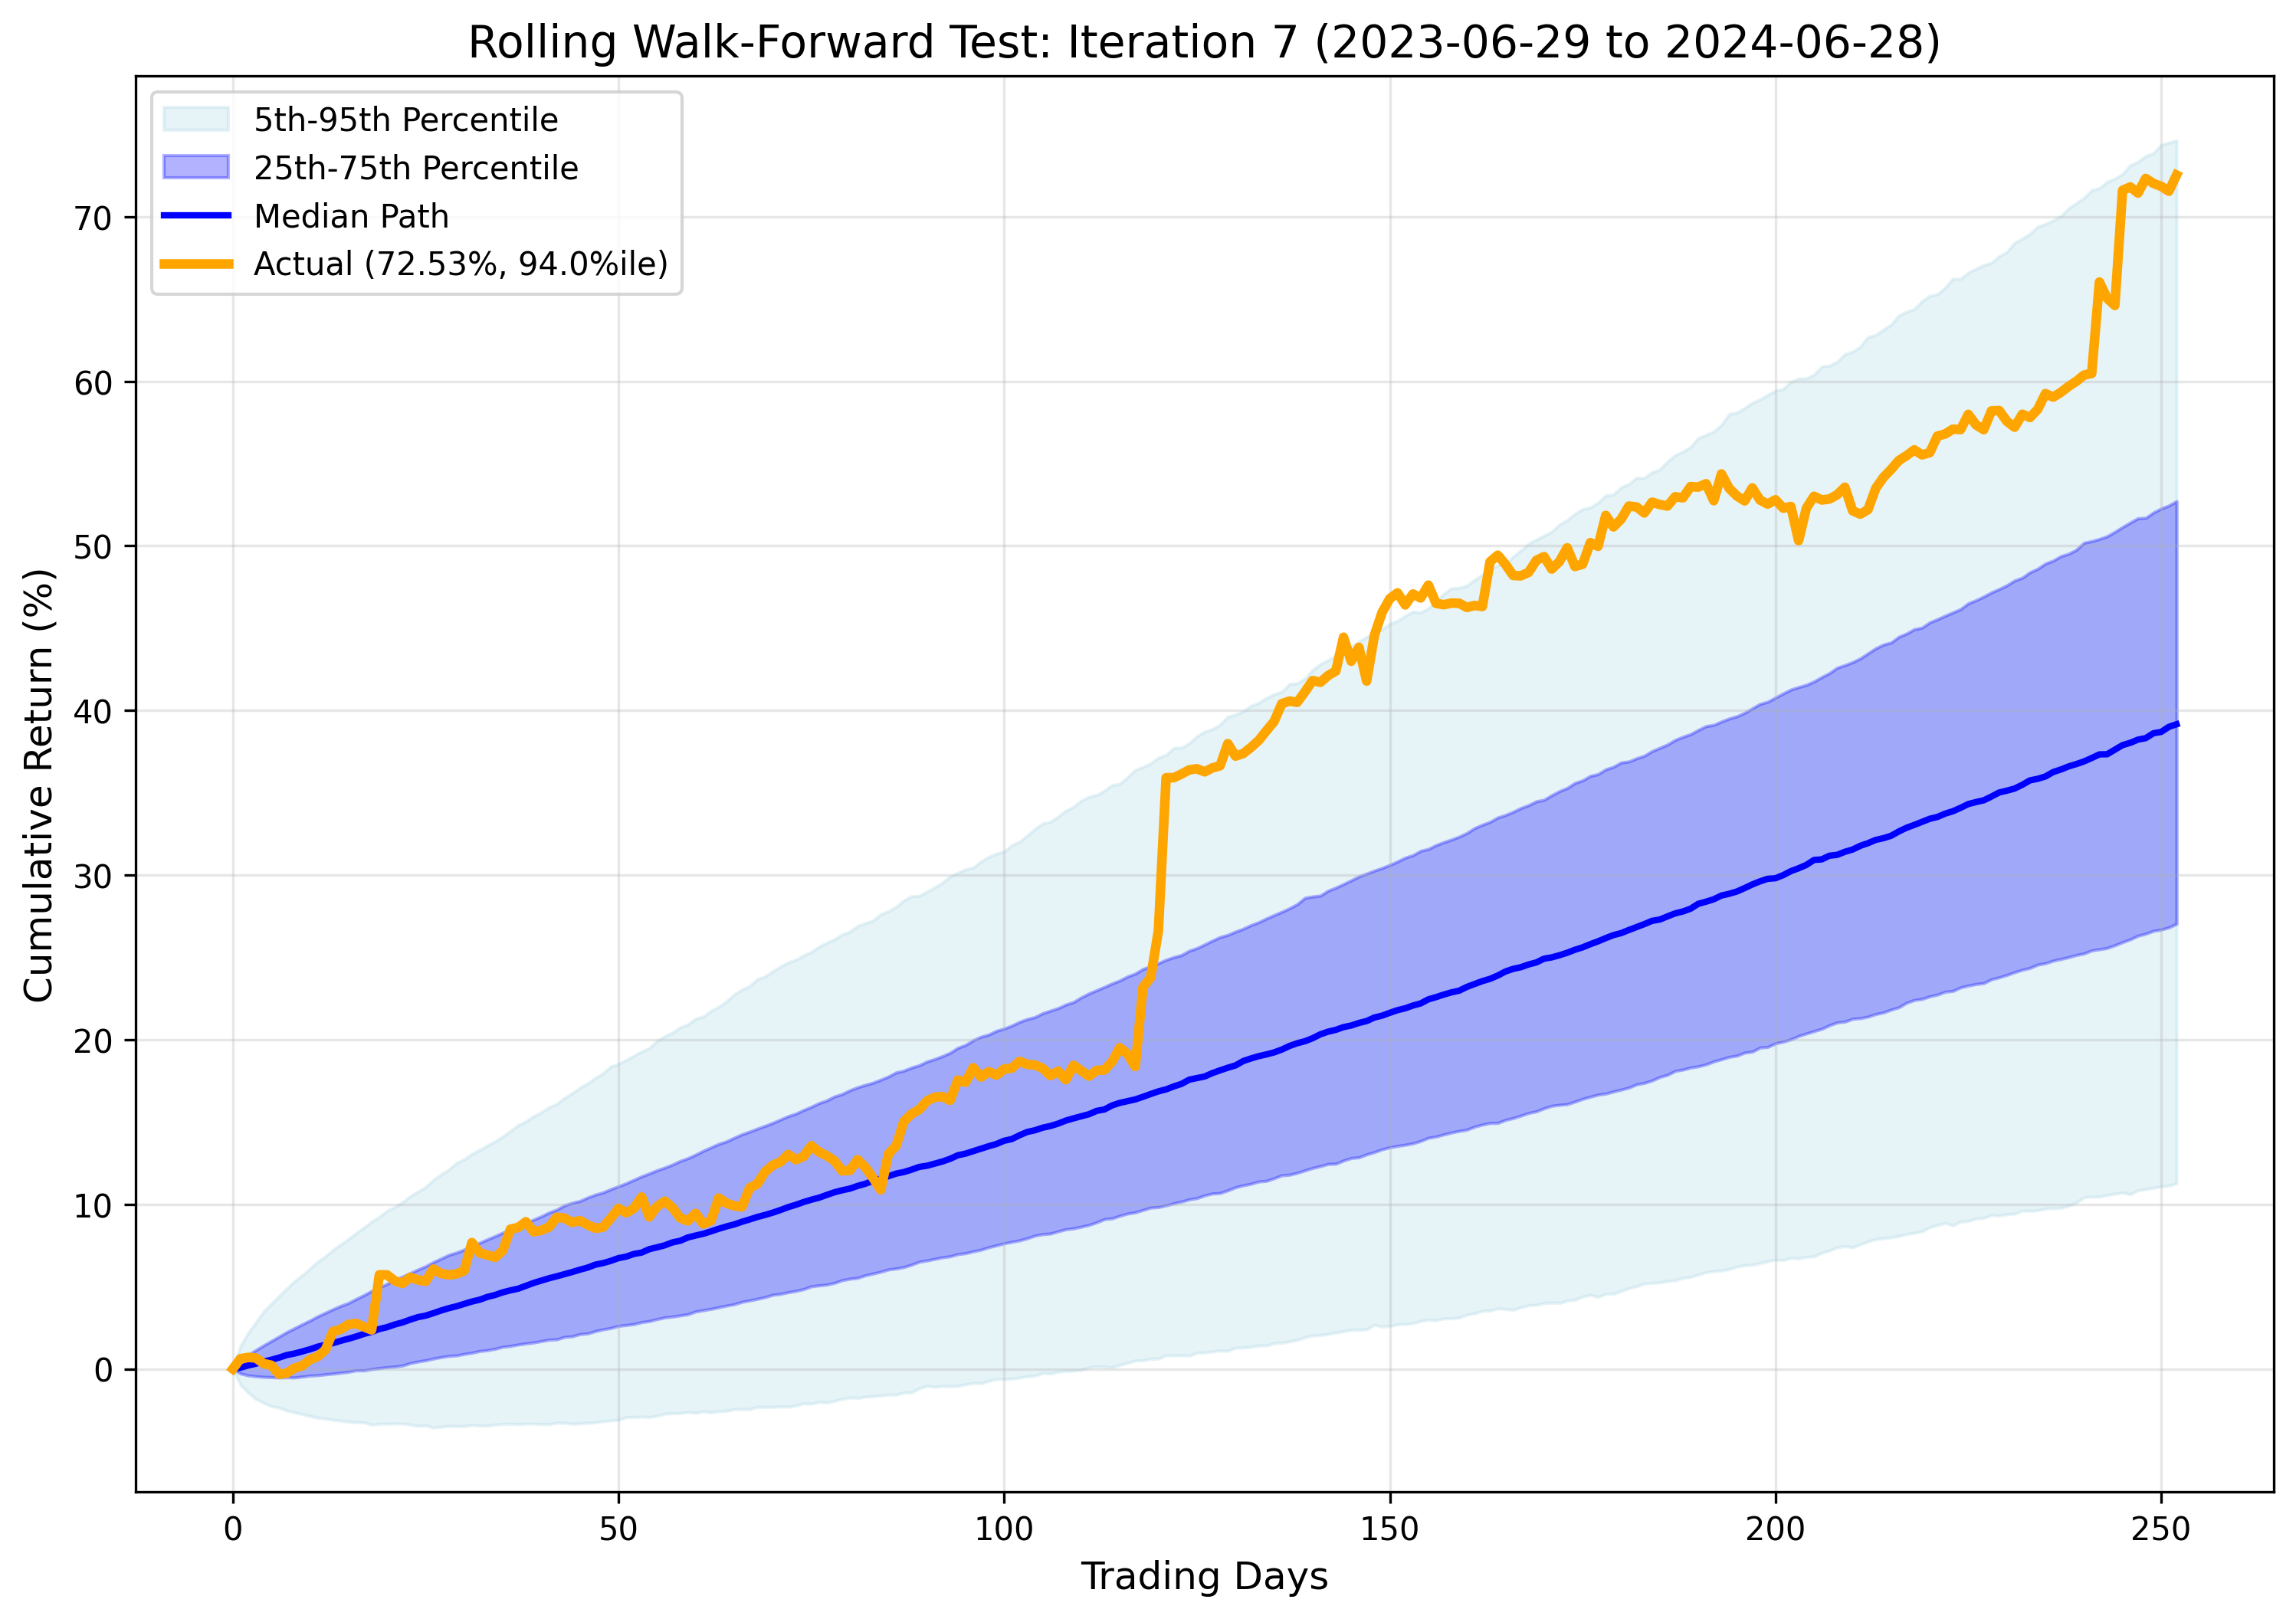
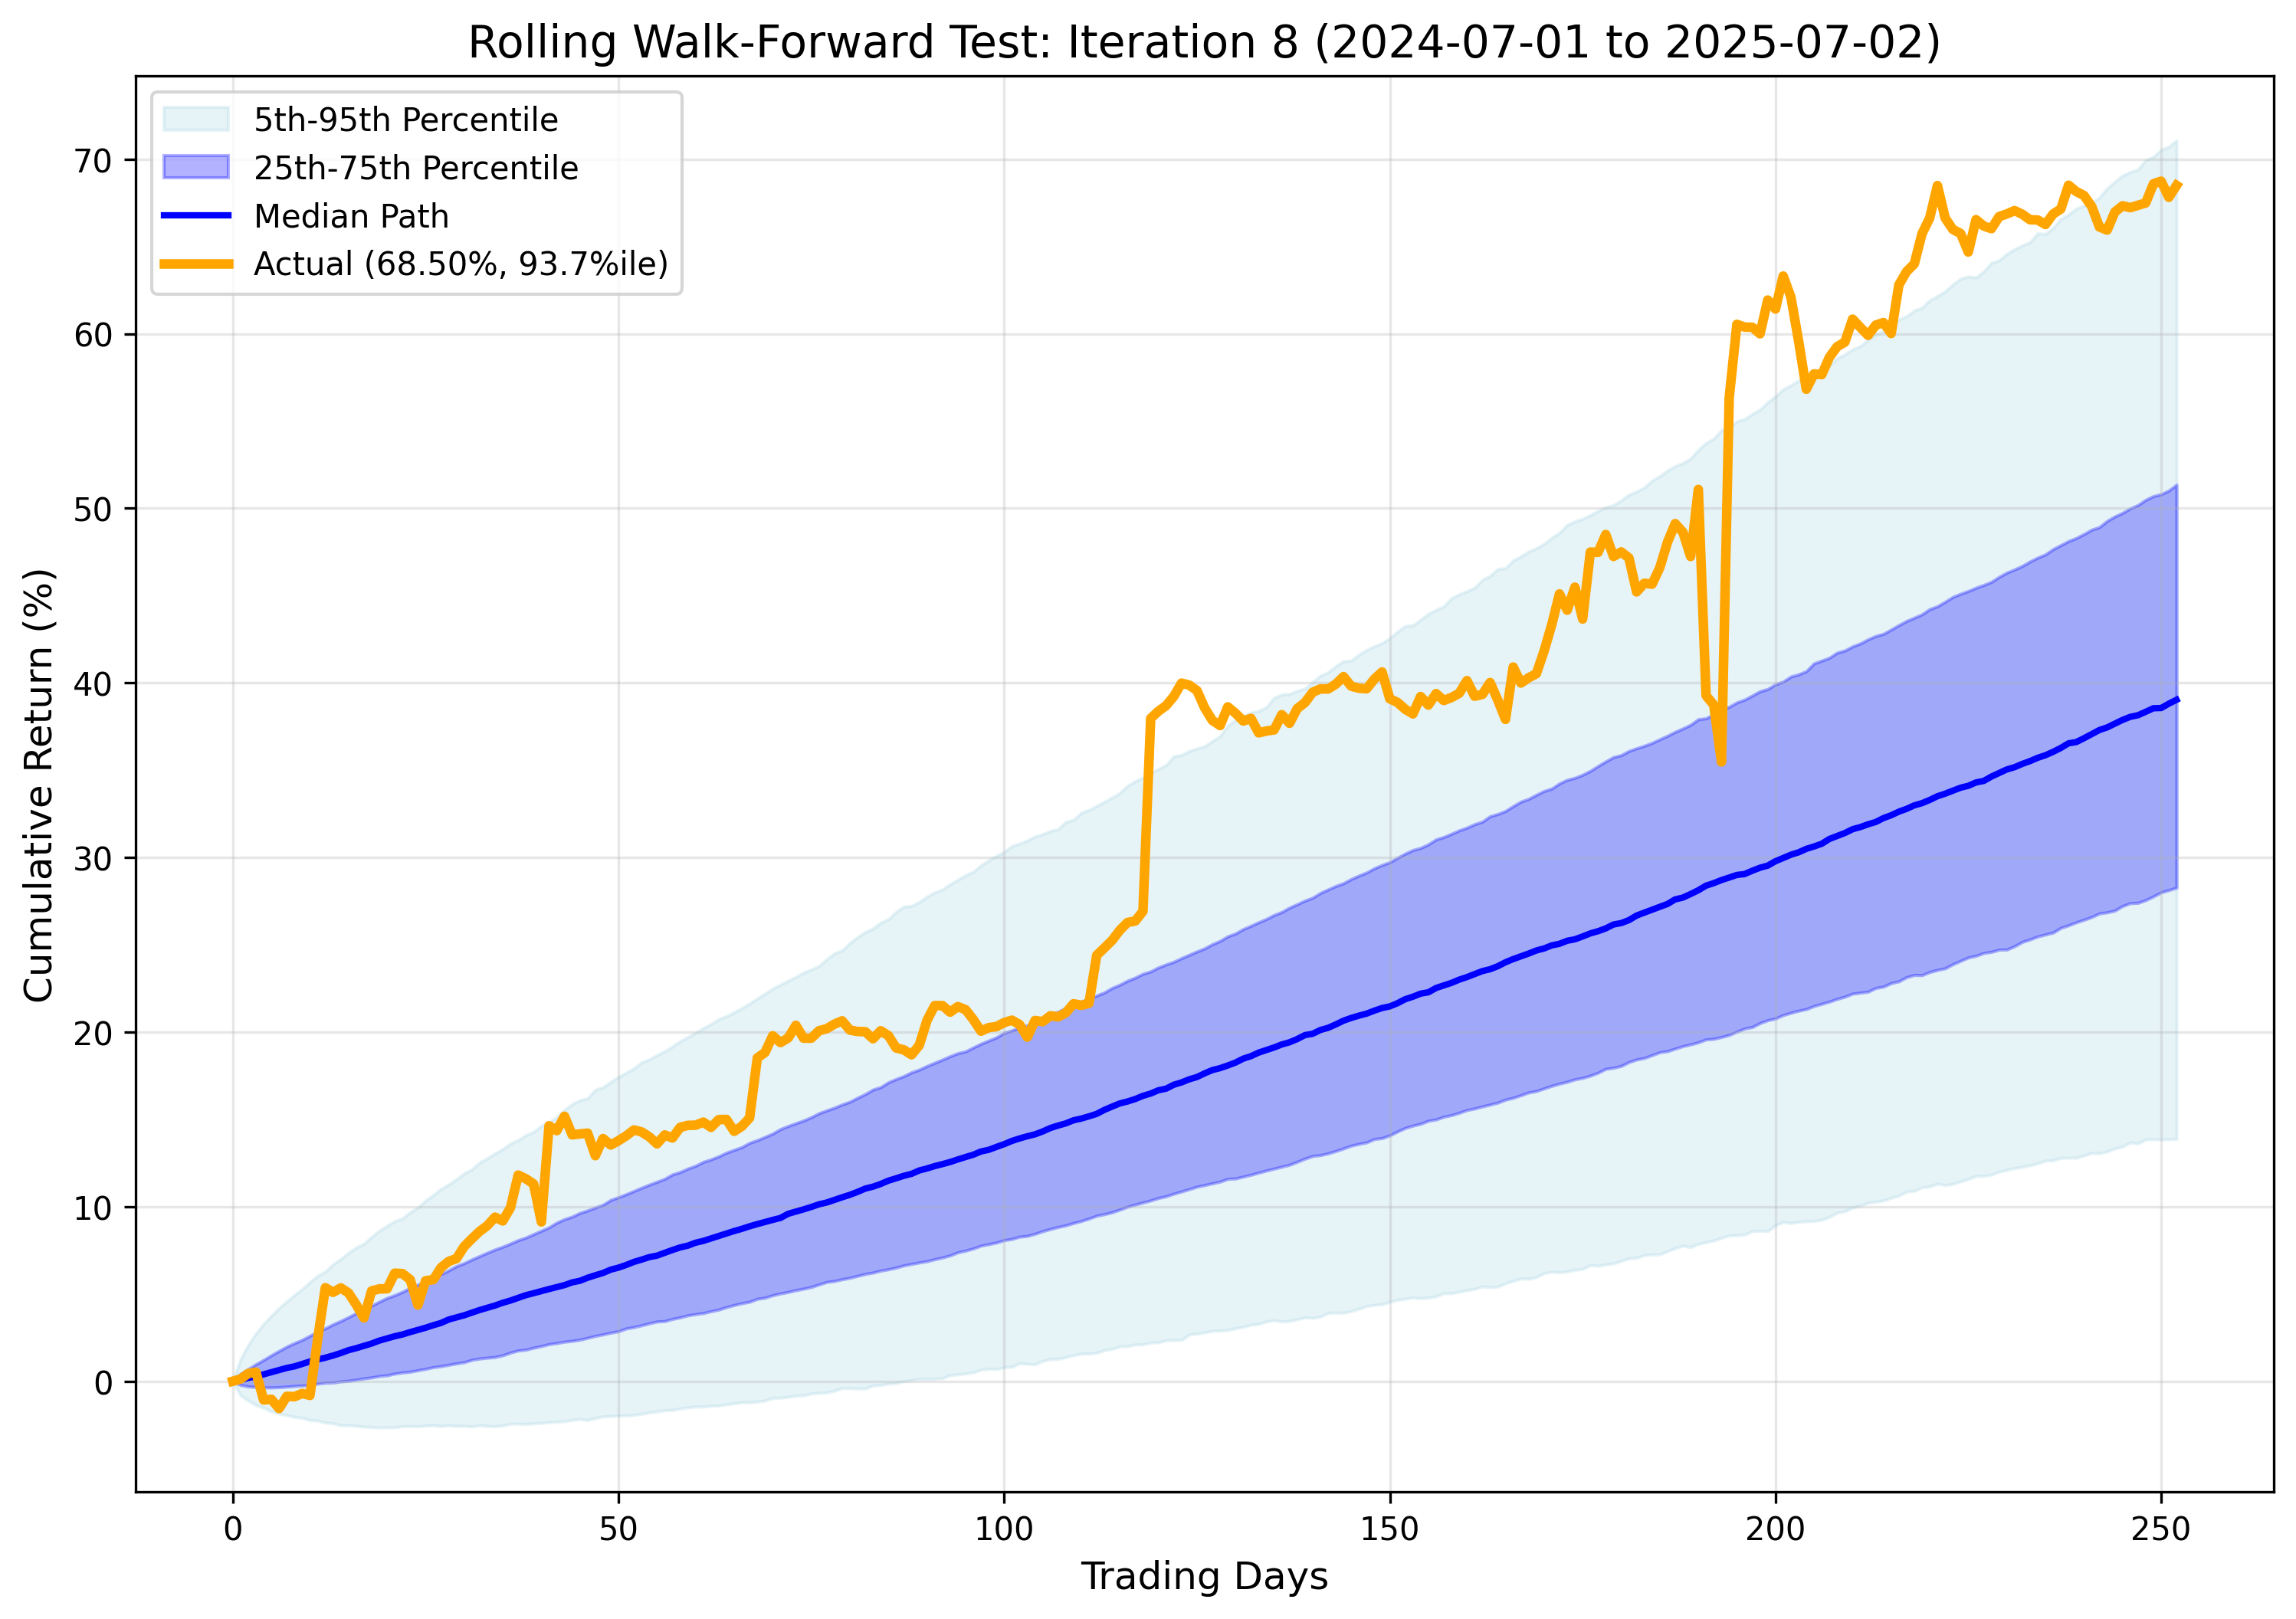
Every single “Test Period” (Out-of-sample) yielded a positive actual return. There were no blown-up years. It performed well during the low-volatility grind (Iteration 1), the Covid crash (Iteration 3), and a bear market (Iteration 6). While returns varied (low of 12.5%, high of 222%), the floor is high. A “bad year” for this strategy is simply a year of lower-than-average positive returns, not capital destruction.
NOTE: This strategy is intentionally designed to capture outlier returns during specific market conditions. Following the periods of exceptional performance, Monte Carlo forecasts may appear overly optimistic in subsequent iterations, consequently making the strategy appear to underperform during those iterations. This is expected behavior as the simulations incorporate recent extreme returns into their probability distributions.
| Rank | Trading Days | Calendar Days | Max Drawdown | Start Date | End Date |
|---|---|---|---|---|---|
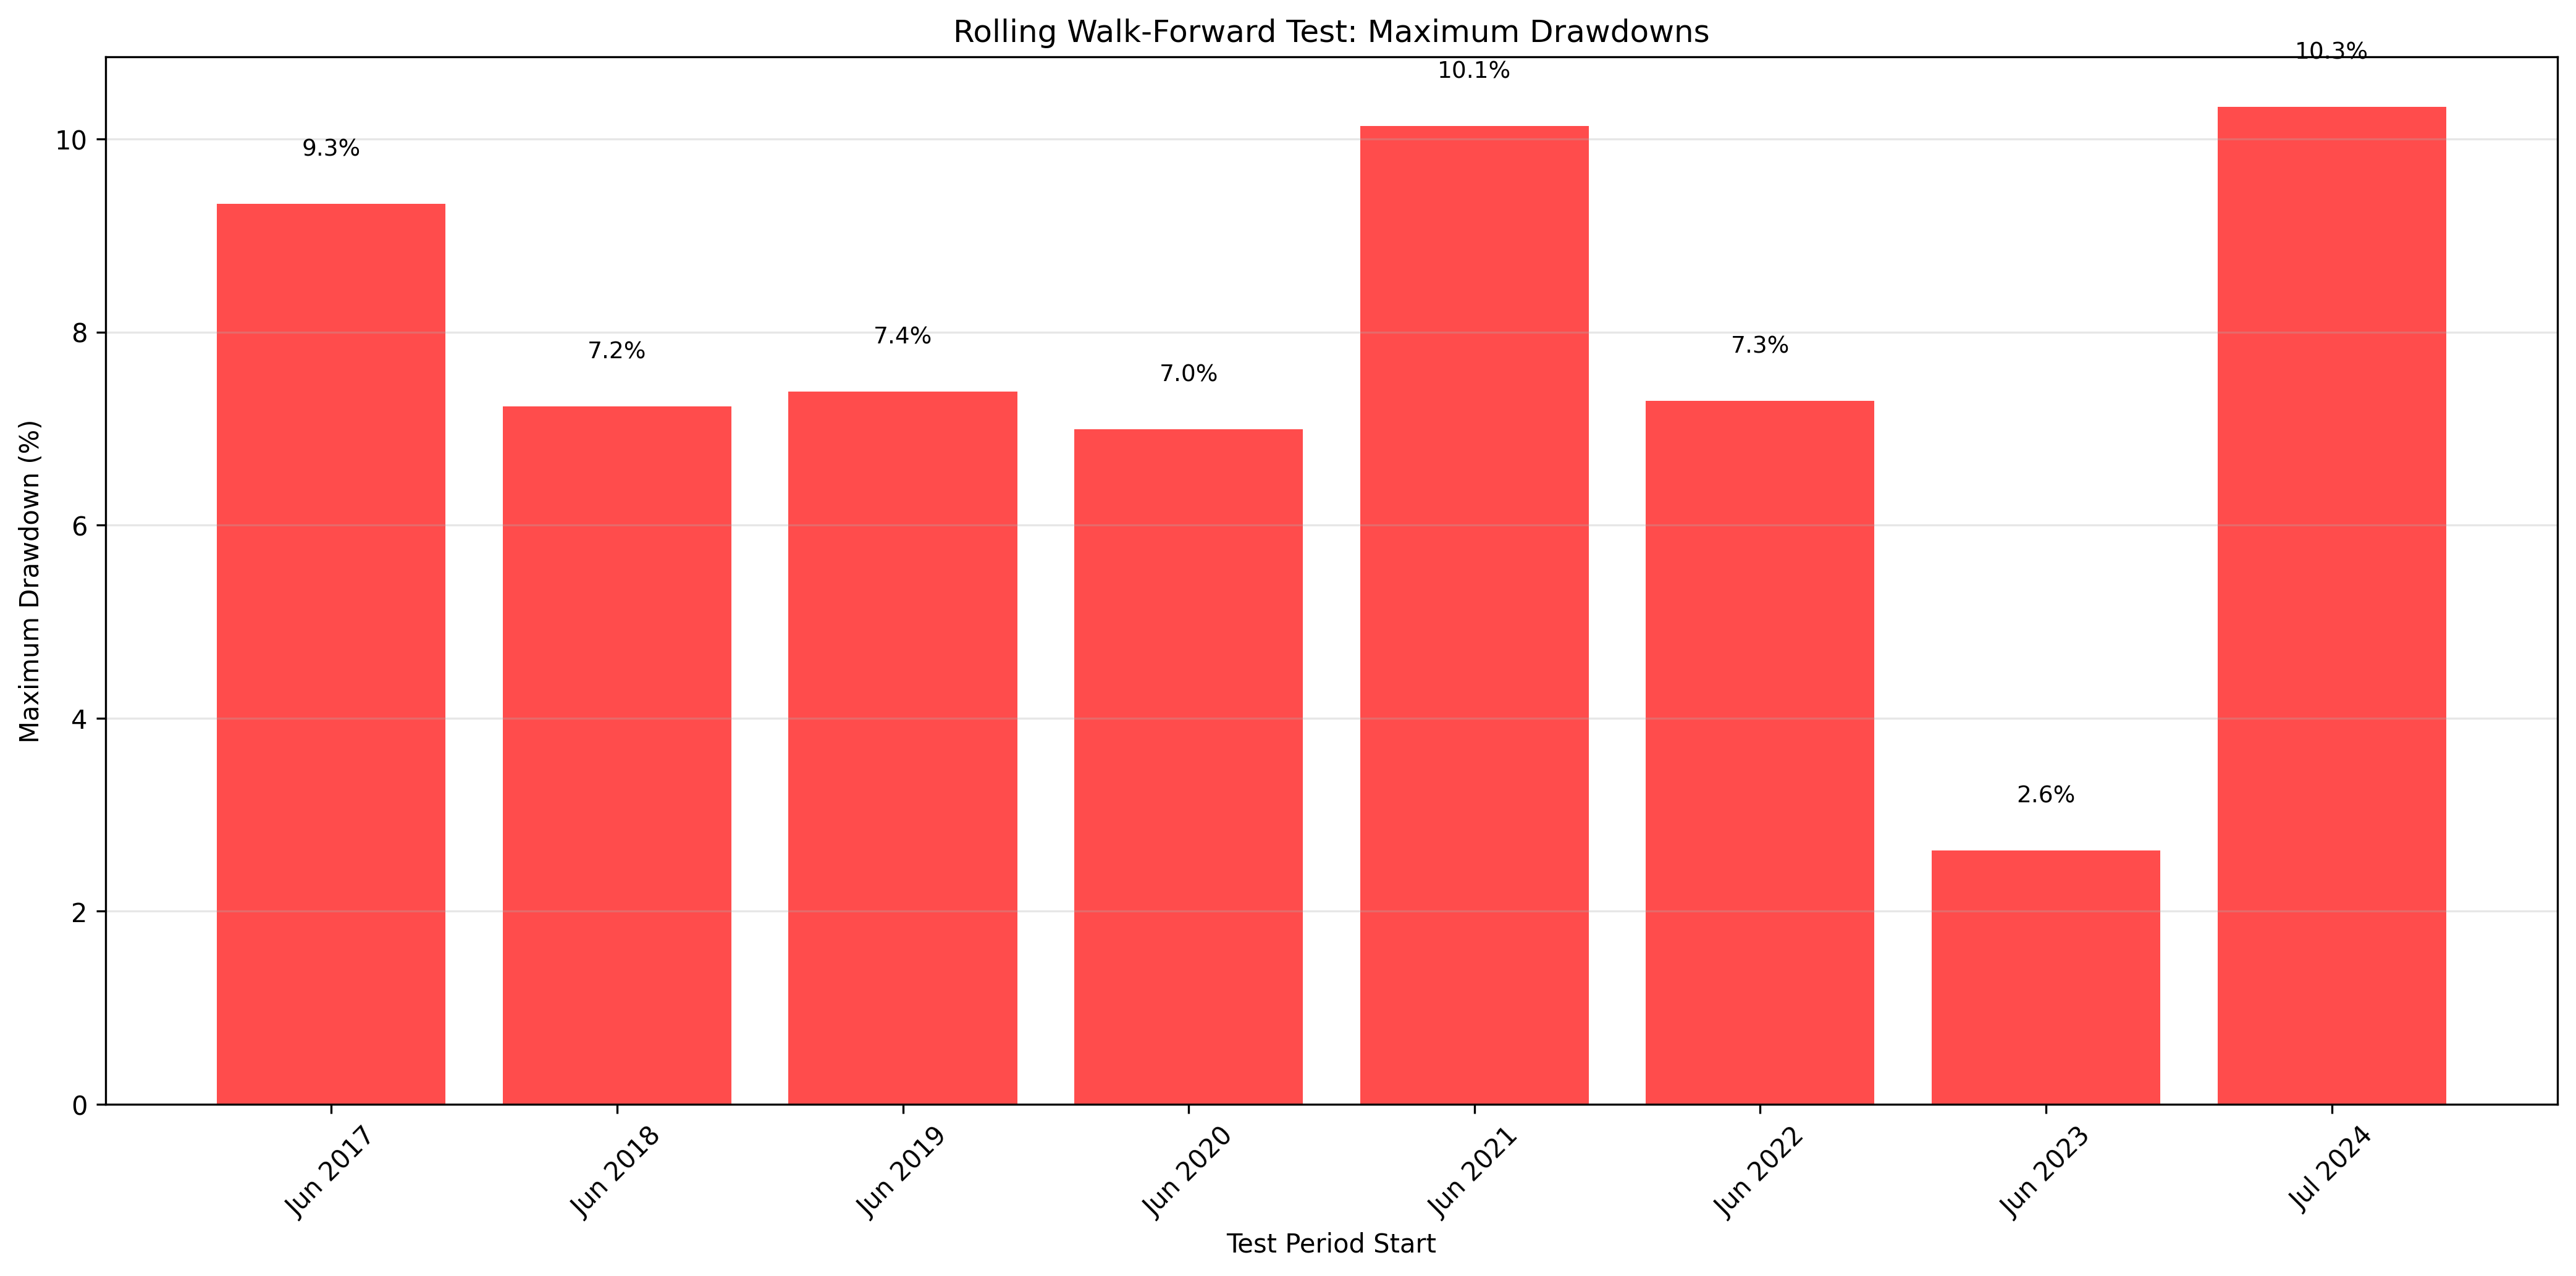
| 1 | 42 | 58 | 9.33% | 2017-09-11 | 2017-11-08 |
| 2 | 28 | 42 | 6.56% | 2017-12-01 | 2018-01-12 |
| 3 | 29 | 42 | 2.60% | 2018-04-17 | 2018-05-29 |
| 4 | 16 | 23 | 2.15% | 2017-06-26 | 2017-07-19 |
| 5 | 14 | 21 | 0.97% | 2017-08-16 | 2017-09-06 |
| Rank | Trading Days | Calendar Days | Max Drawdown | Start Date | End Date |
|---|---|---|---|---|---|
| 1 | 37 | 55 | 7.23% | 2018-10-30 | 2018-12-24 |
| 2 | 22 | 32 | 5.49% | 2018-09-13 | 2018-10-15 |
| 3 | 36 | 53 | 4.10% | 2019-04-25 | 2019-06-17 |
| Rank | Trading Days | Calendar Days | Max Drawdown | Start Date | End Date |
|---|---|---|---|---|---|
| 1 | 21 | 29 | 2.13% | 2019-09-04 | 2019-10-03 |
| Rank | Trading Days | Calendar Days | Max Drawdown | Start Date | End Date |
|---|---|---|---|---|---|
| 1 | 60 | 87 | 6.99% | 2020-10-13 | 2021-01-08 |
| 2 | 25 | 36 | 4.26% | 2020-09-03 | 2020-10-09 |
| 3 | 20 | 29 | 3.95% | 2021-01-26 | 2021-02-24 |
| 4 | 19 | 25 | 3.46% | 2021-03-01 | 2021-03-26 |
| Rank | Trading Days | Calendar Days | Max Drawdown | Start Date | End Date |
|---|---|---|---|---|---|
| 1 | 47 | 69 | 10.13% | 2021-12-29 | 2022-03-08 |
| 2 | 14 | 21 | 3.54% | 2022-05-24 | 2022-06-14 |
| 3 | 20 | 31 | 2.73% | 2021-09-03 | 2021-10-04 |
| Rank | Trading Days | Calendar Days | Max Drawdown | Start Date | End Date |
|---|---|---|---|---|---|
| 1 | 66 | 98 | 5.31% | 2022-10-25 | 2023-01-31 |
| 2 | 23 | 34 | 2.47% | 2022-08-18 | 2022-09-21 |
| 3 | 17 | 26 | 2.47% | 2022-06-30 | 2022-07-26 |
| 4 | 17 | 24 | 1.49% | 2023-02-13 | 2023-03-09 |
| 5 | 18 | 24 | 1.34% | 2023-05-01 | 2023-05-25 |
| Rank | Trading Days | Calendar Days | Max Drawdown | Start Date | End Date |
|---|---|---|---|---|---|
| 1 | 21 | 31 | 2.63% | 2024-04-05 | 2024-05-06 |
| Rank | Trading Days | Calendar Days | Max Drawdown | Start Date | End Date |
|---|---|---|---|---|---|
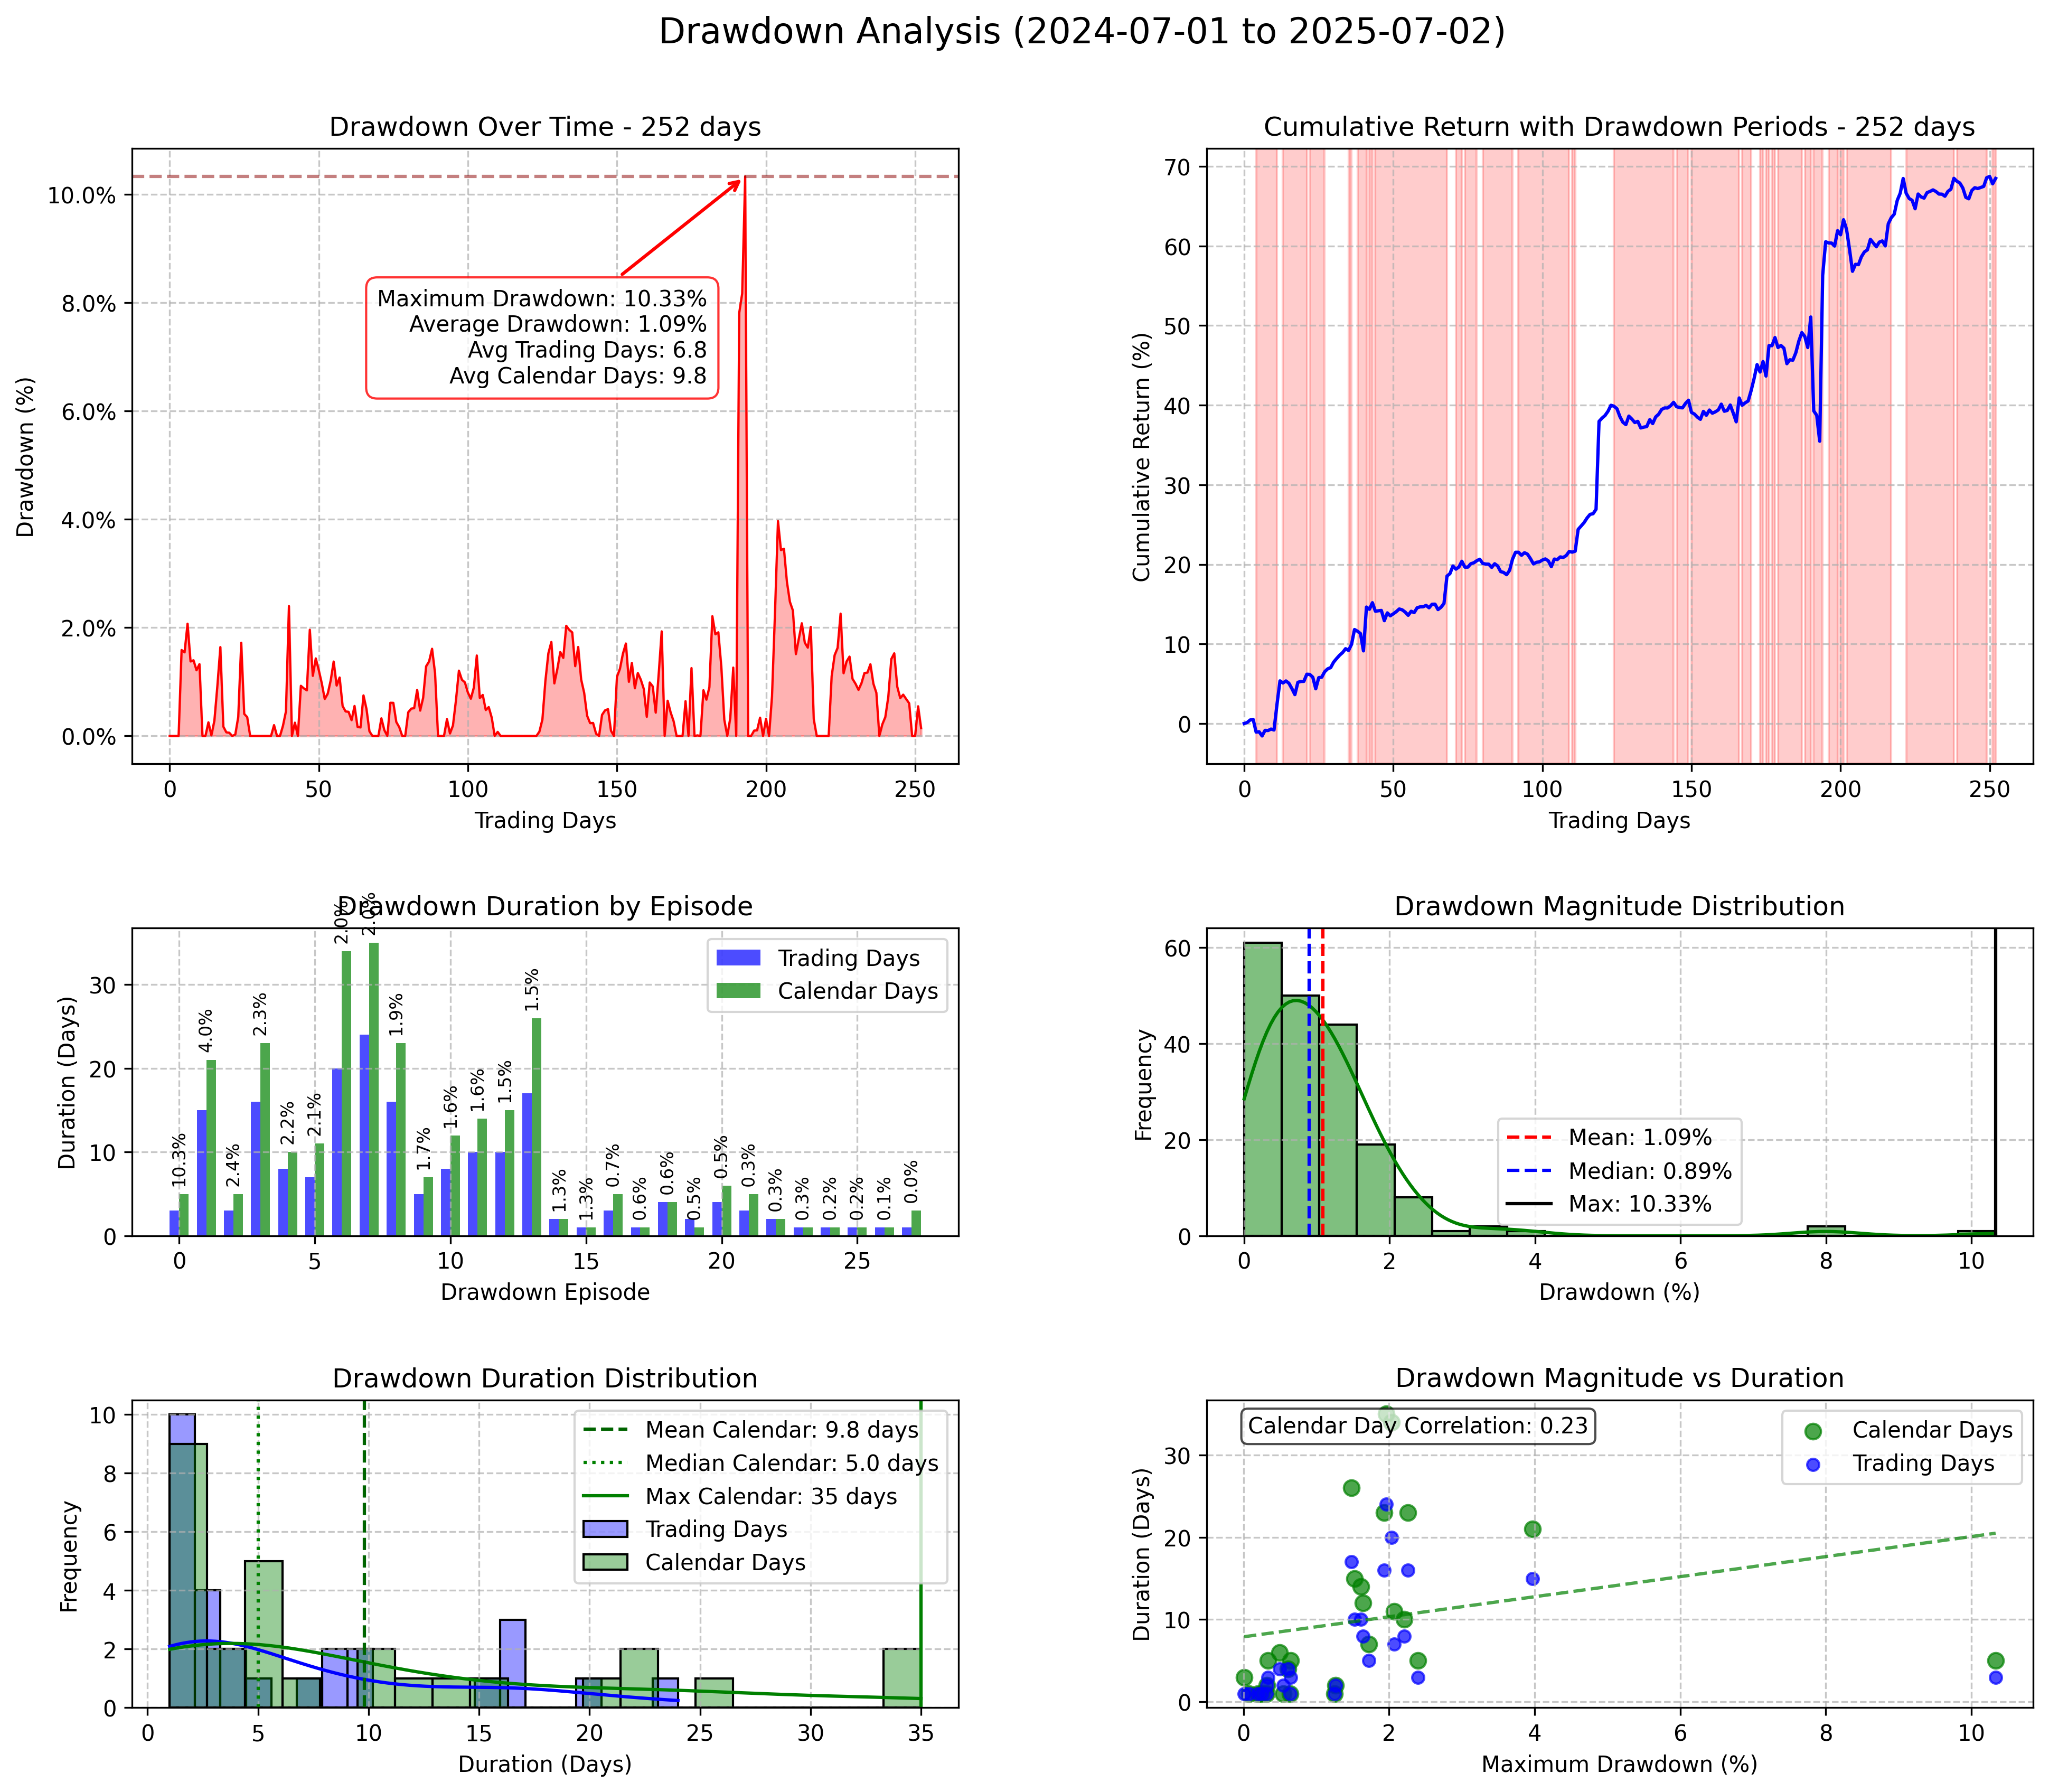
| 1 | 15 | 21 | 3.97% | 2025-04-21 | 2025-05-12 |
| 2 | 16 | 23 | 2.26% | 2025-05-19 | 2025-06-11 |
| 3 | 20 | 34 | 2.03% | 2024-12-24 | 2025-01-27 |
| 4 | 24 | 35 | 1.96% | 2024-08-30 | 2024-10-04 |
| 5 | 16 | 23 | 1.93% | 2025-02-04 | 2025-02-27 |
| Metric | Value |
|---|---|
| Average Actual Return | 80.23% |
| Average Forecast Return | 67.58% |
| Average Error | 12.64% |
| Average Percentile | 57.6% |
| Average Max Drawdown | 7.66% |
| Average Actual CAGR | 80.23% |
| Average Forecast CAGR | 67.58% |
Please wait while we get Zehnvisor on the line for you...