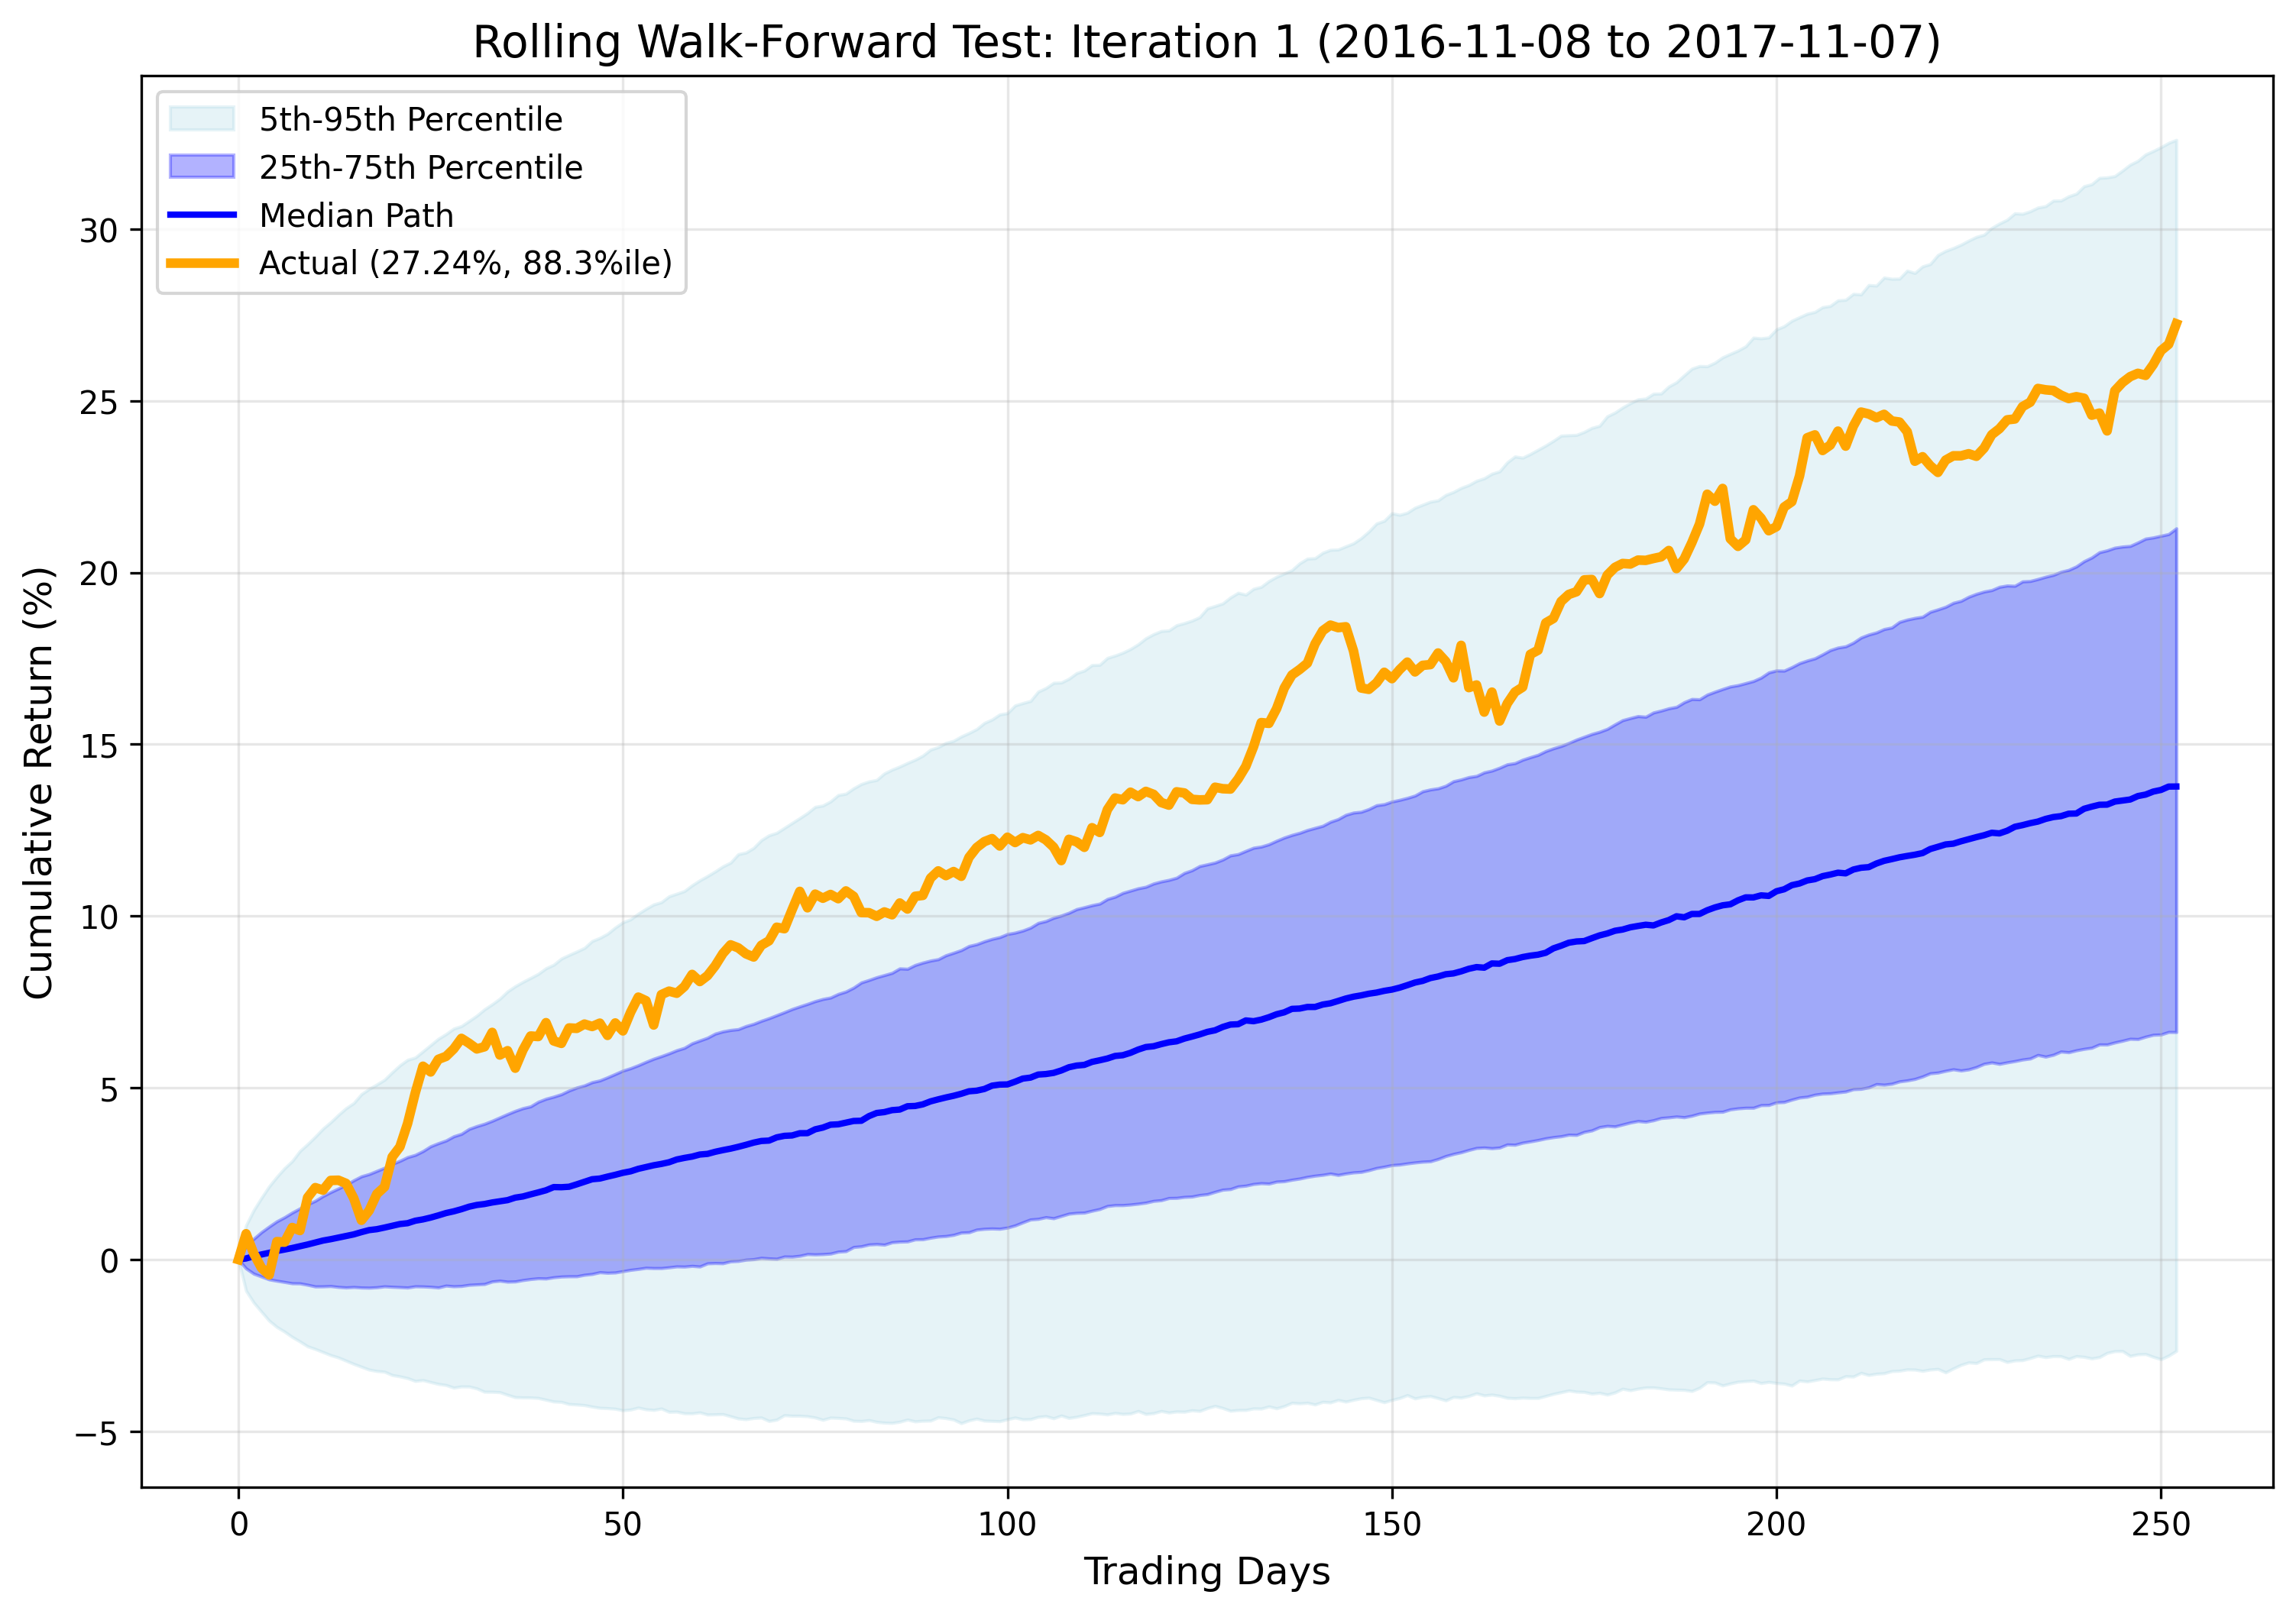
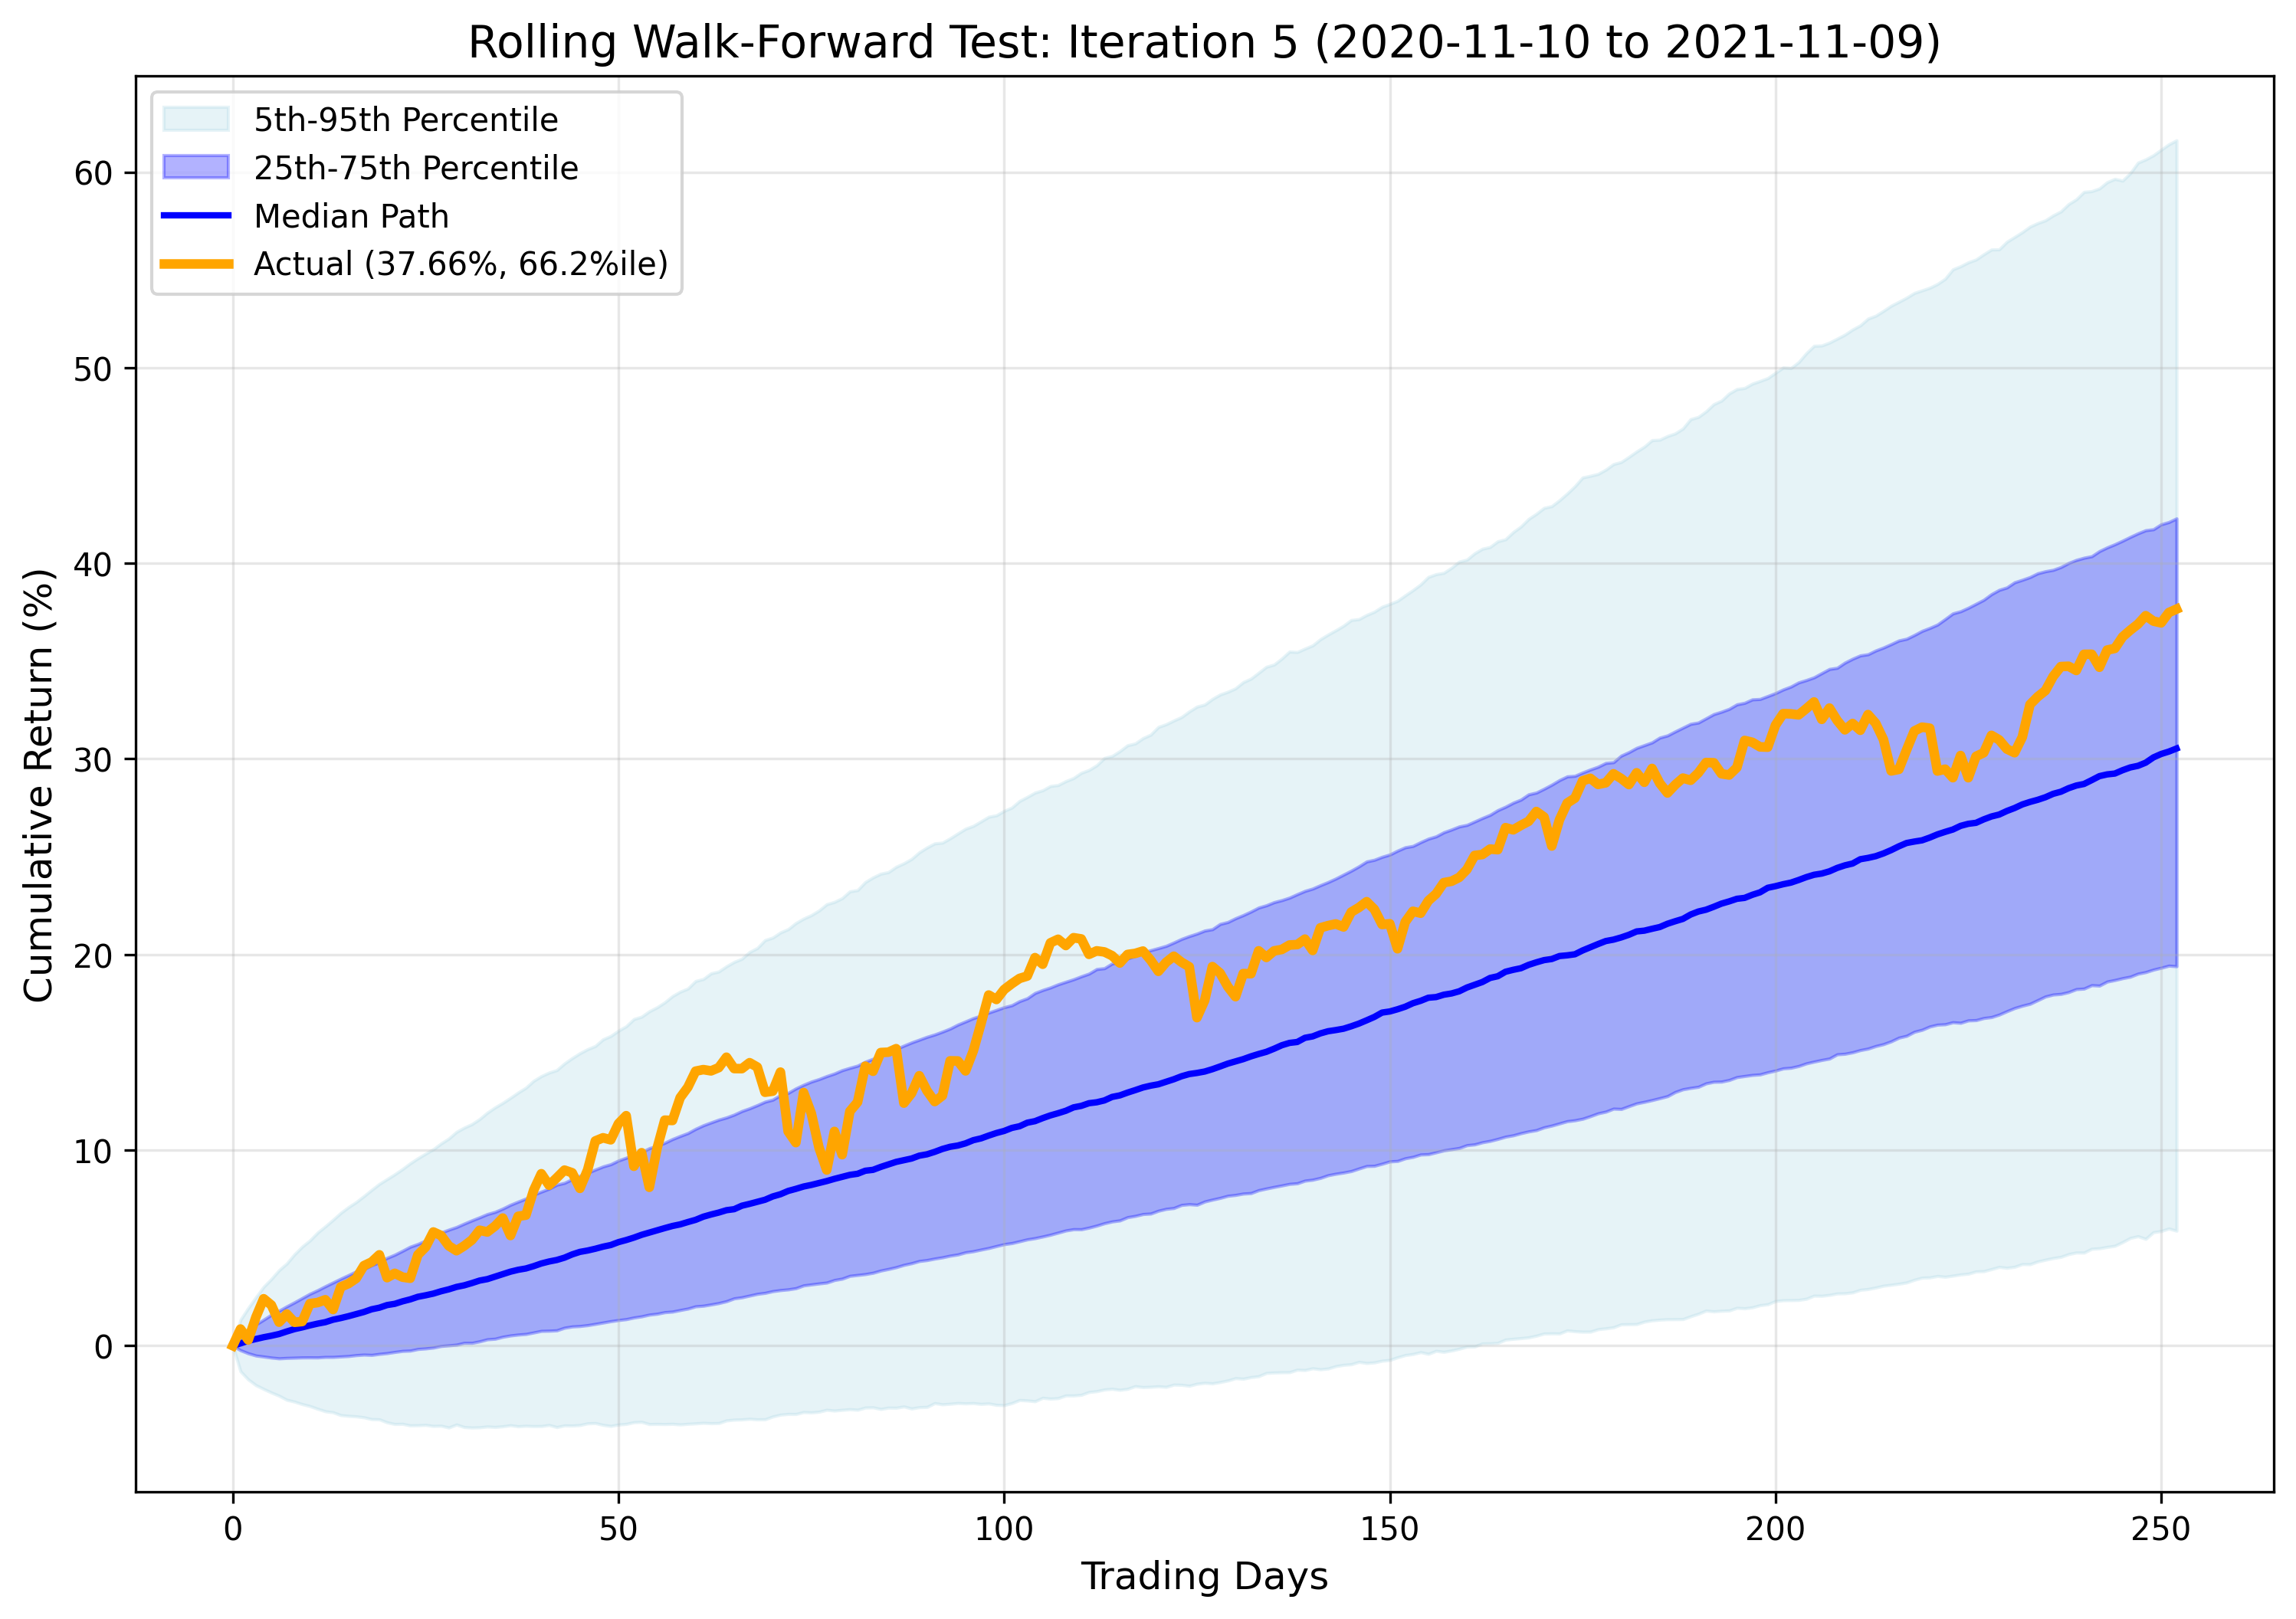
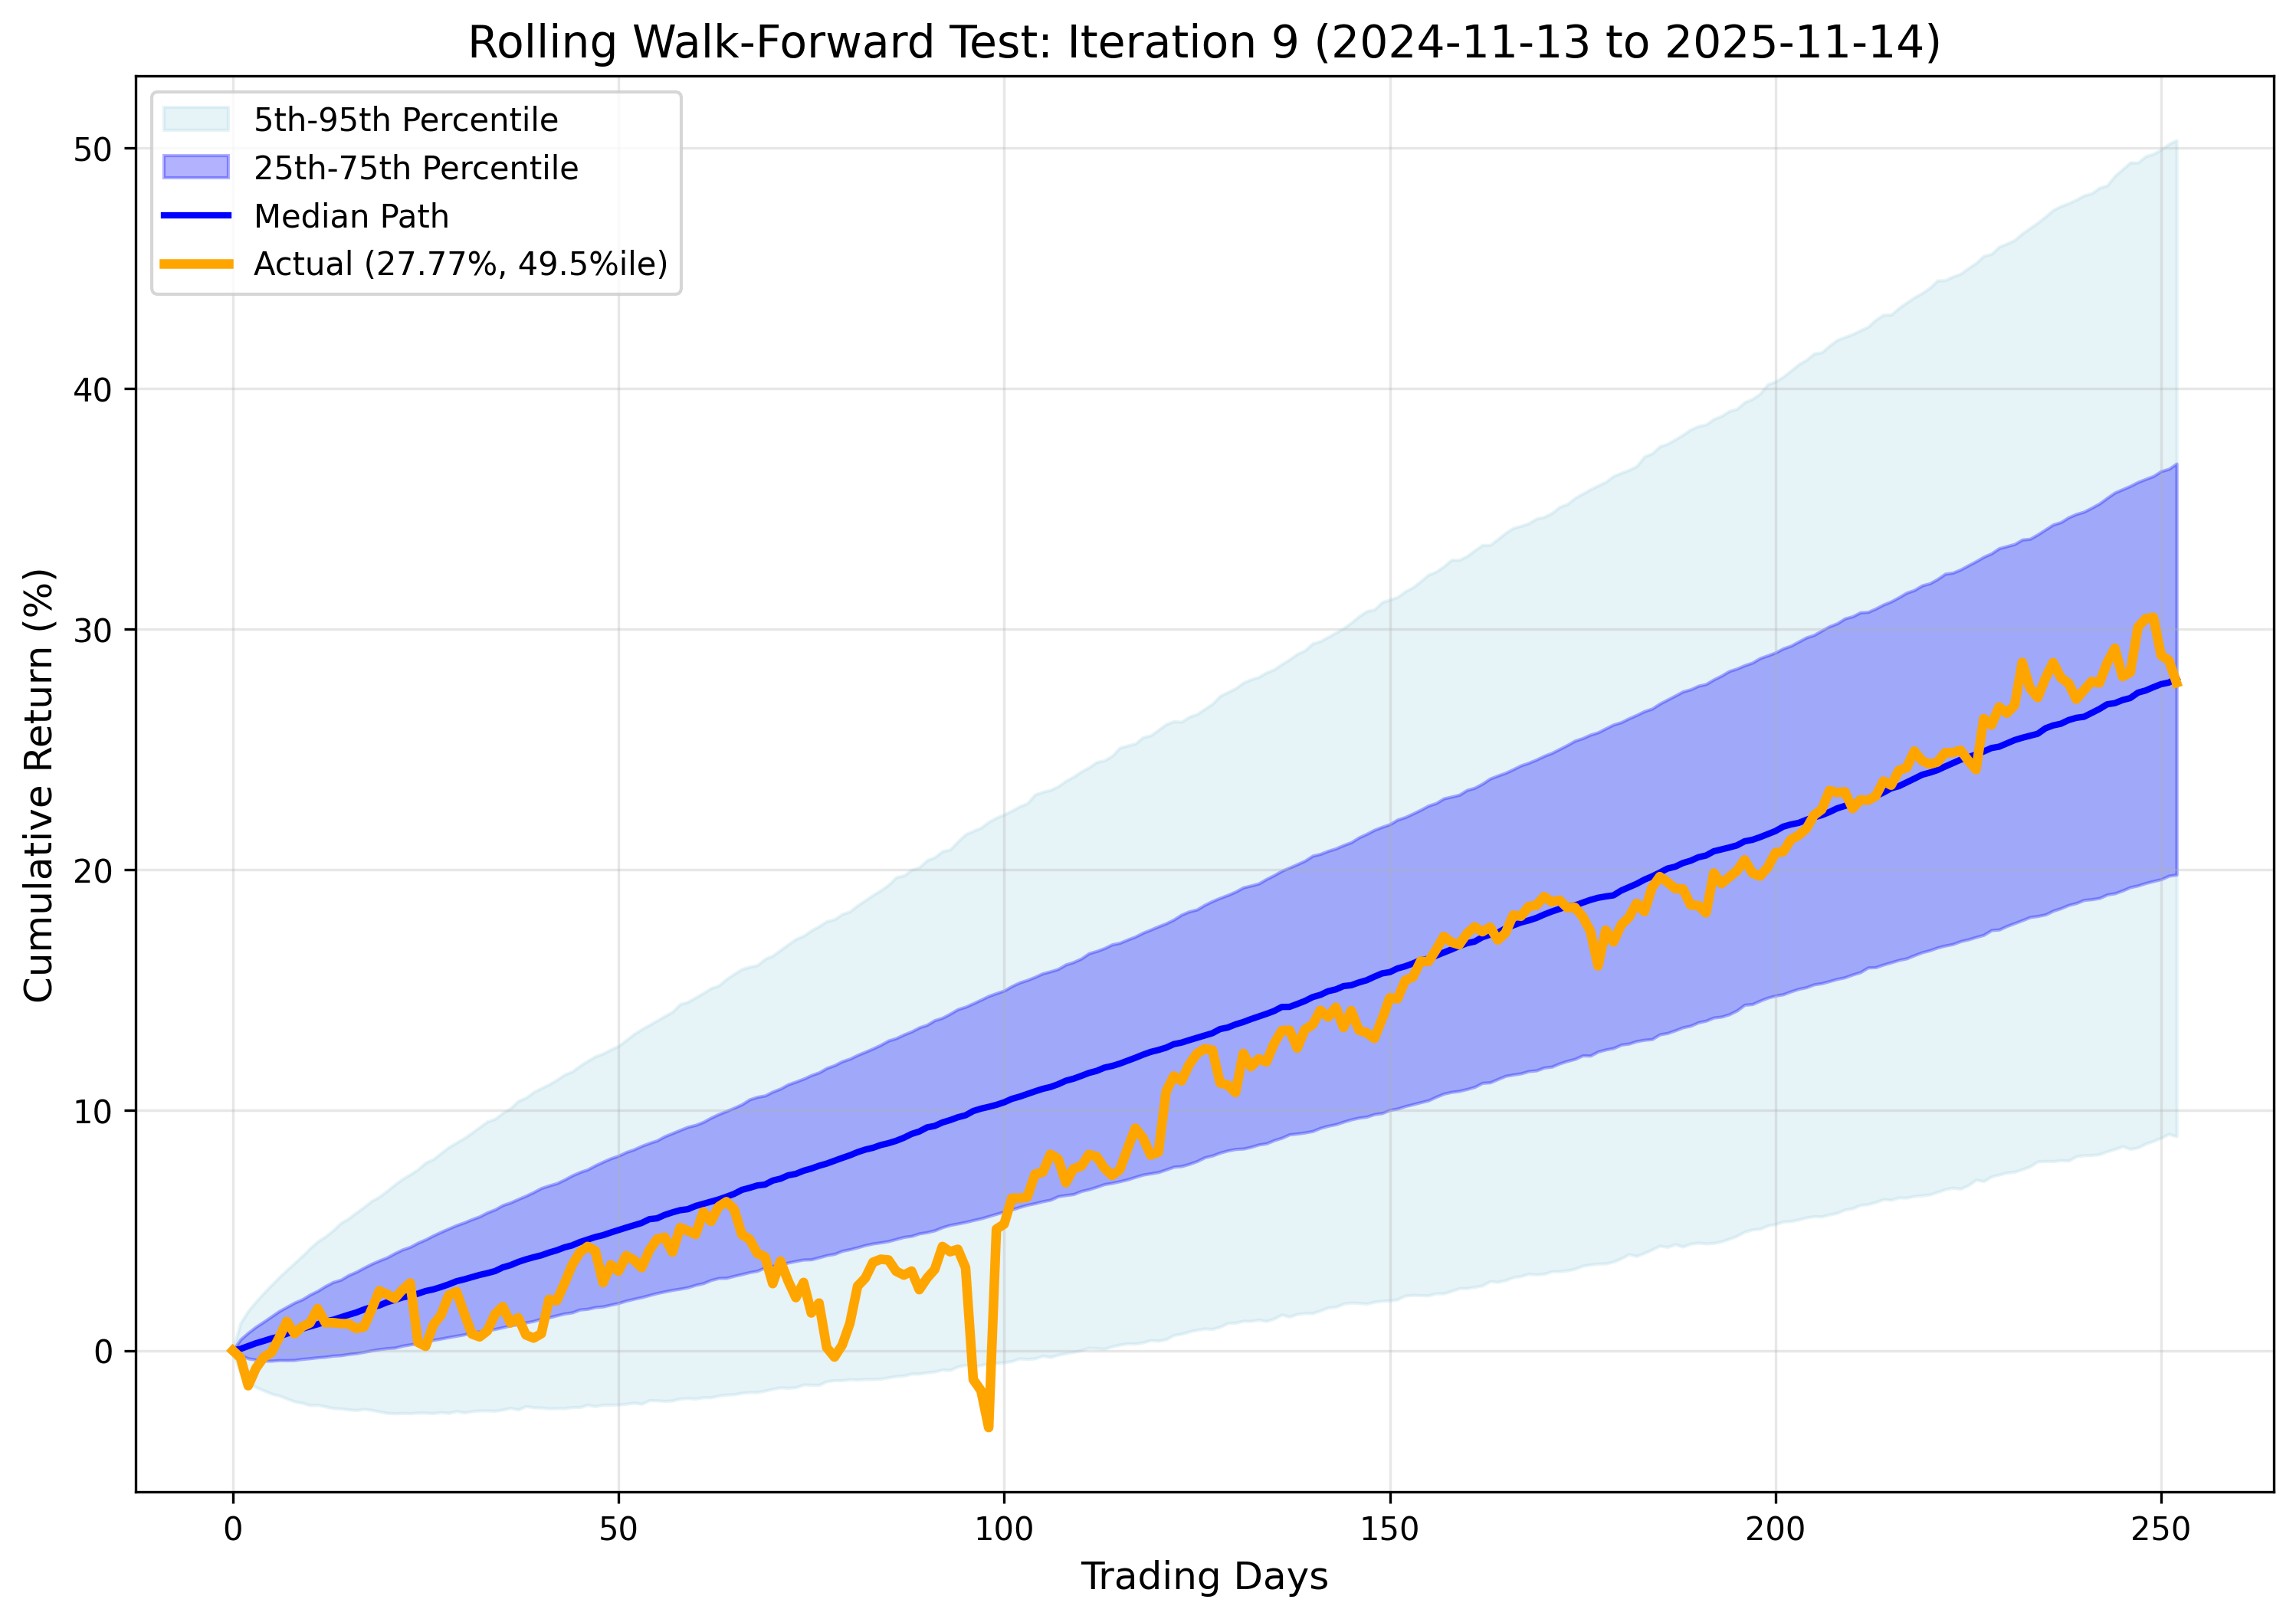
Monte Carlo robustness analysis to evaluate strategy's performance predictability using 10,000 simulations per test period within a rolling walk-forward framework
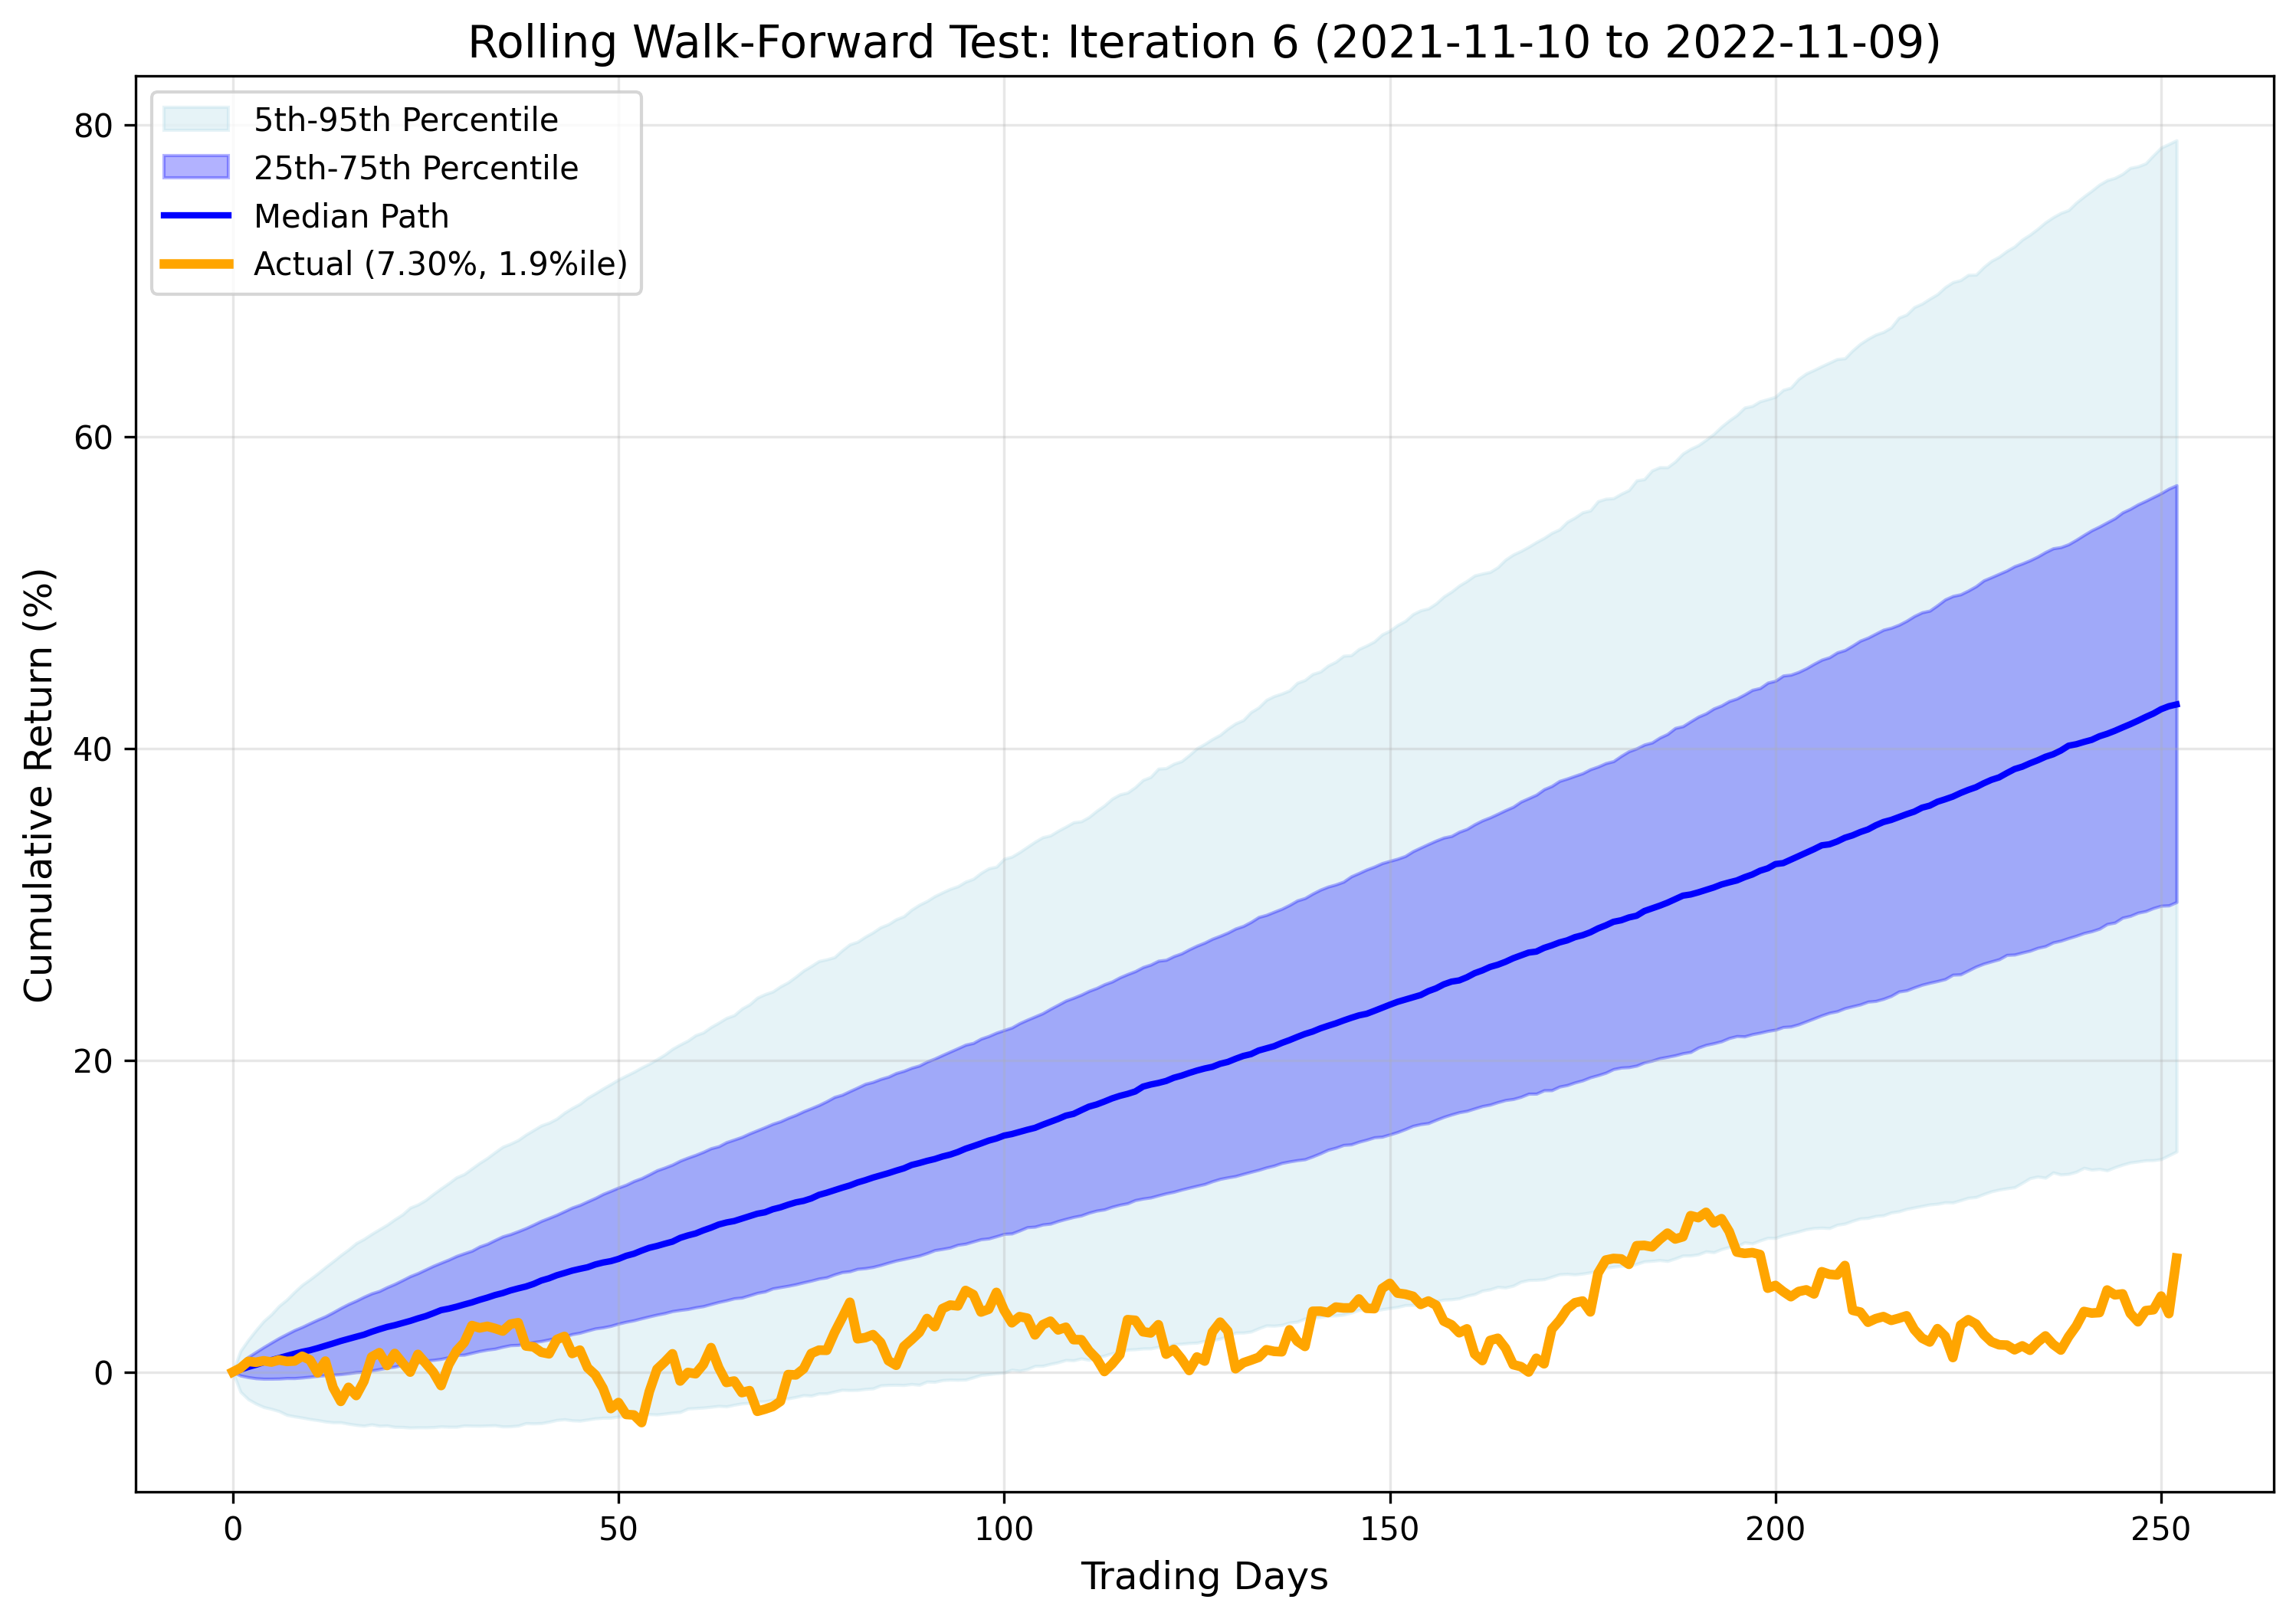
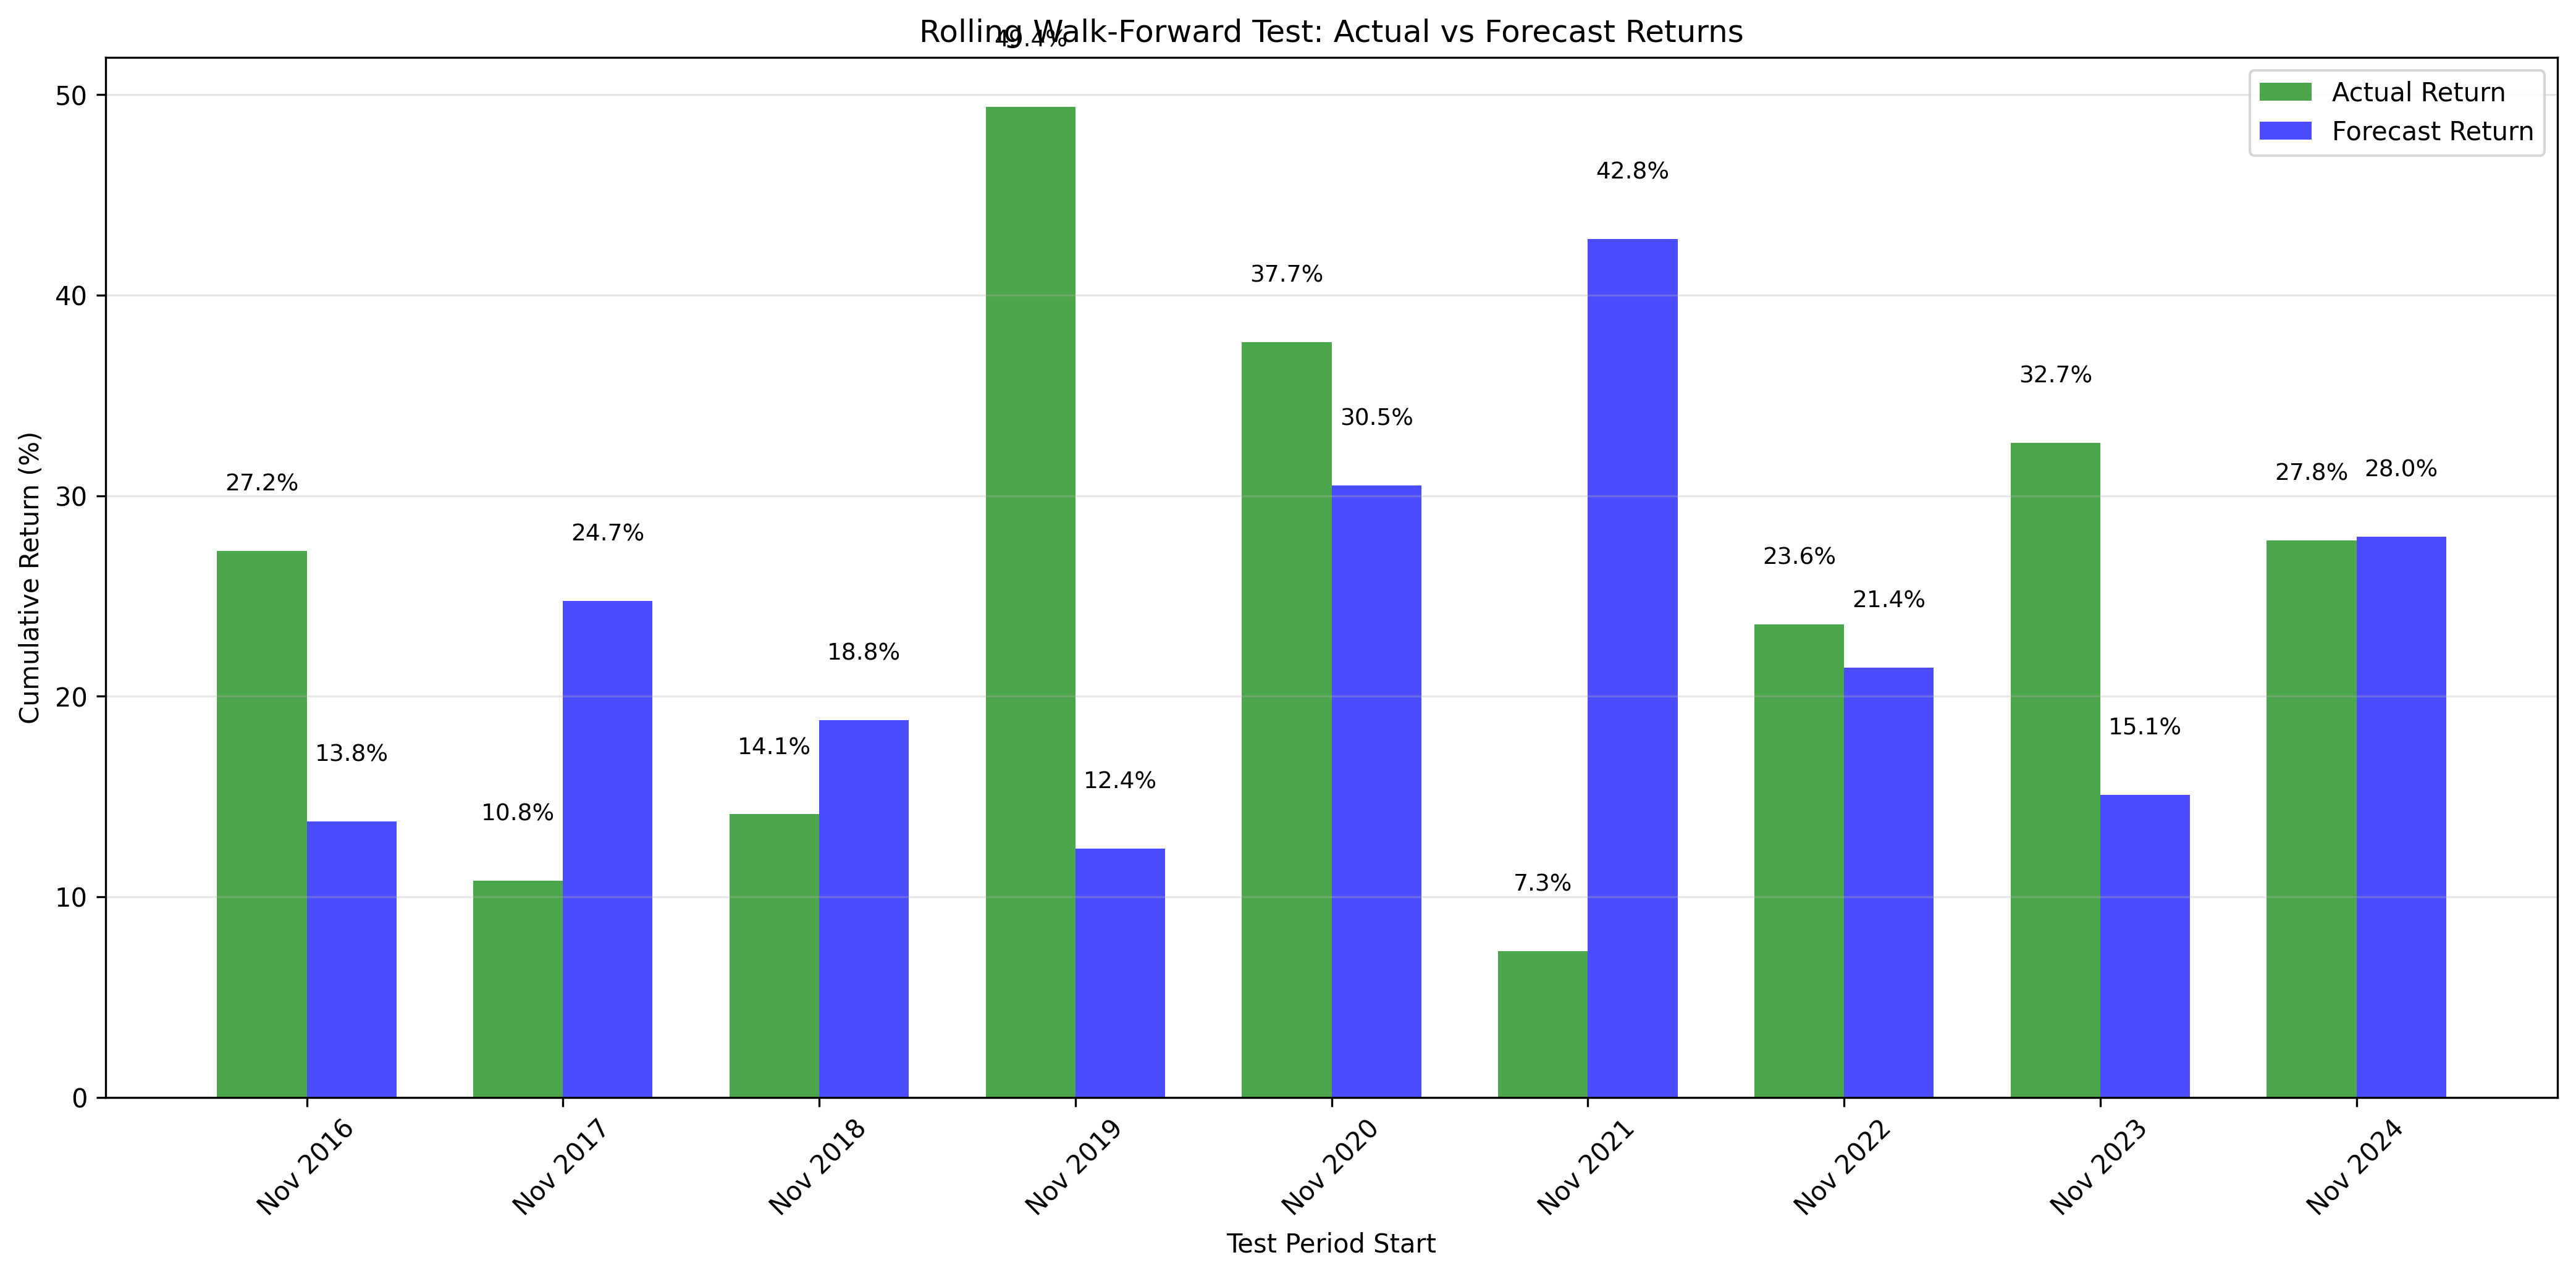
The 9-iteration rolling test is pristine. Most notably, Iteration 6 (2021-2022) covers the inflation shock and tech crash. While the market cratered, this strategy delivered positive returns. This non-correlation during crises validates the logic of this strategy.
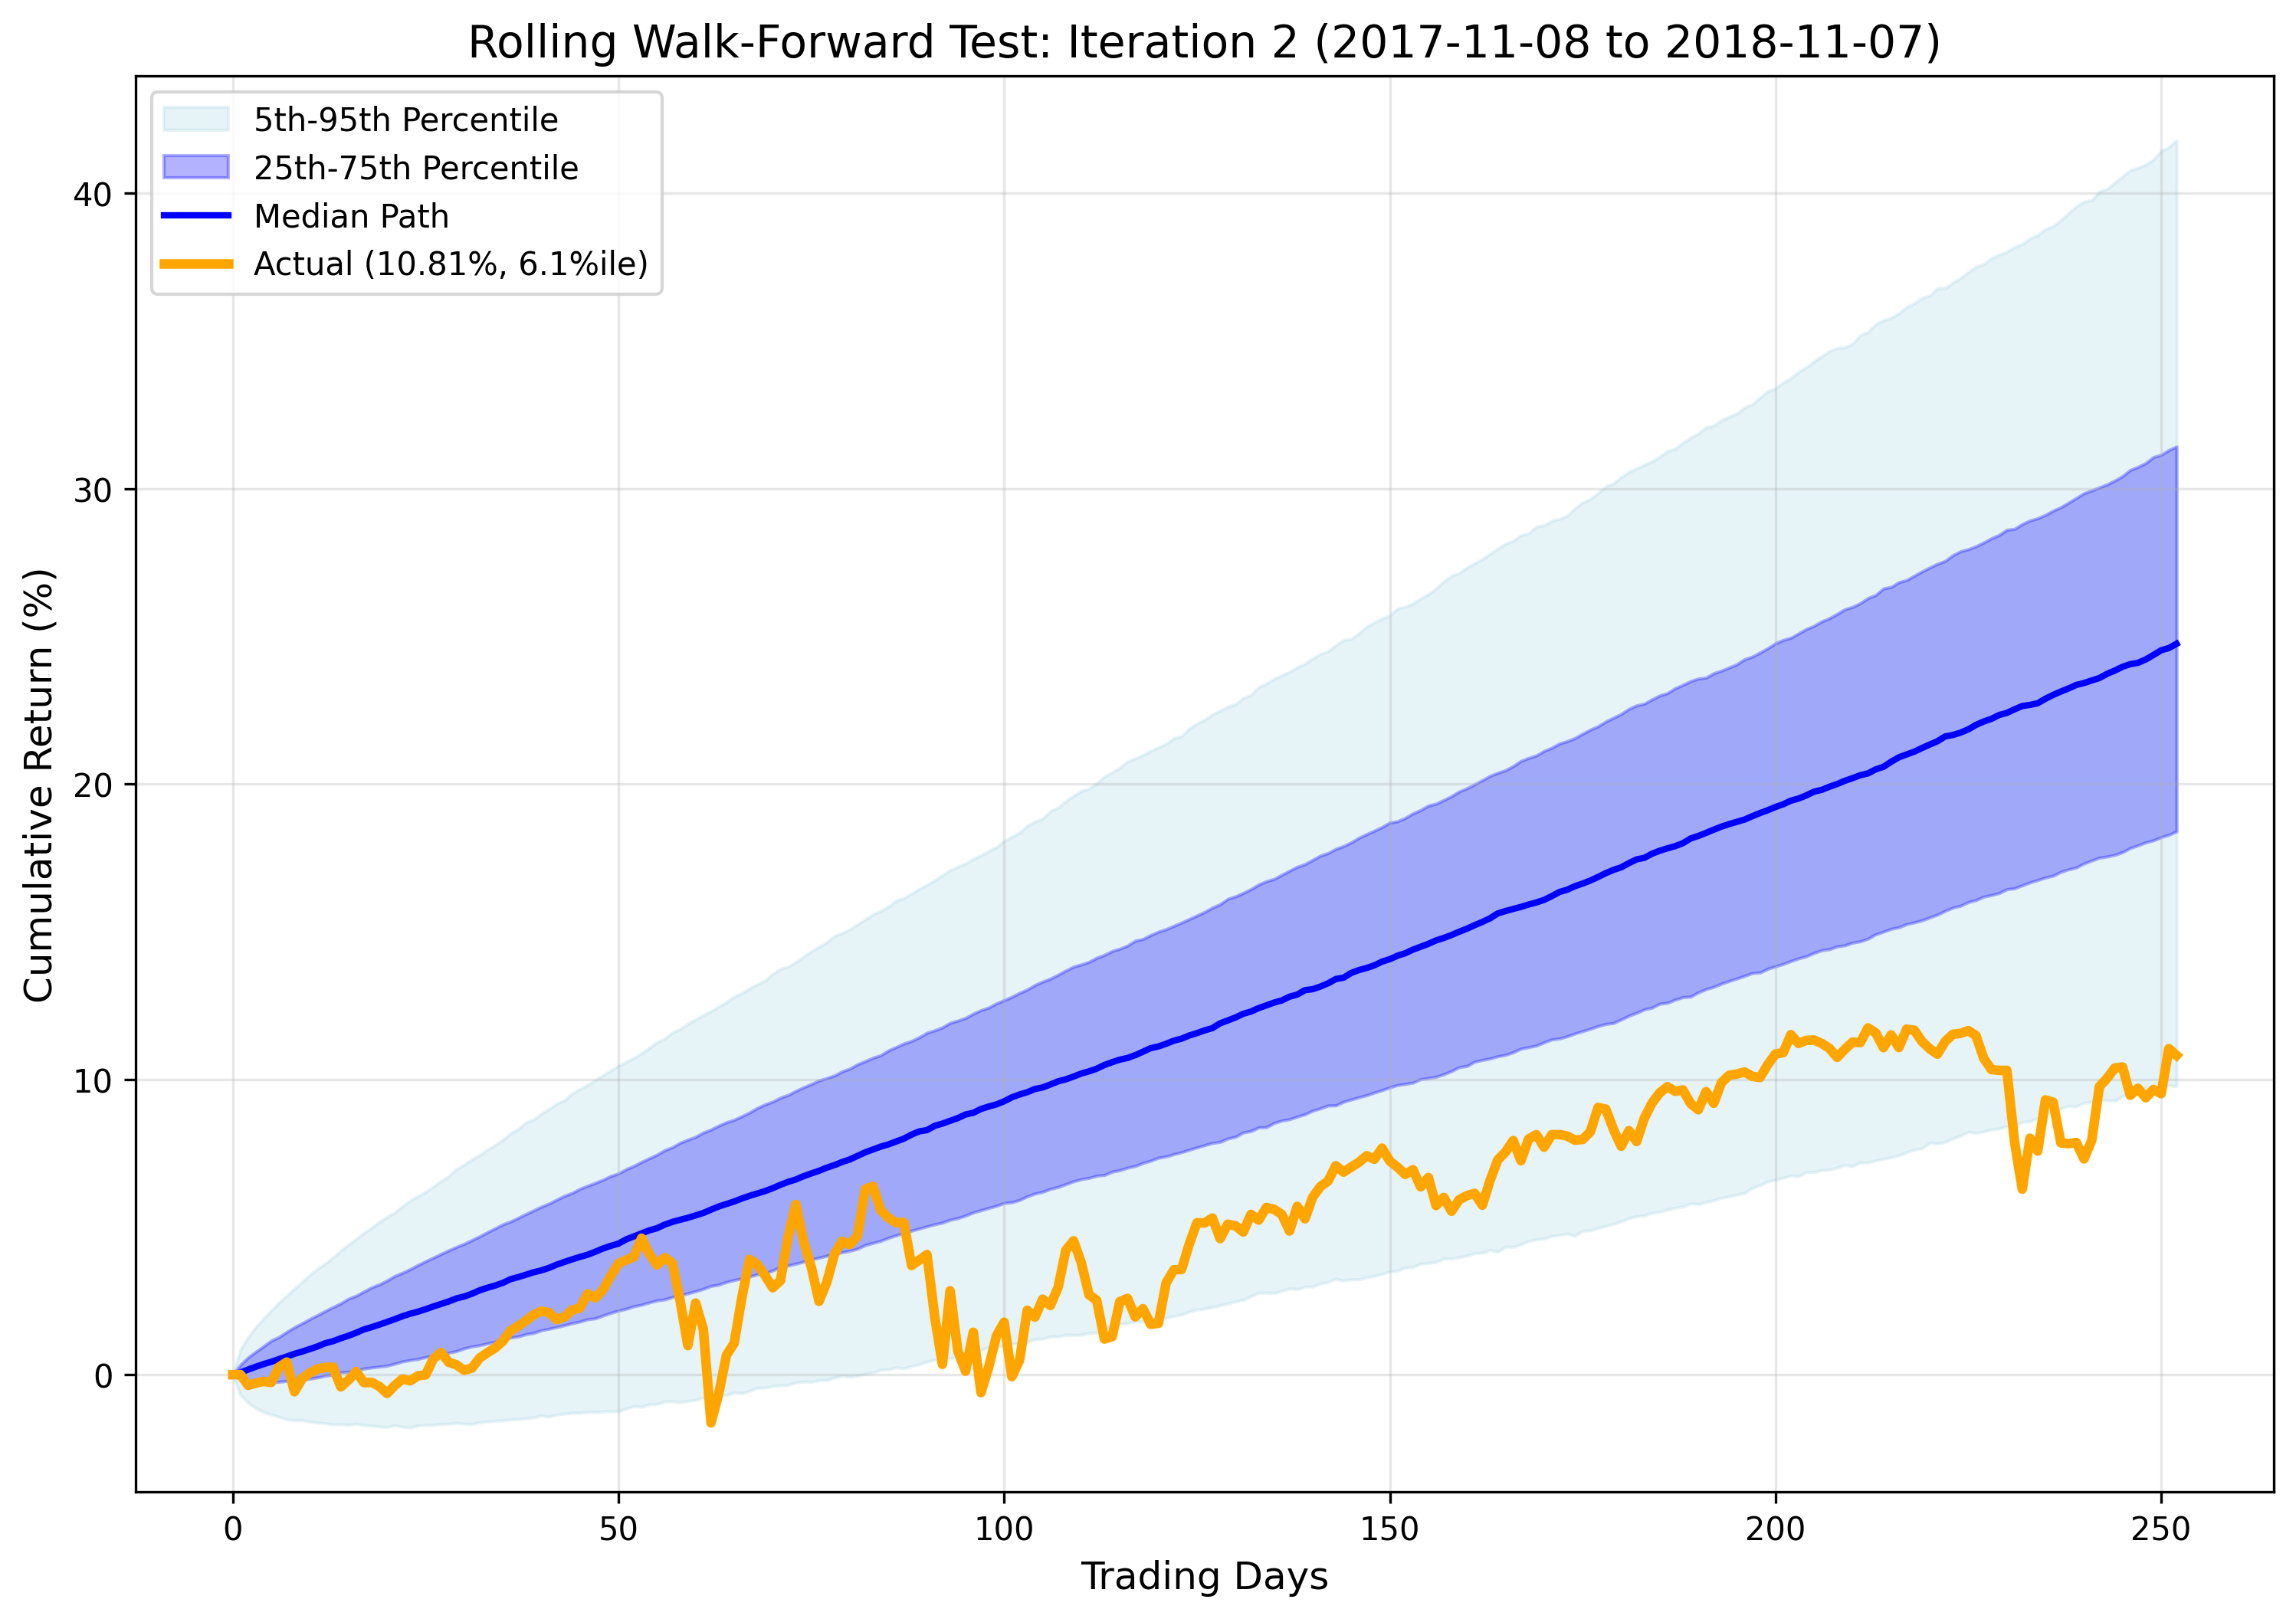
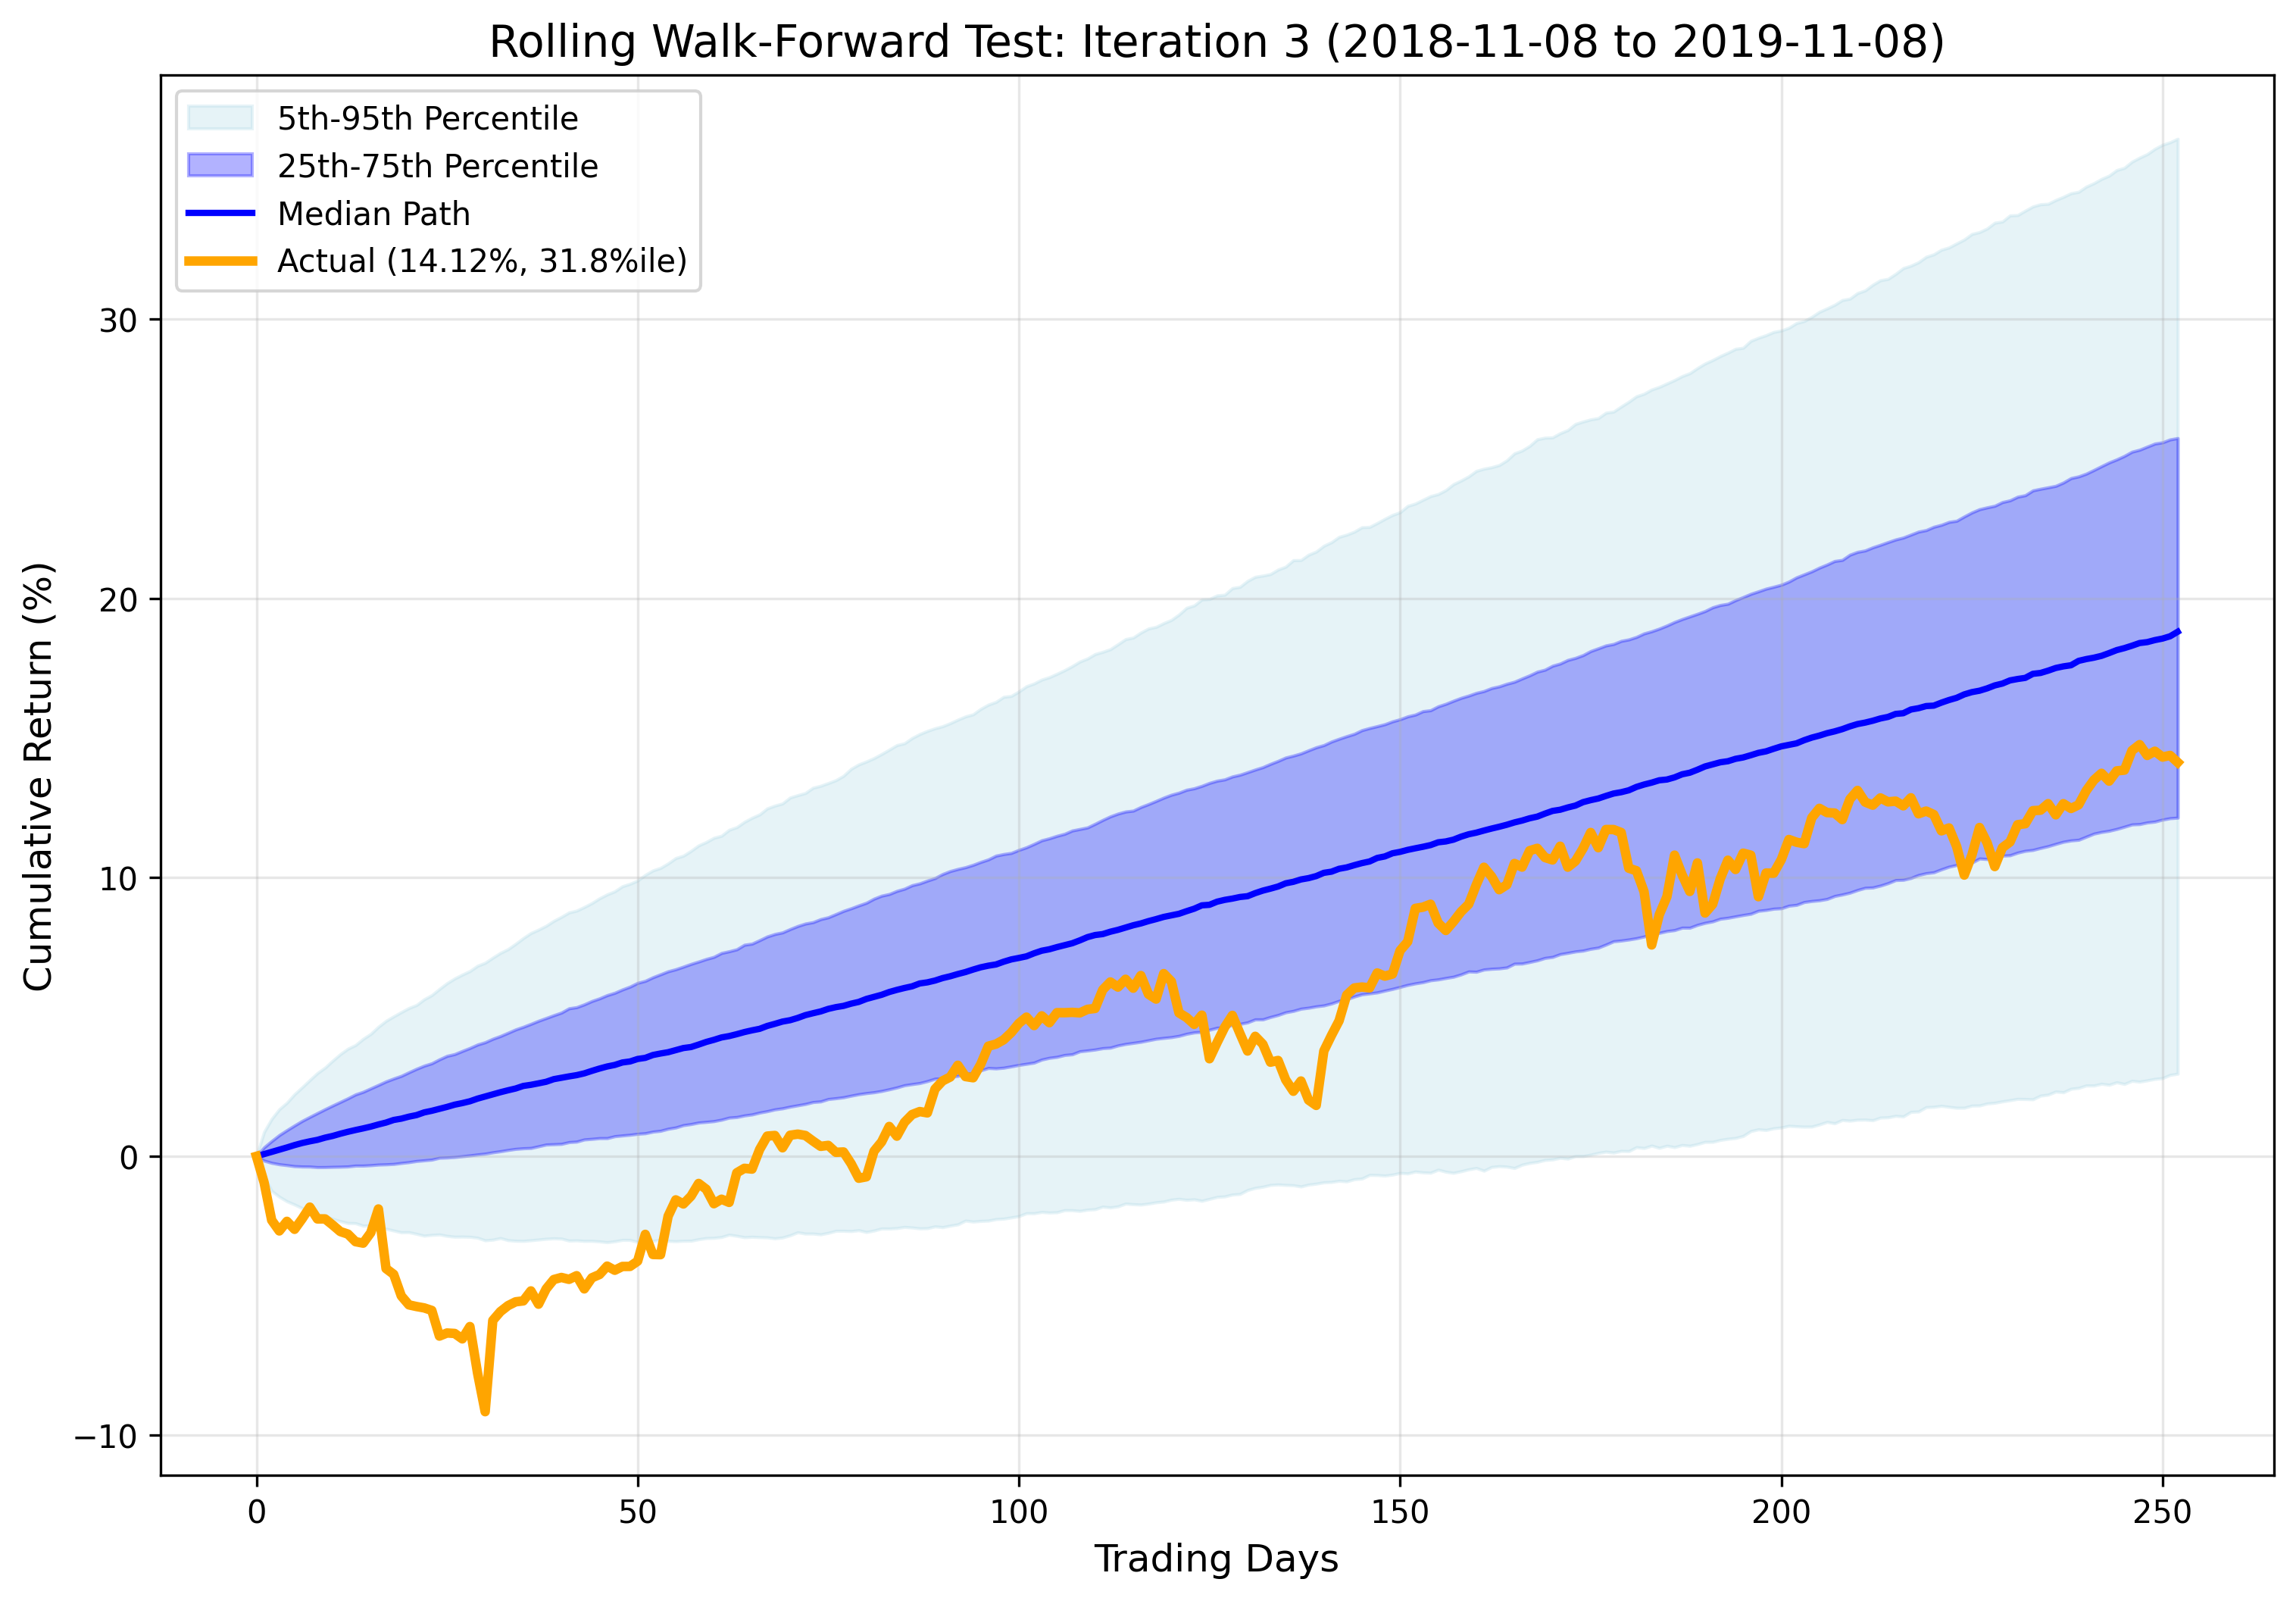
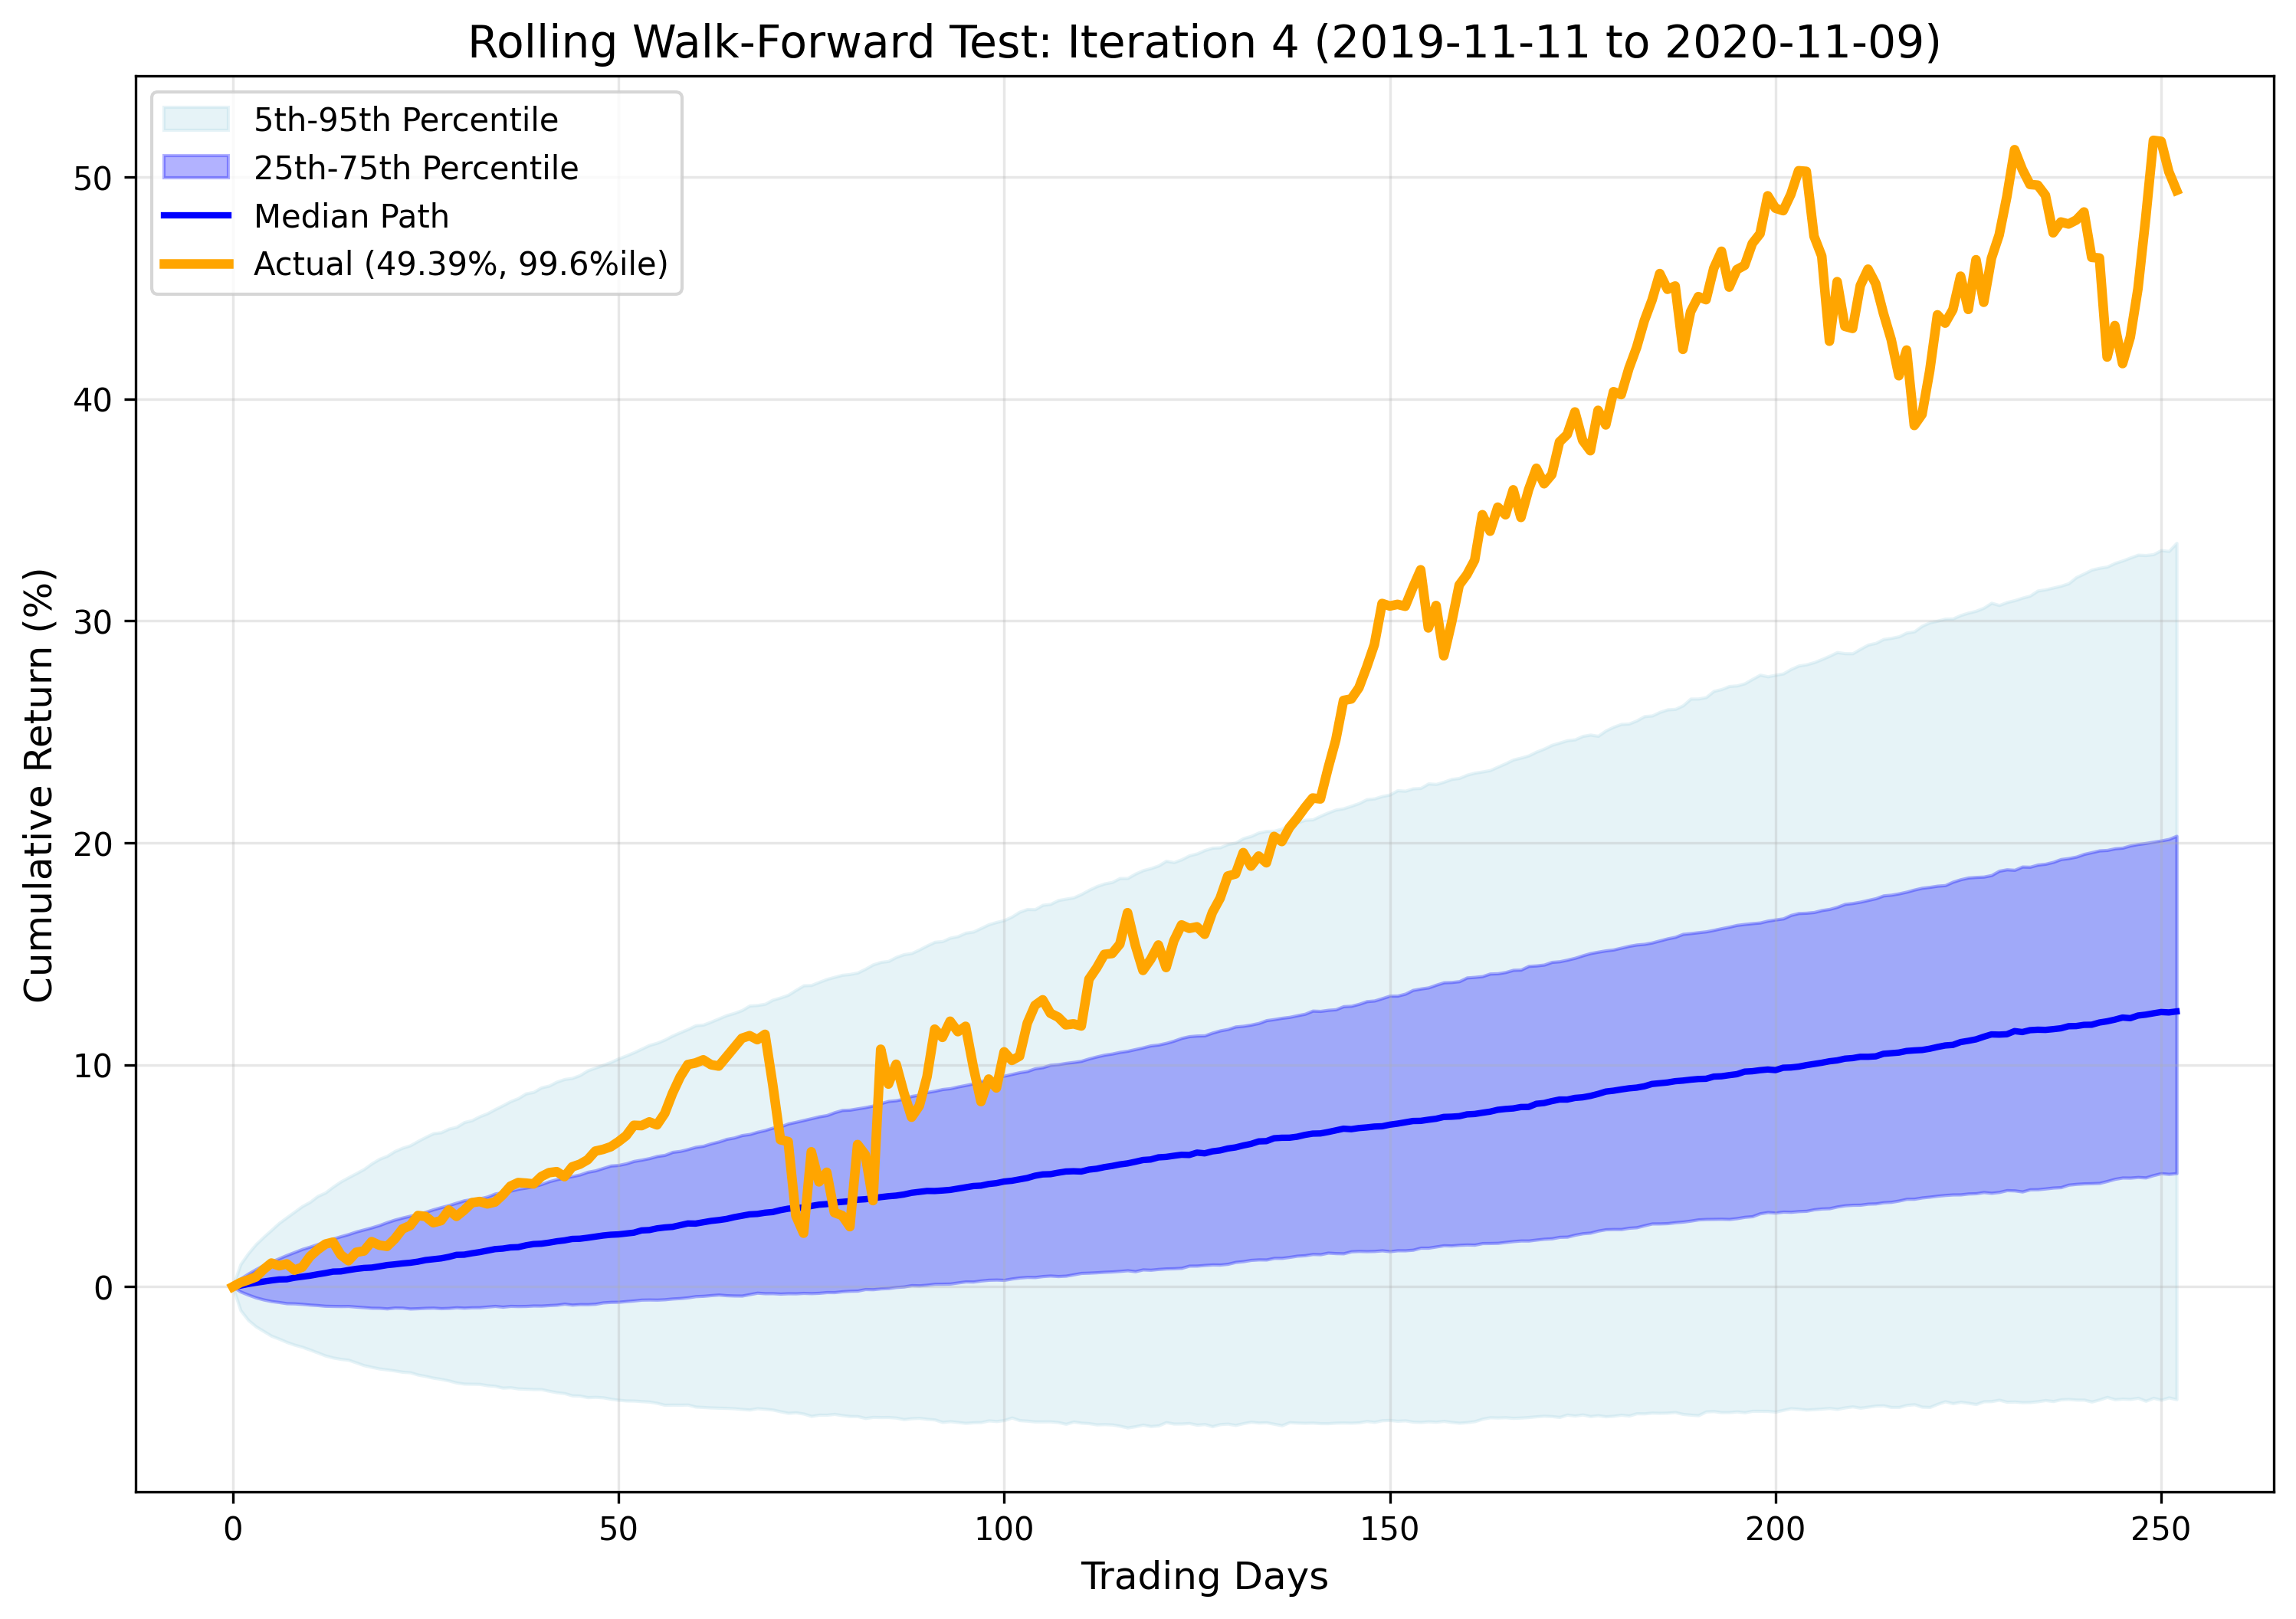
NOTE: This strategy is intentionally designed to capture outlier returns during specific market conditions. Following the periods of exceptional performance, Monte Carlo forecasts may appear overly optimistic in subsequent iterations, consequently making the strategy appear to underperform during those iterations. This is expected behavior as the simulations incorporate recent extreme returns into their probability distributions.
| Rank | Trading Days | Calendar Days | Max Drawdown | Start Date | End Date |
|---|---|---|---|---|---|
| 1 | 27 | 38 | 2.36% | 2017-06-05 | 2017-07-13 |
| 2 | 20 | 28 | 1.41% | 2017-09-12 | 2017-10-10 |
| Rank | Trading Days | Calendar Days | Max Drawdown | Start Date | End Date |
|---|---|---|---|---|---|
| 1 | 58 | 84 | 6.57% | 2018-03-12 | 2018-06-04 |
| 2 | 18 | 27 | 5.98% | 2018-01-26 | 2018-02-22 |
| 3 | 40 | 55 | 4.89% | 2018-09-13 | 2018-11-07 |
| 4 | 16 | 25 | 1.98% | 2018-06-14 | 2018-07-09 |
| 5 | 18 | 27 | 1.06% | 2017-11-17 | 2017-12-14 |
| Rank | Trading Days | Calendar Days | Max Drawdown | Start Date | End Date |
|---|---|---|---|---|---|
| 1 | 65 | 98 | 9.15% | 2018-11-08 | 2019-02-14 |
| 2 | 27 | 40 | 4.43% | 2019-05-03 | 2019-06-12 |
| 3 | 26 | 39 | 3.70% | 2019-07-26 | 2019-09-03 |
| 4 | 30 | 42 | 2.68% | 2019-09-12 | 2019-10-24 |
| Rank | Trading Days | Calendar Days | Max Drawdown | Start Date | End Date |
|---|---|---|---|---|---|
| 1 | 21 | 31 | 8.05% | 2020-02-21 | 2020-03-23 |
| 2 | 27 | 38 | 7.64% | 2020-09-01 | 2020-10-09 |
| 3 | 17 | 23 | 6.37% | 2020-10-12 | 2020-11-04 |
| Rank | Trading Days | Calendar Days | Max Drawdown | Start Date | End Date |
|---|---|---|---|---|---|
| 1 | 19 | 28 | 5.03% | 2021-02-12 | 2021-03-12 |
| 2 | 31 | 44 | 3.38% | 2021-04-20 | 2021-06-03 |
| 3 | 28 | 41 | 2.92% | 2021-09-03 | 2021-10-14 |
| Rank | Trading Days | Calendar Days | Max Drawdown | Start Date | End Date |
|---|---|---|---|---|---|
| 1 | 61 | 85 | 8.45% | 2022-08-16 | 2022-11-09 |
| 2 | 41 | 59 | 6.21% | 2022-01-04 | 2022-03-04 |
| 3 | 26 | 40 | 5.39% | 2022-06-16 | 2022-07-26 |
| 4 | 53 | 77 | 4.94% | 2022-03-29 | 2022-06-14 |
| Rank | Trading Days | Calendar Days | Max Drawdown | Start Date | End Date |
|---|---|---|---|---|---|
| 1 | 47 | 69 | 6.50% | 2023-02-02 | 2023-04-12 |
| 2 | 42 | 57 | 5.64% | 2023-09-14 | 2023-11-10 |
| 3 | 23 | 35 | 3.66% | 2022-12-01 | 2023-01-05 |
| 4 | 16 | 22 | 3.19% | 2023-08-07 | 2023-08-29 |
| 5 | 18 | 26 | 2.35% | 2023-04-13 | 2023-05-09 |
| Rank | Trading Days | Calendar Days | Max Drawdown | Start Date | End Date |
|---|---|---|---|---|---|
| 1 | 16 | 22 | 2.11% | 2024-04-11 | 2024-05-03 |
| Rank | Trading Days | Calendar Days | Max Drawdown | Start Date | End Date |
|---|---|---|---|---|---|
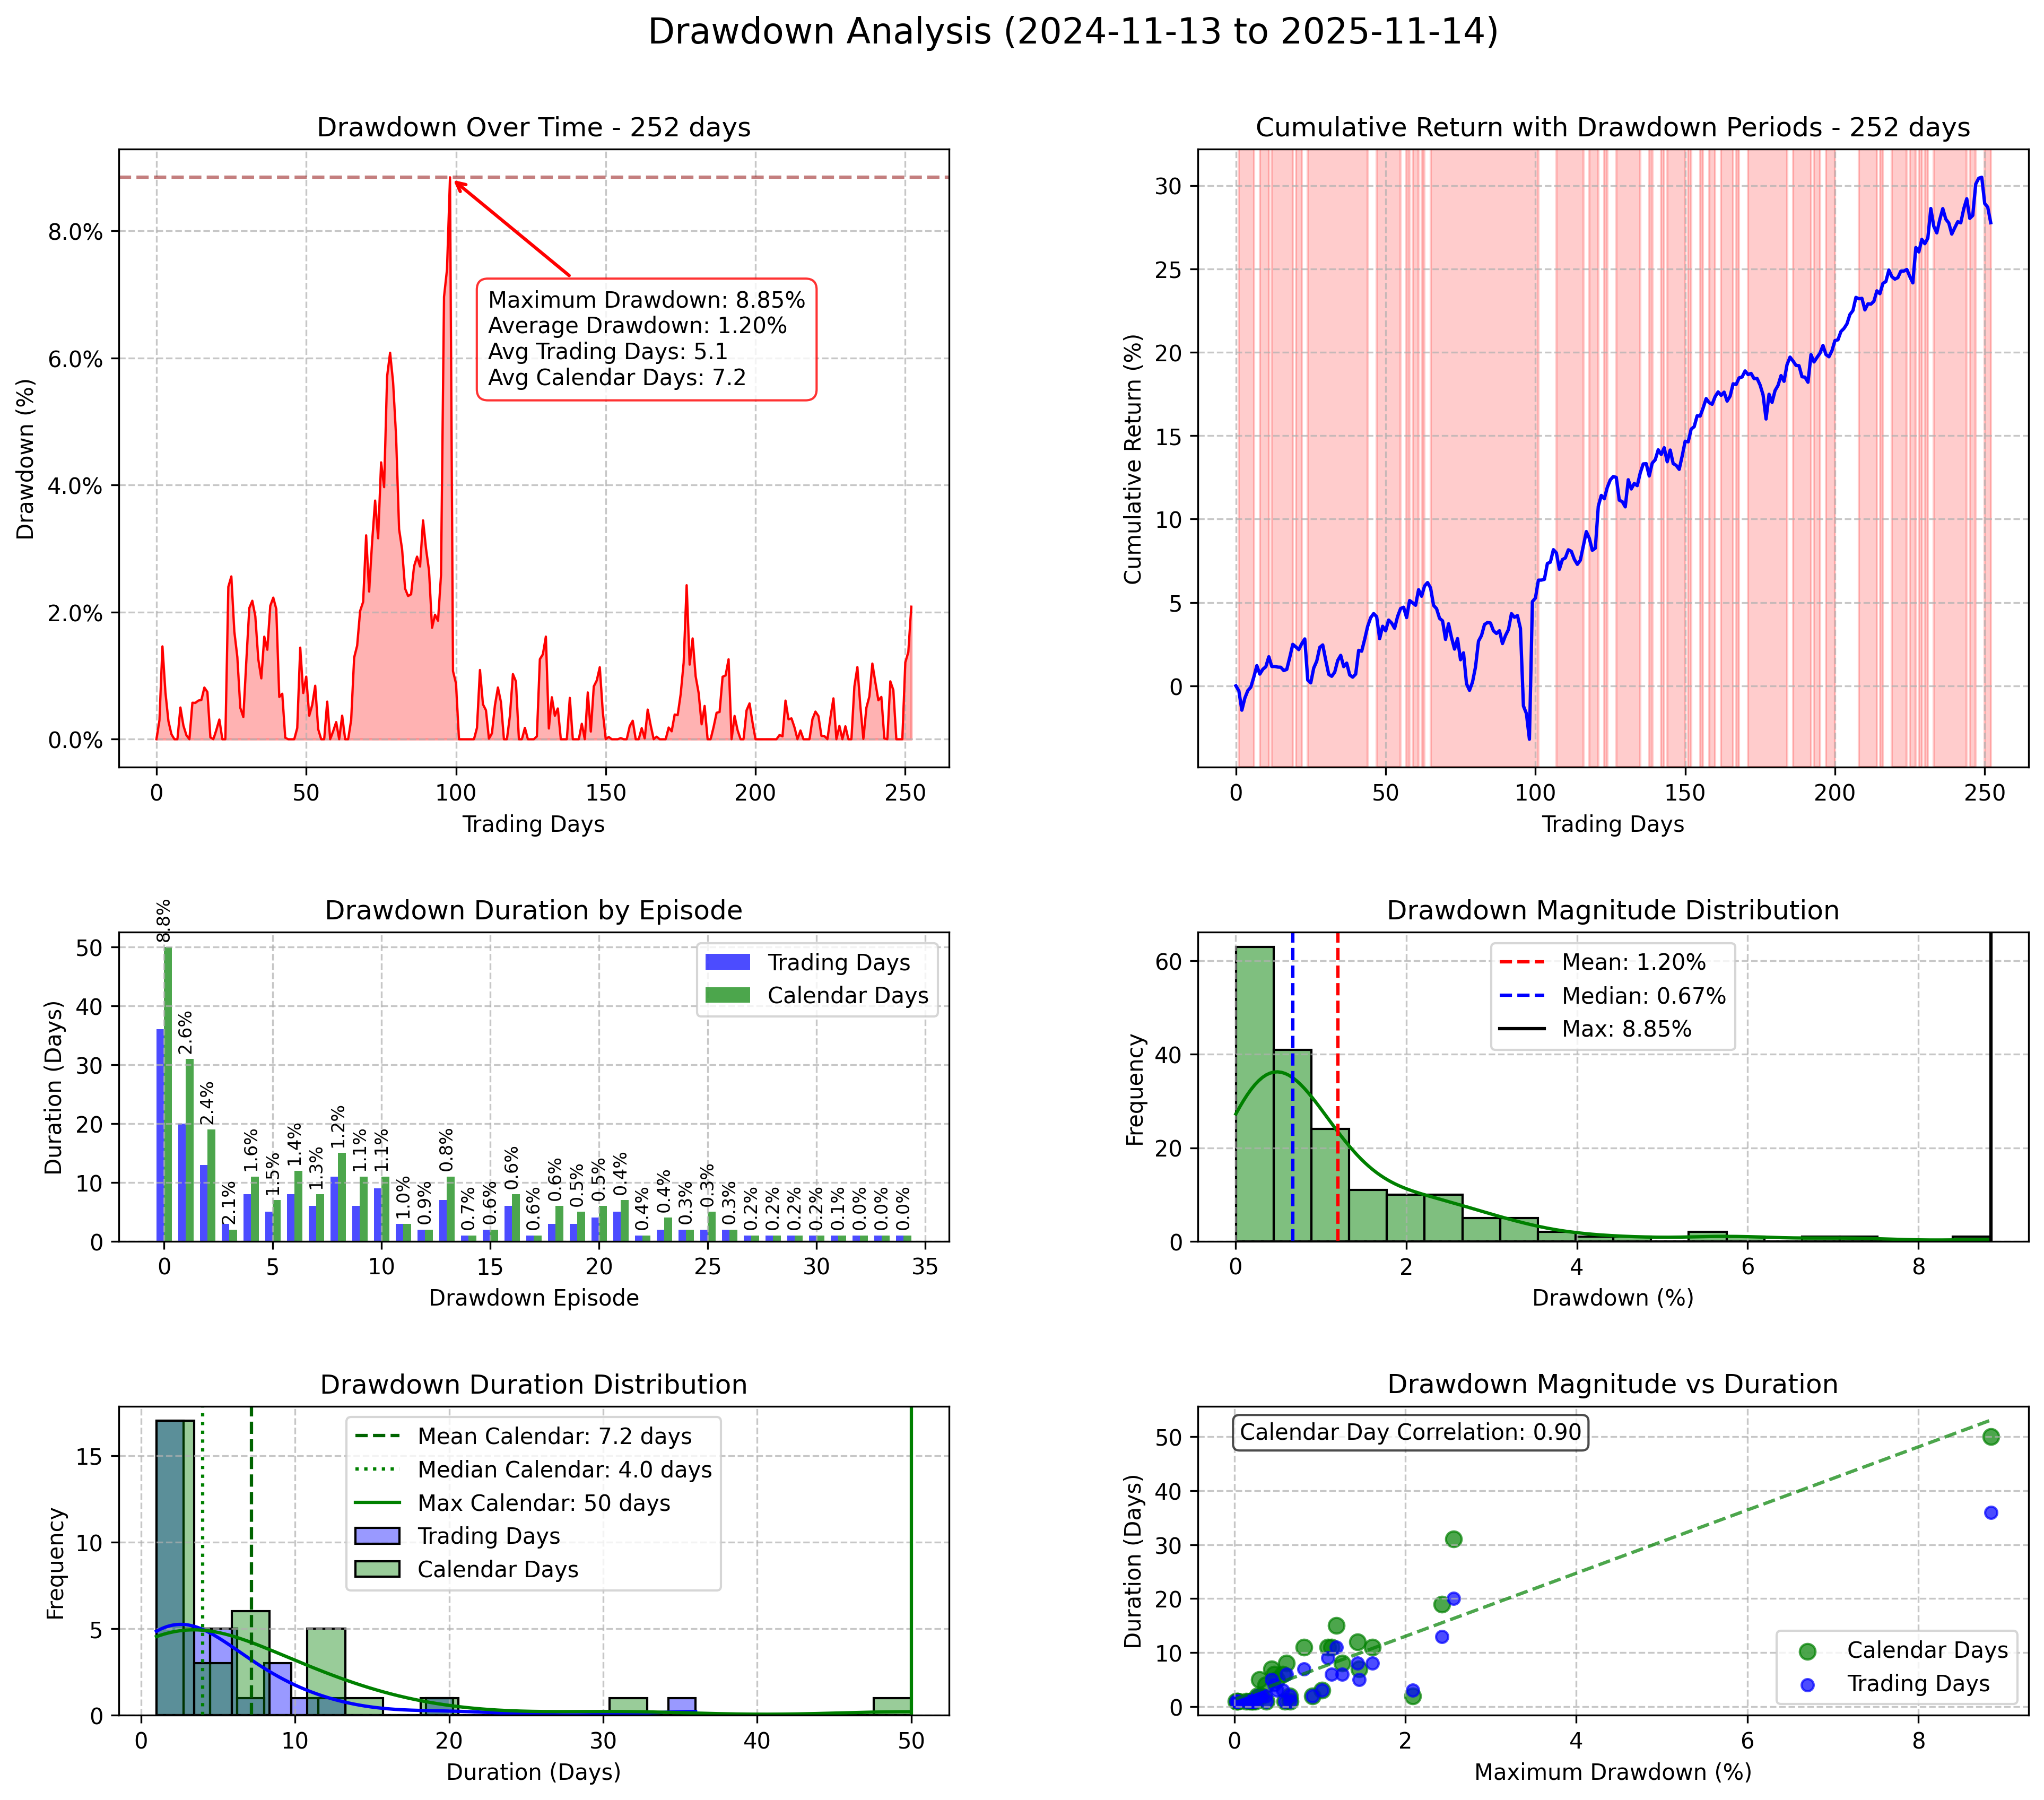
| 1 | 36 | 50 | 8.85% | 2025-02-19 | 2025-04-10 |
| 2 | 20 | 31 | 2.56% | 2024-12-17 | 2025-01-17 |
| Metric | Value |
|---|---|
| Average Actual Return | 25.61% |
| Average Forecast Return | 23.06% |
| Average Error | 2.55% |
| Average Percentile | 54.1% |
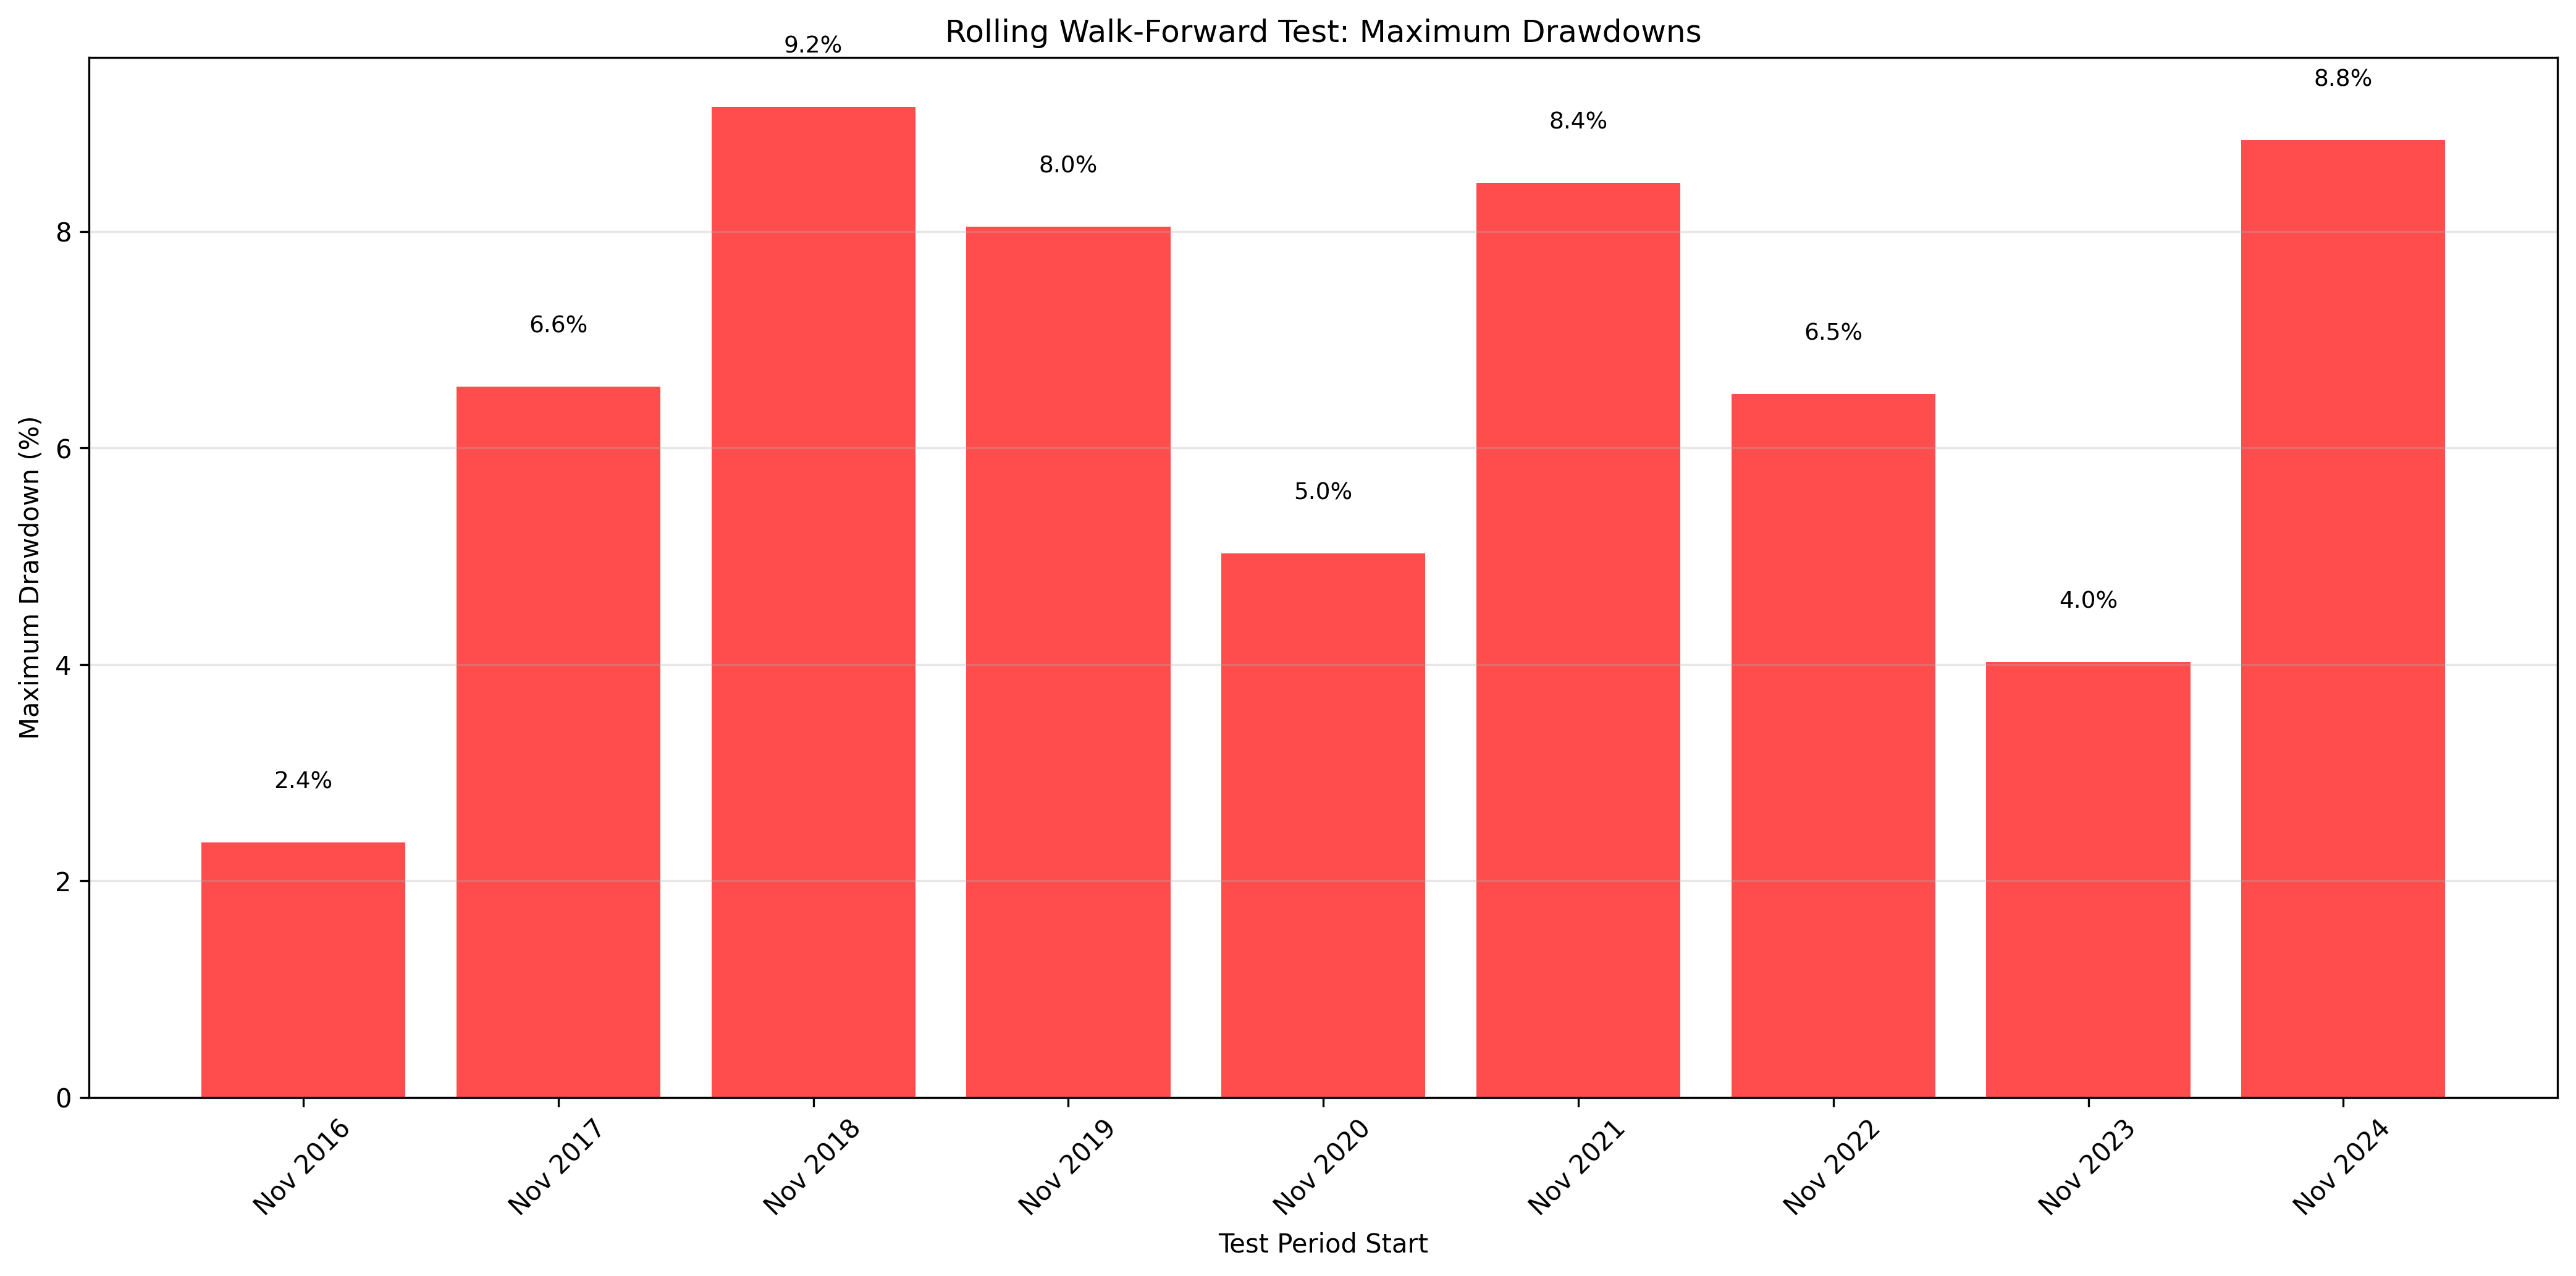
| Average Max Drawdown | 6.55% |
| Average Actual CAGR | 25.61% |
| Average Forecast CAGR | 23.06% |
Please wait while we get Zehnvisor on the line for you...