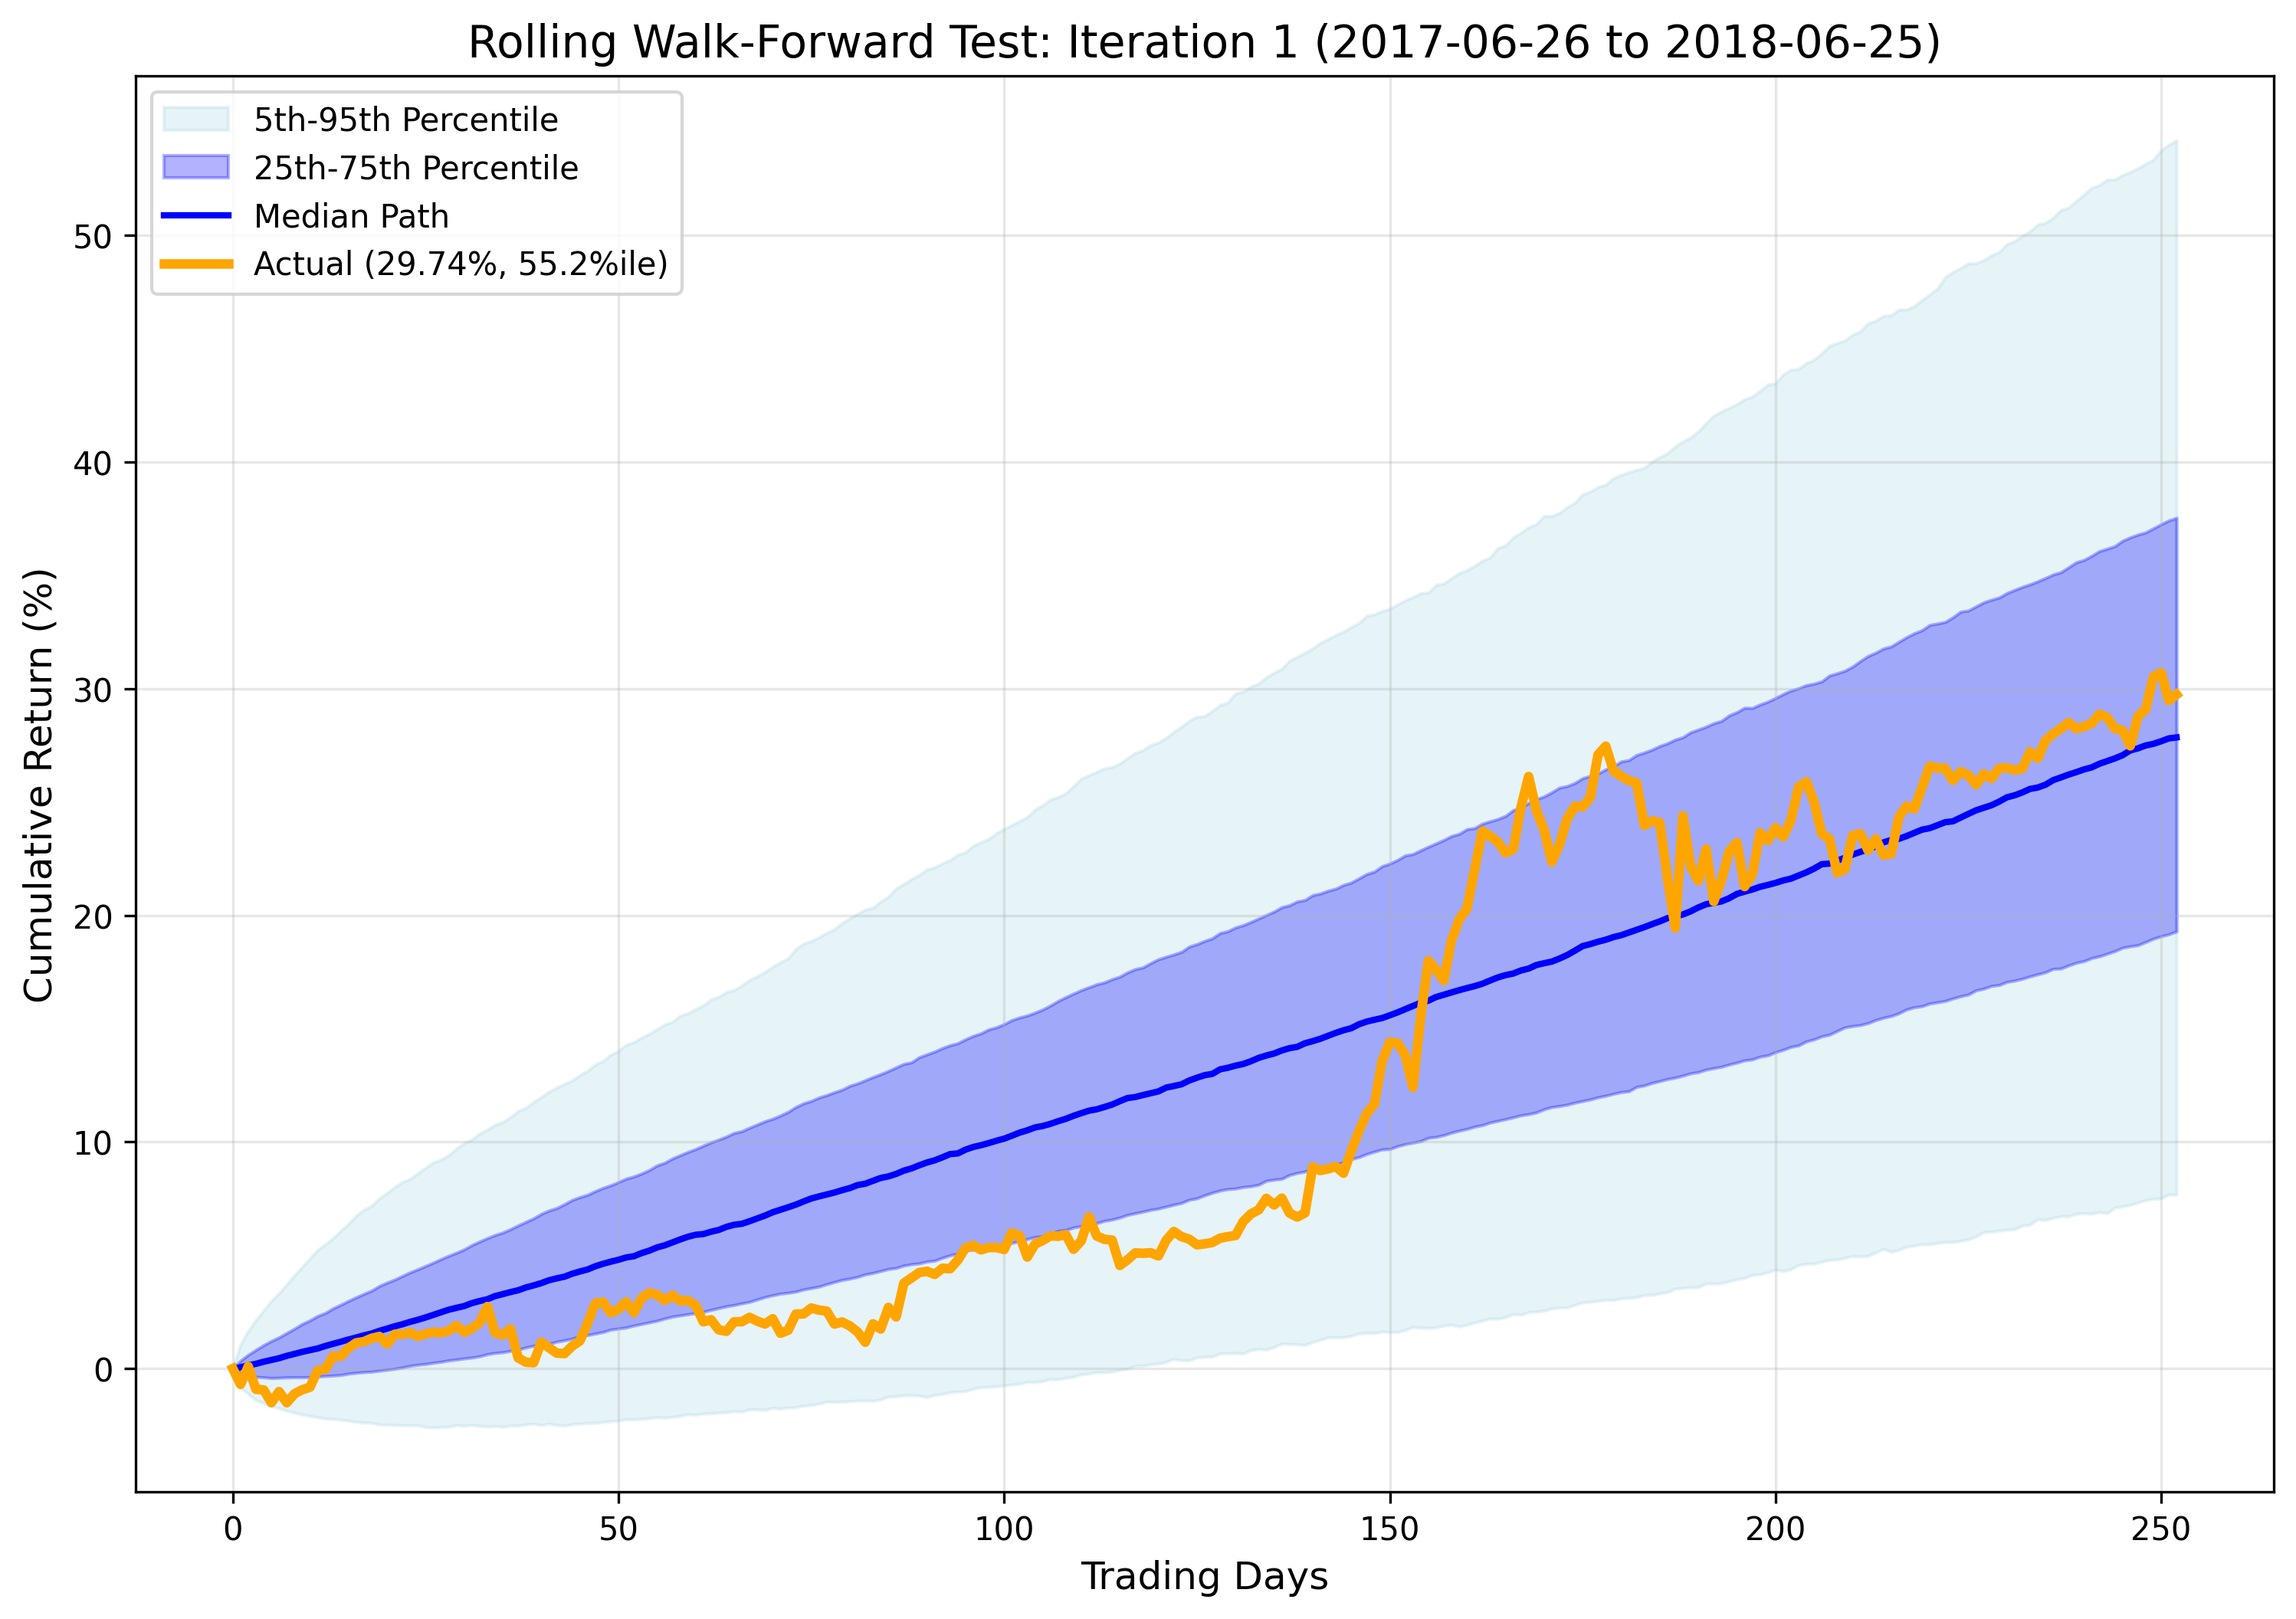
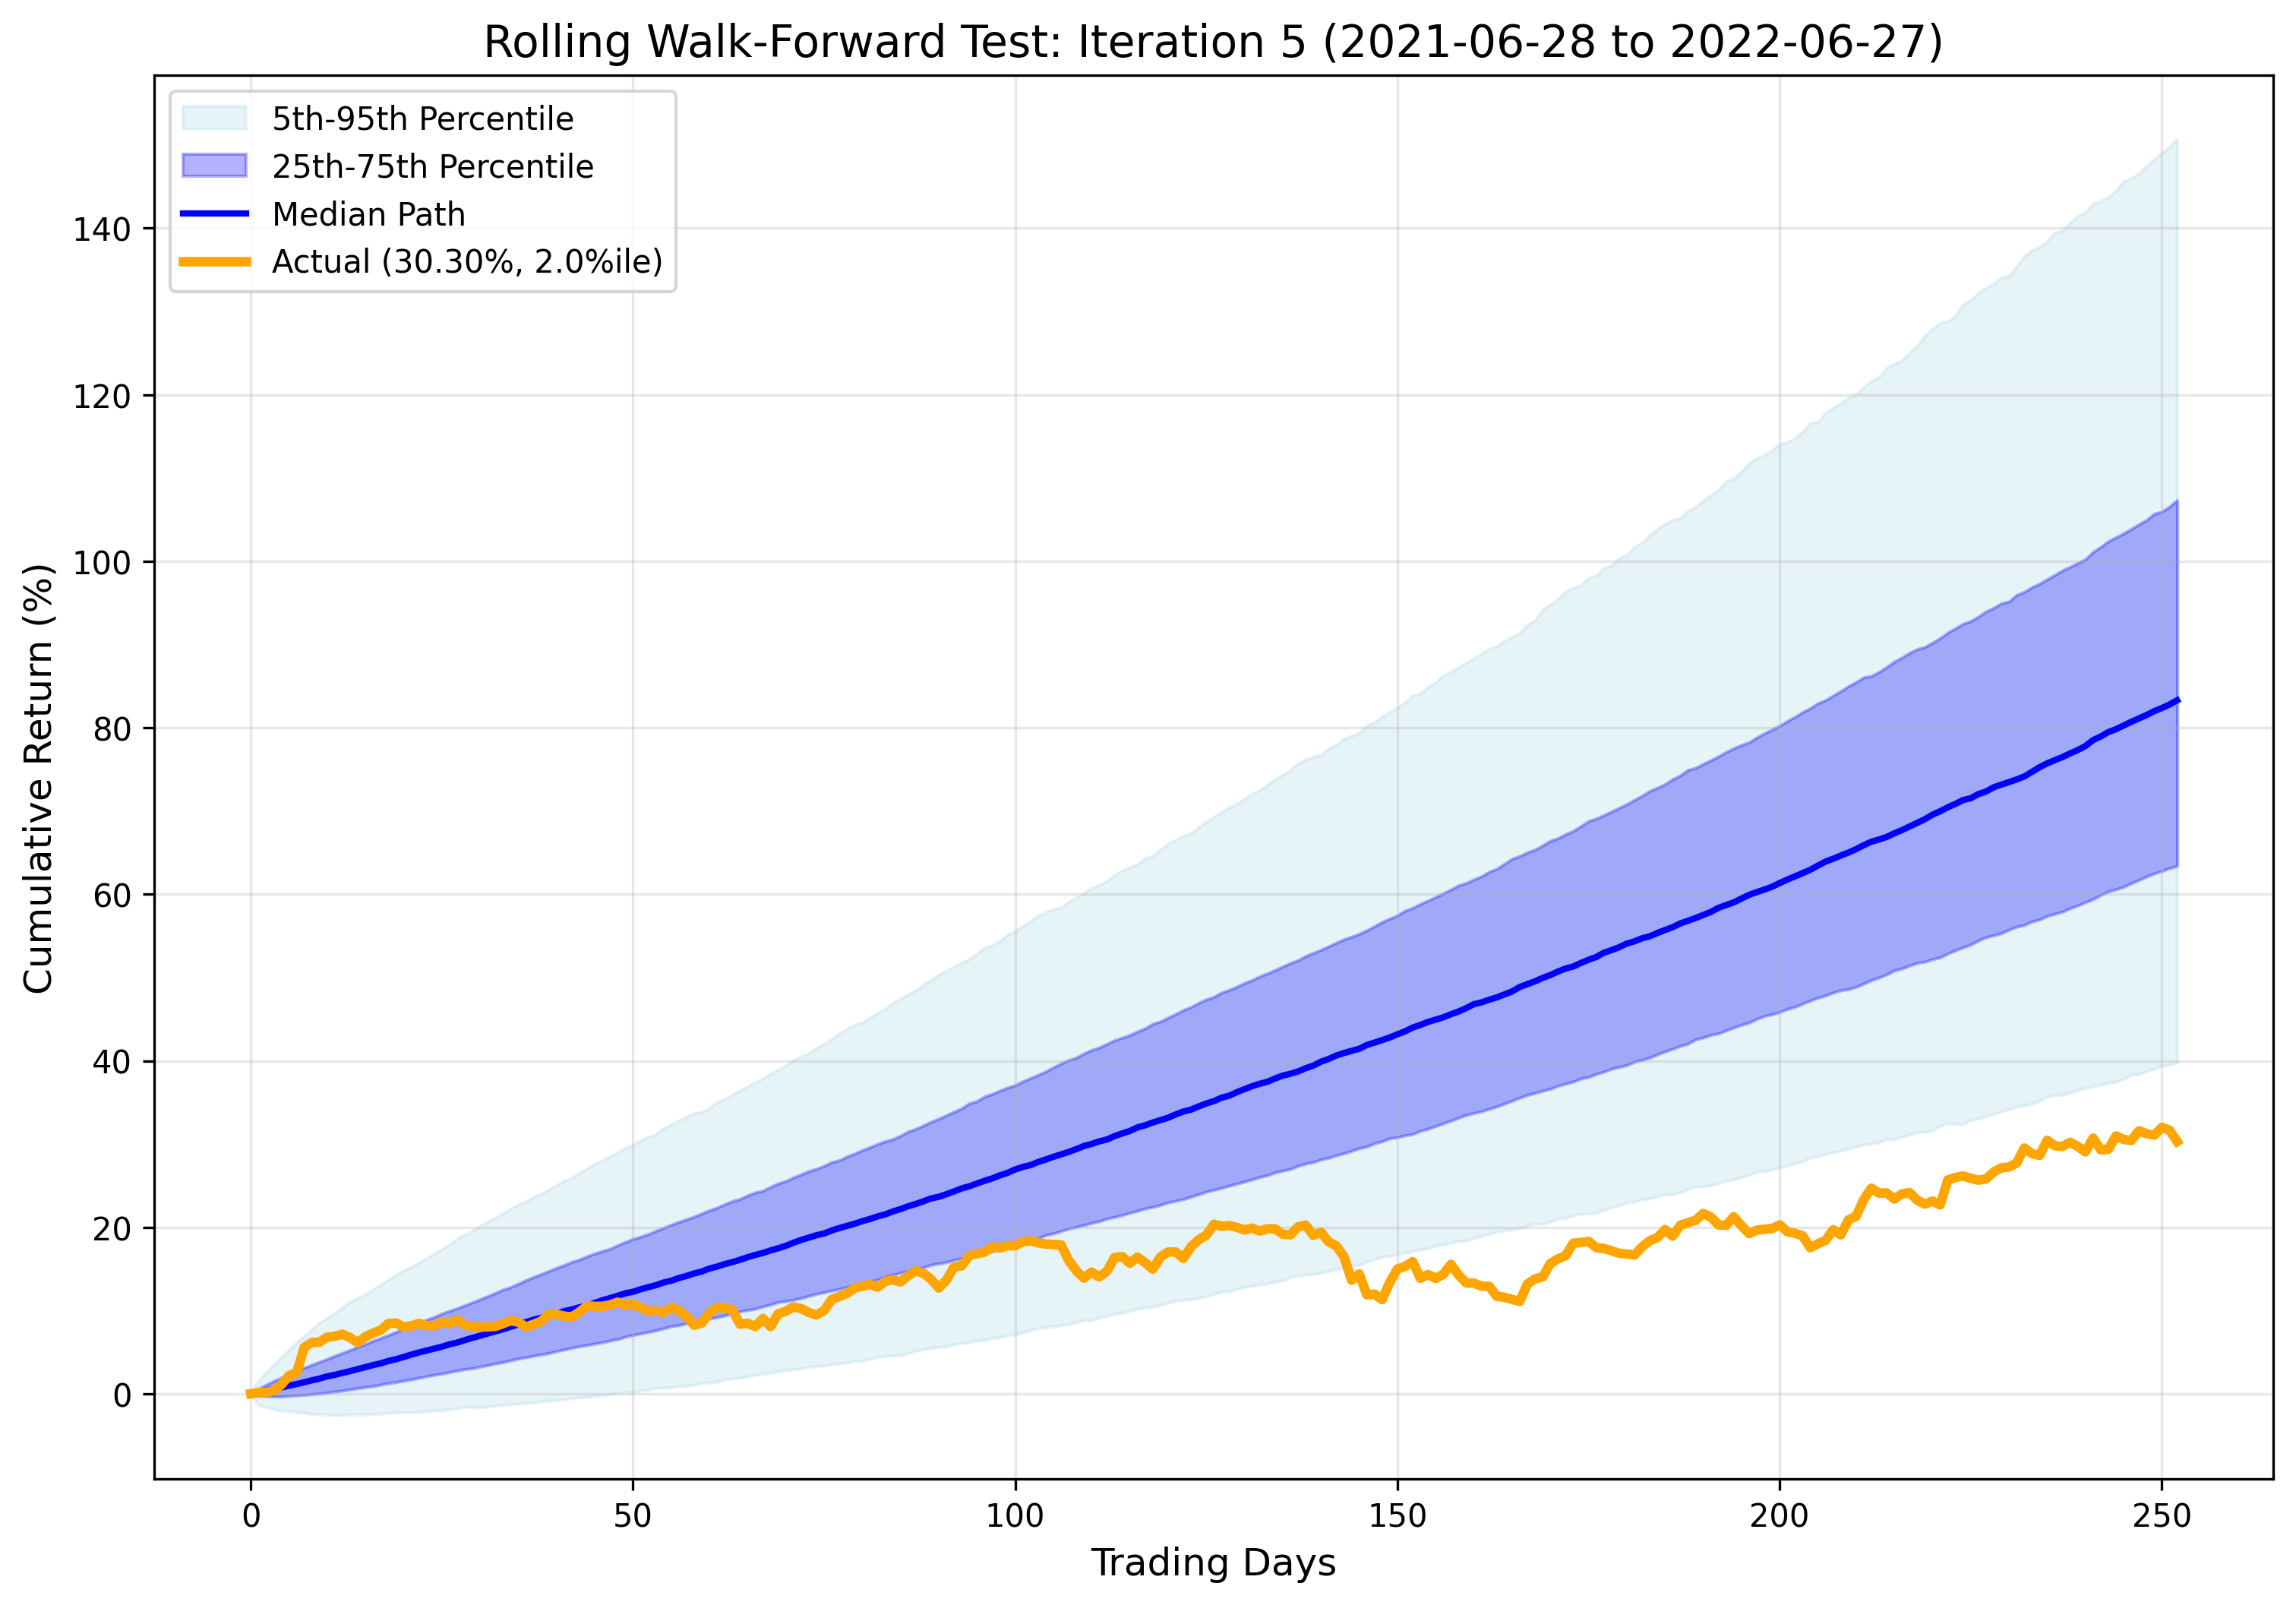
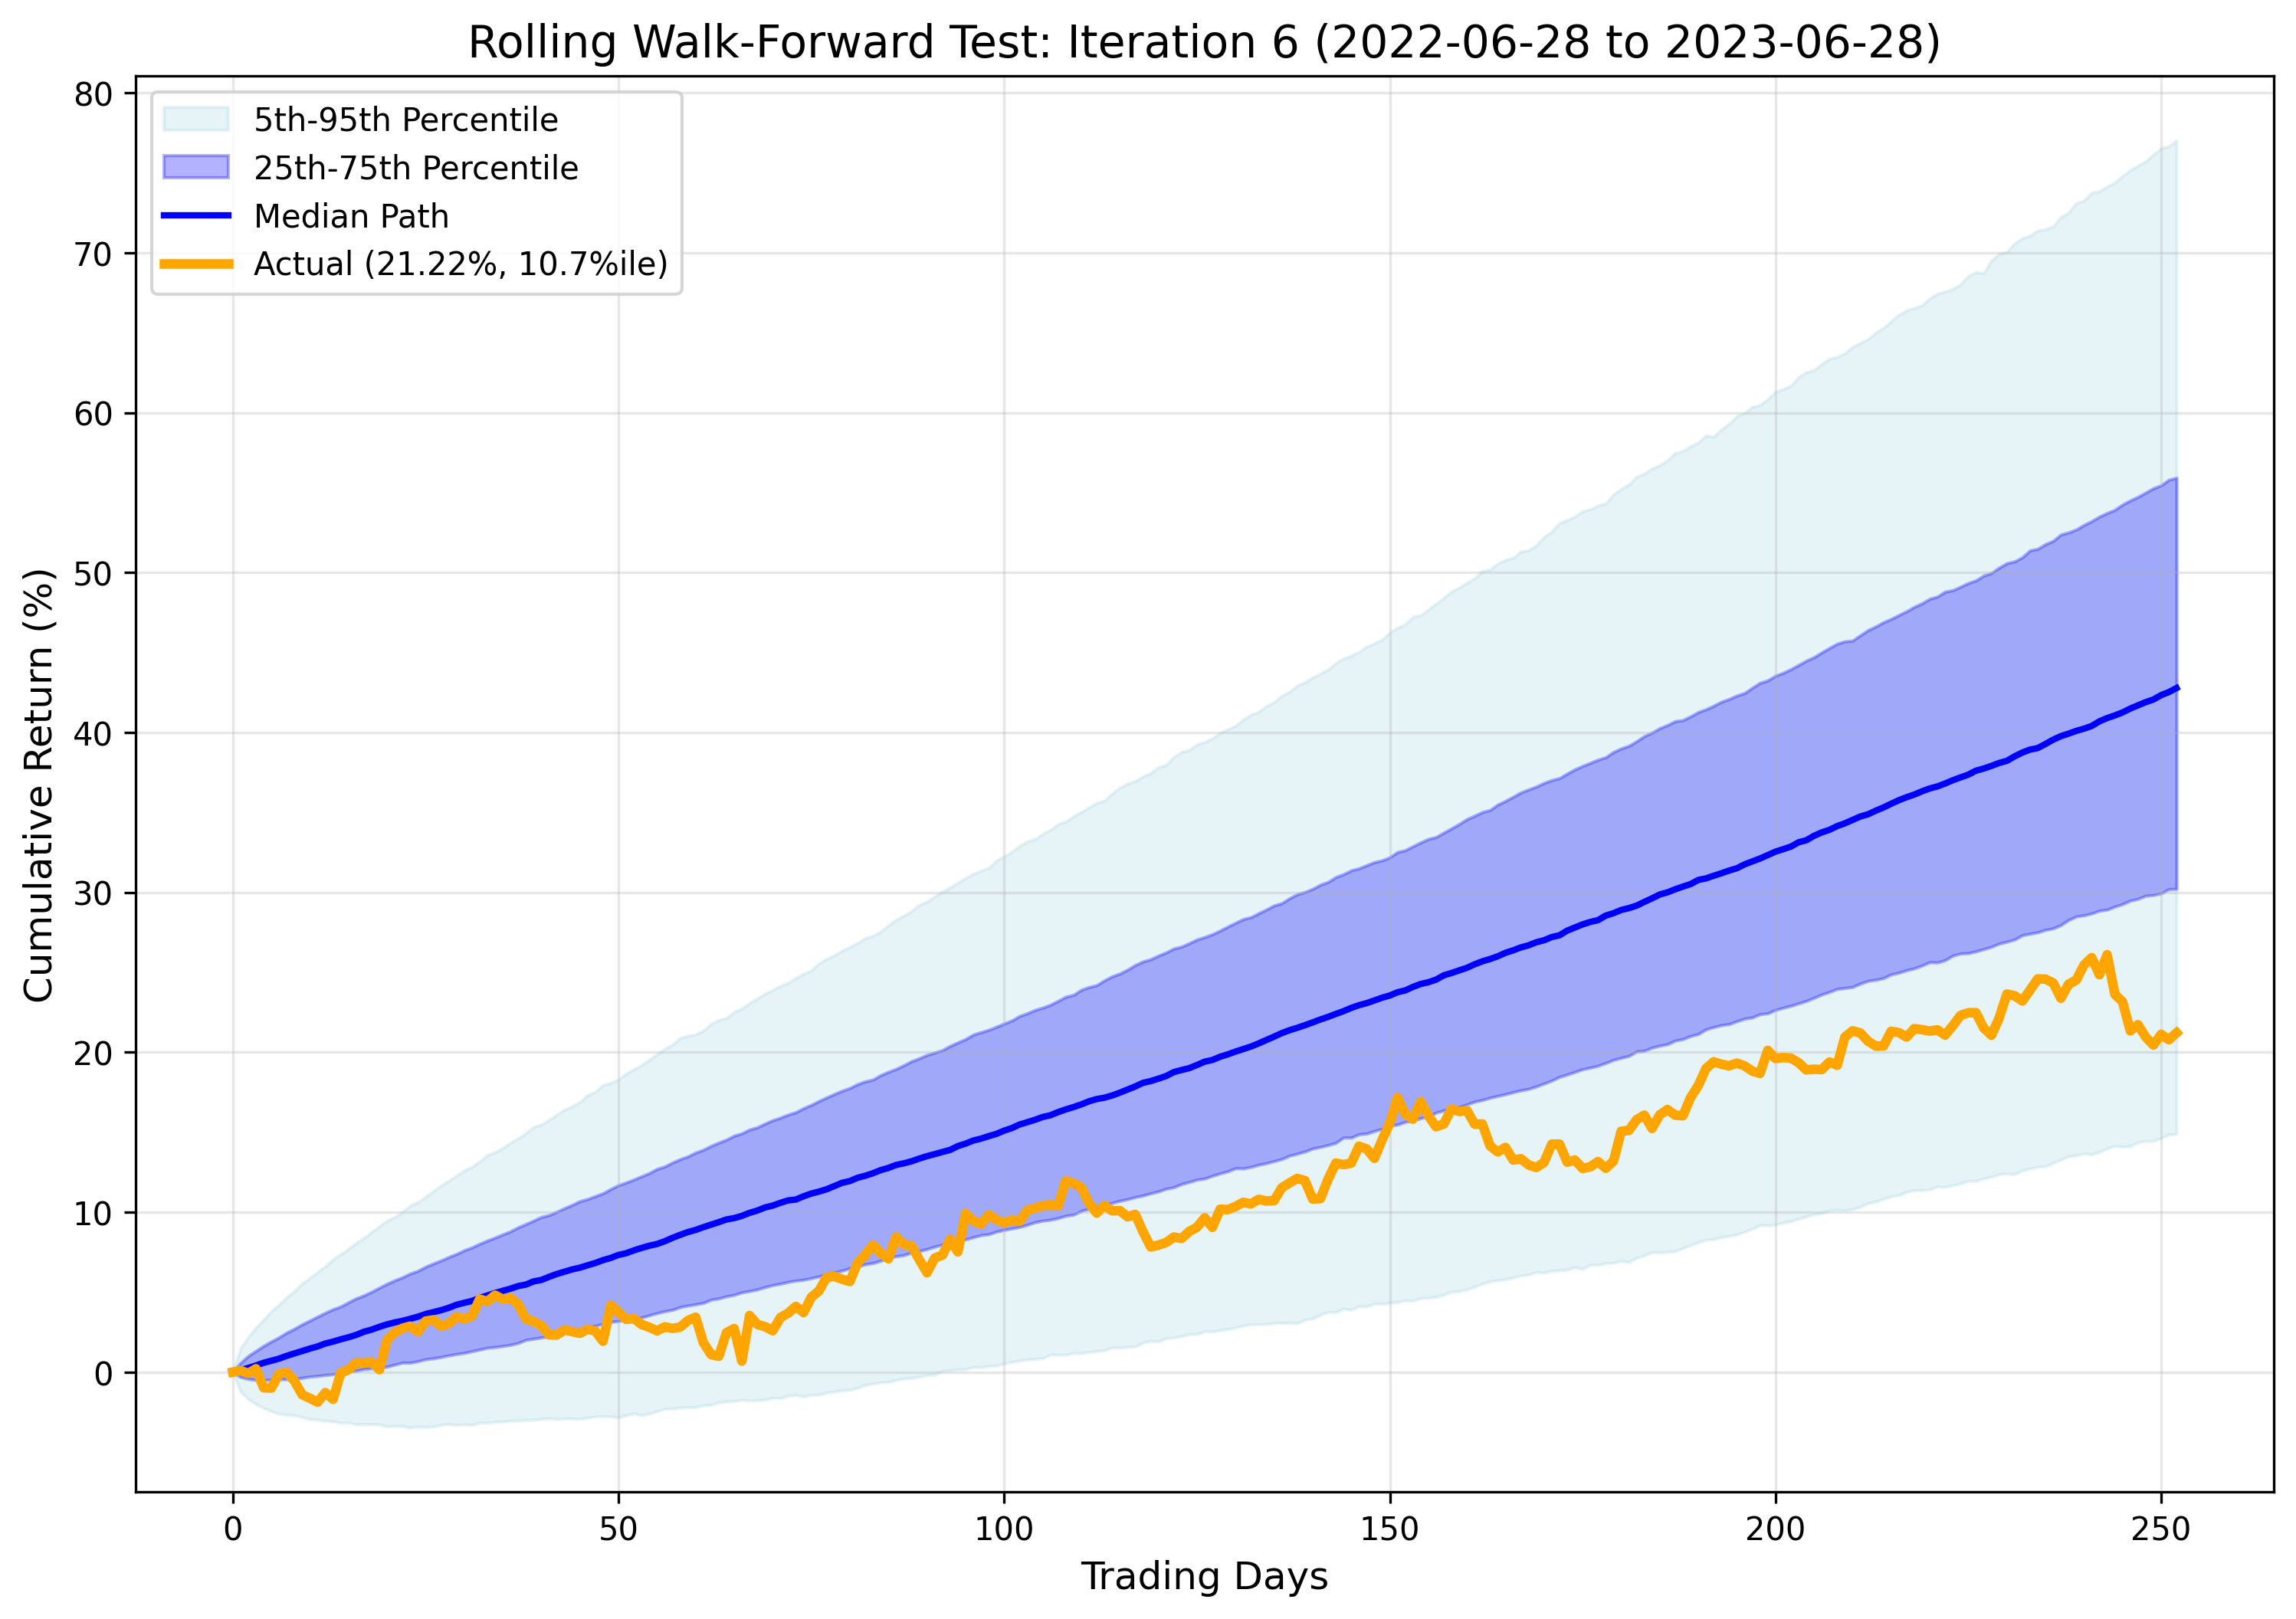
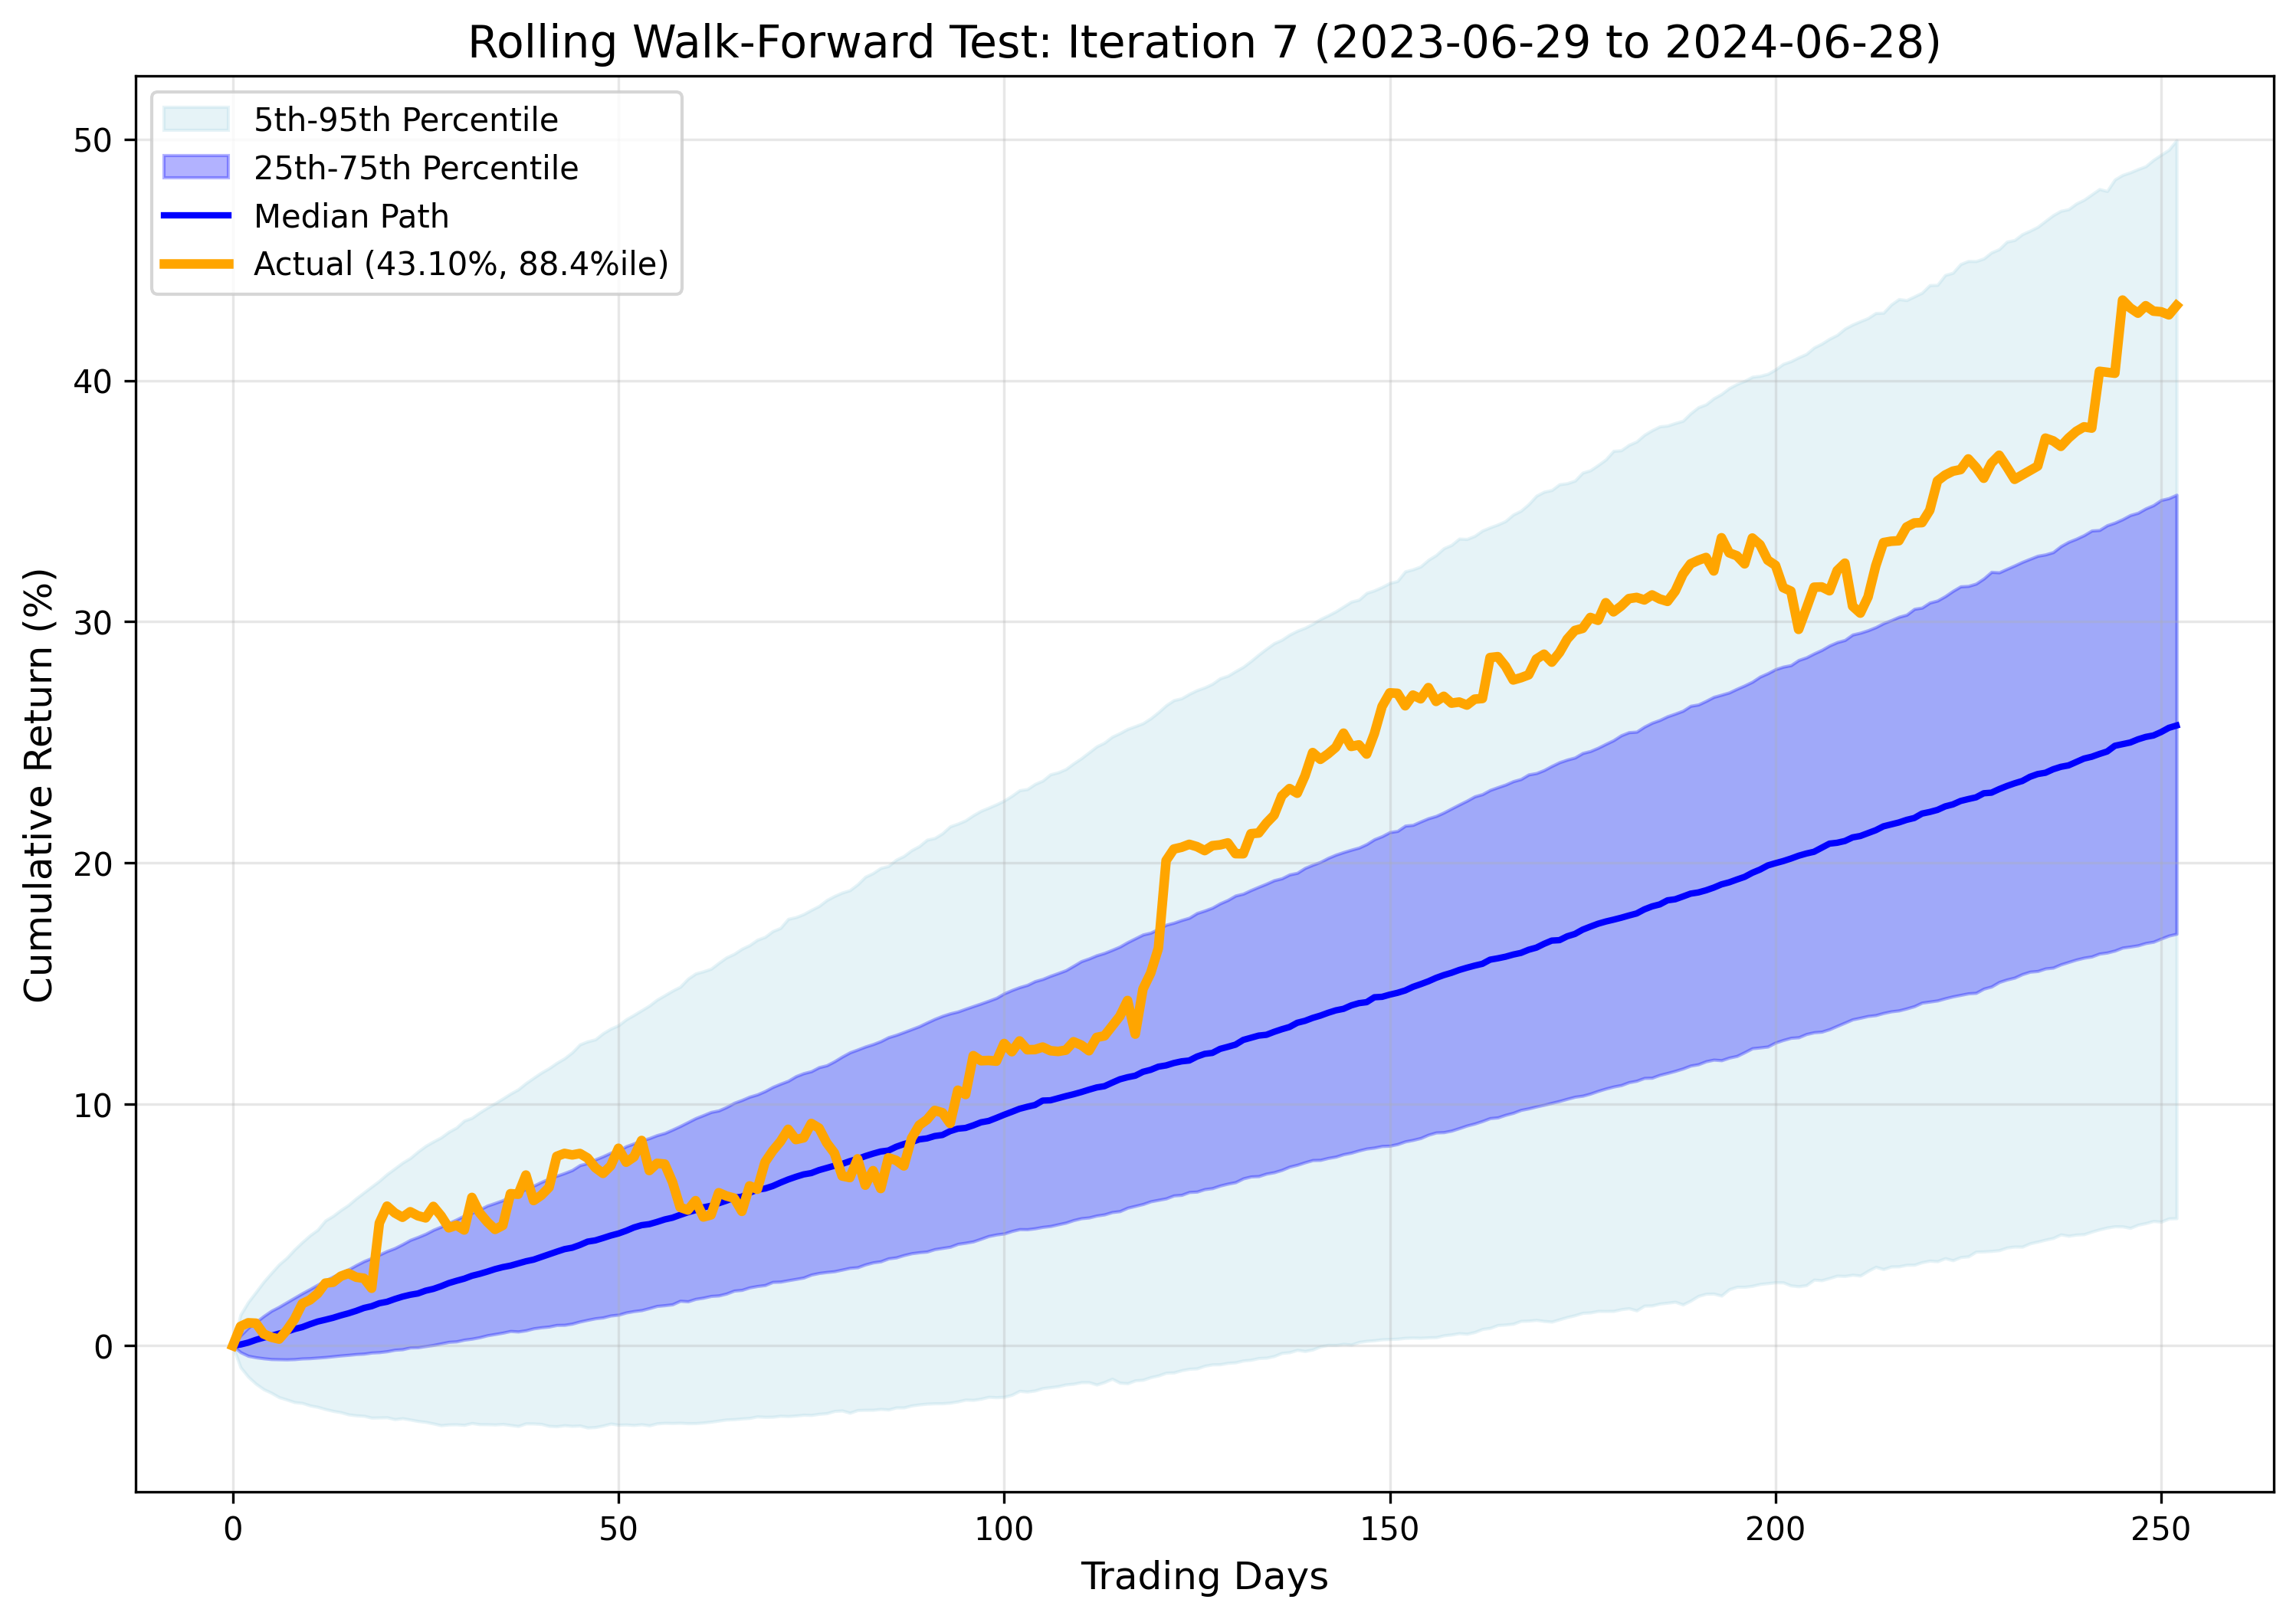
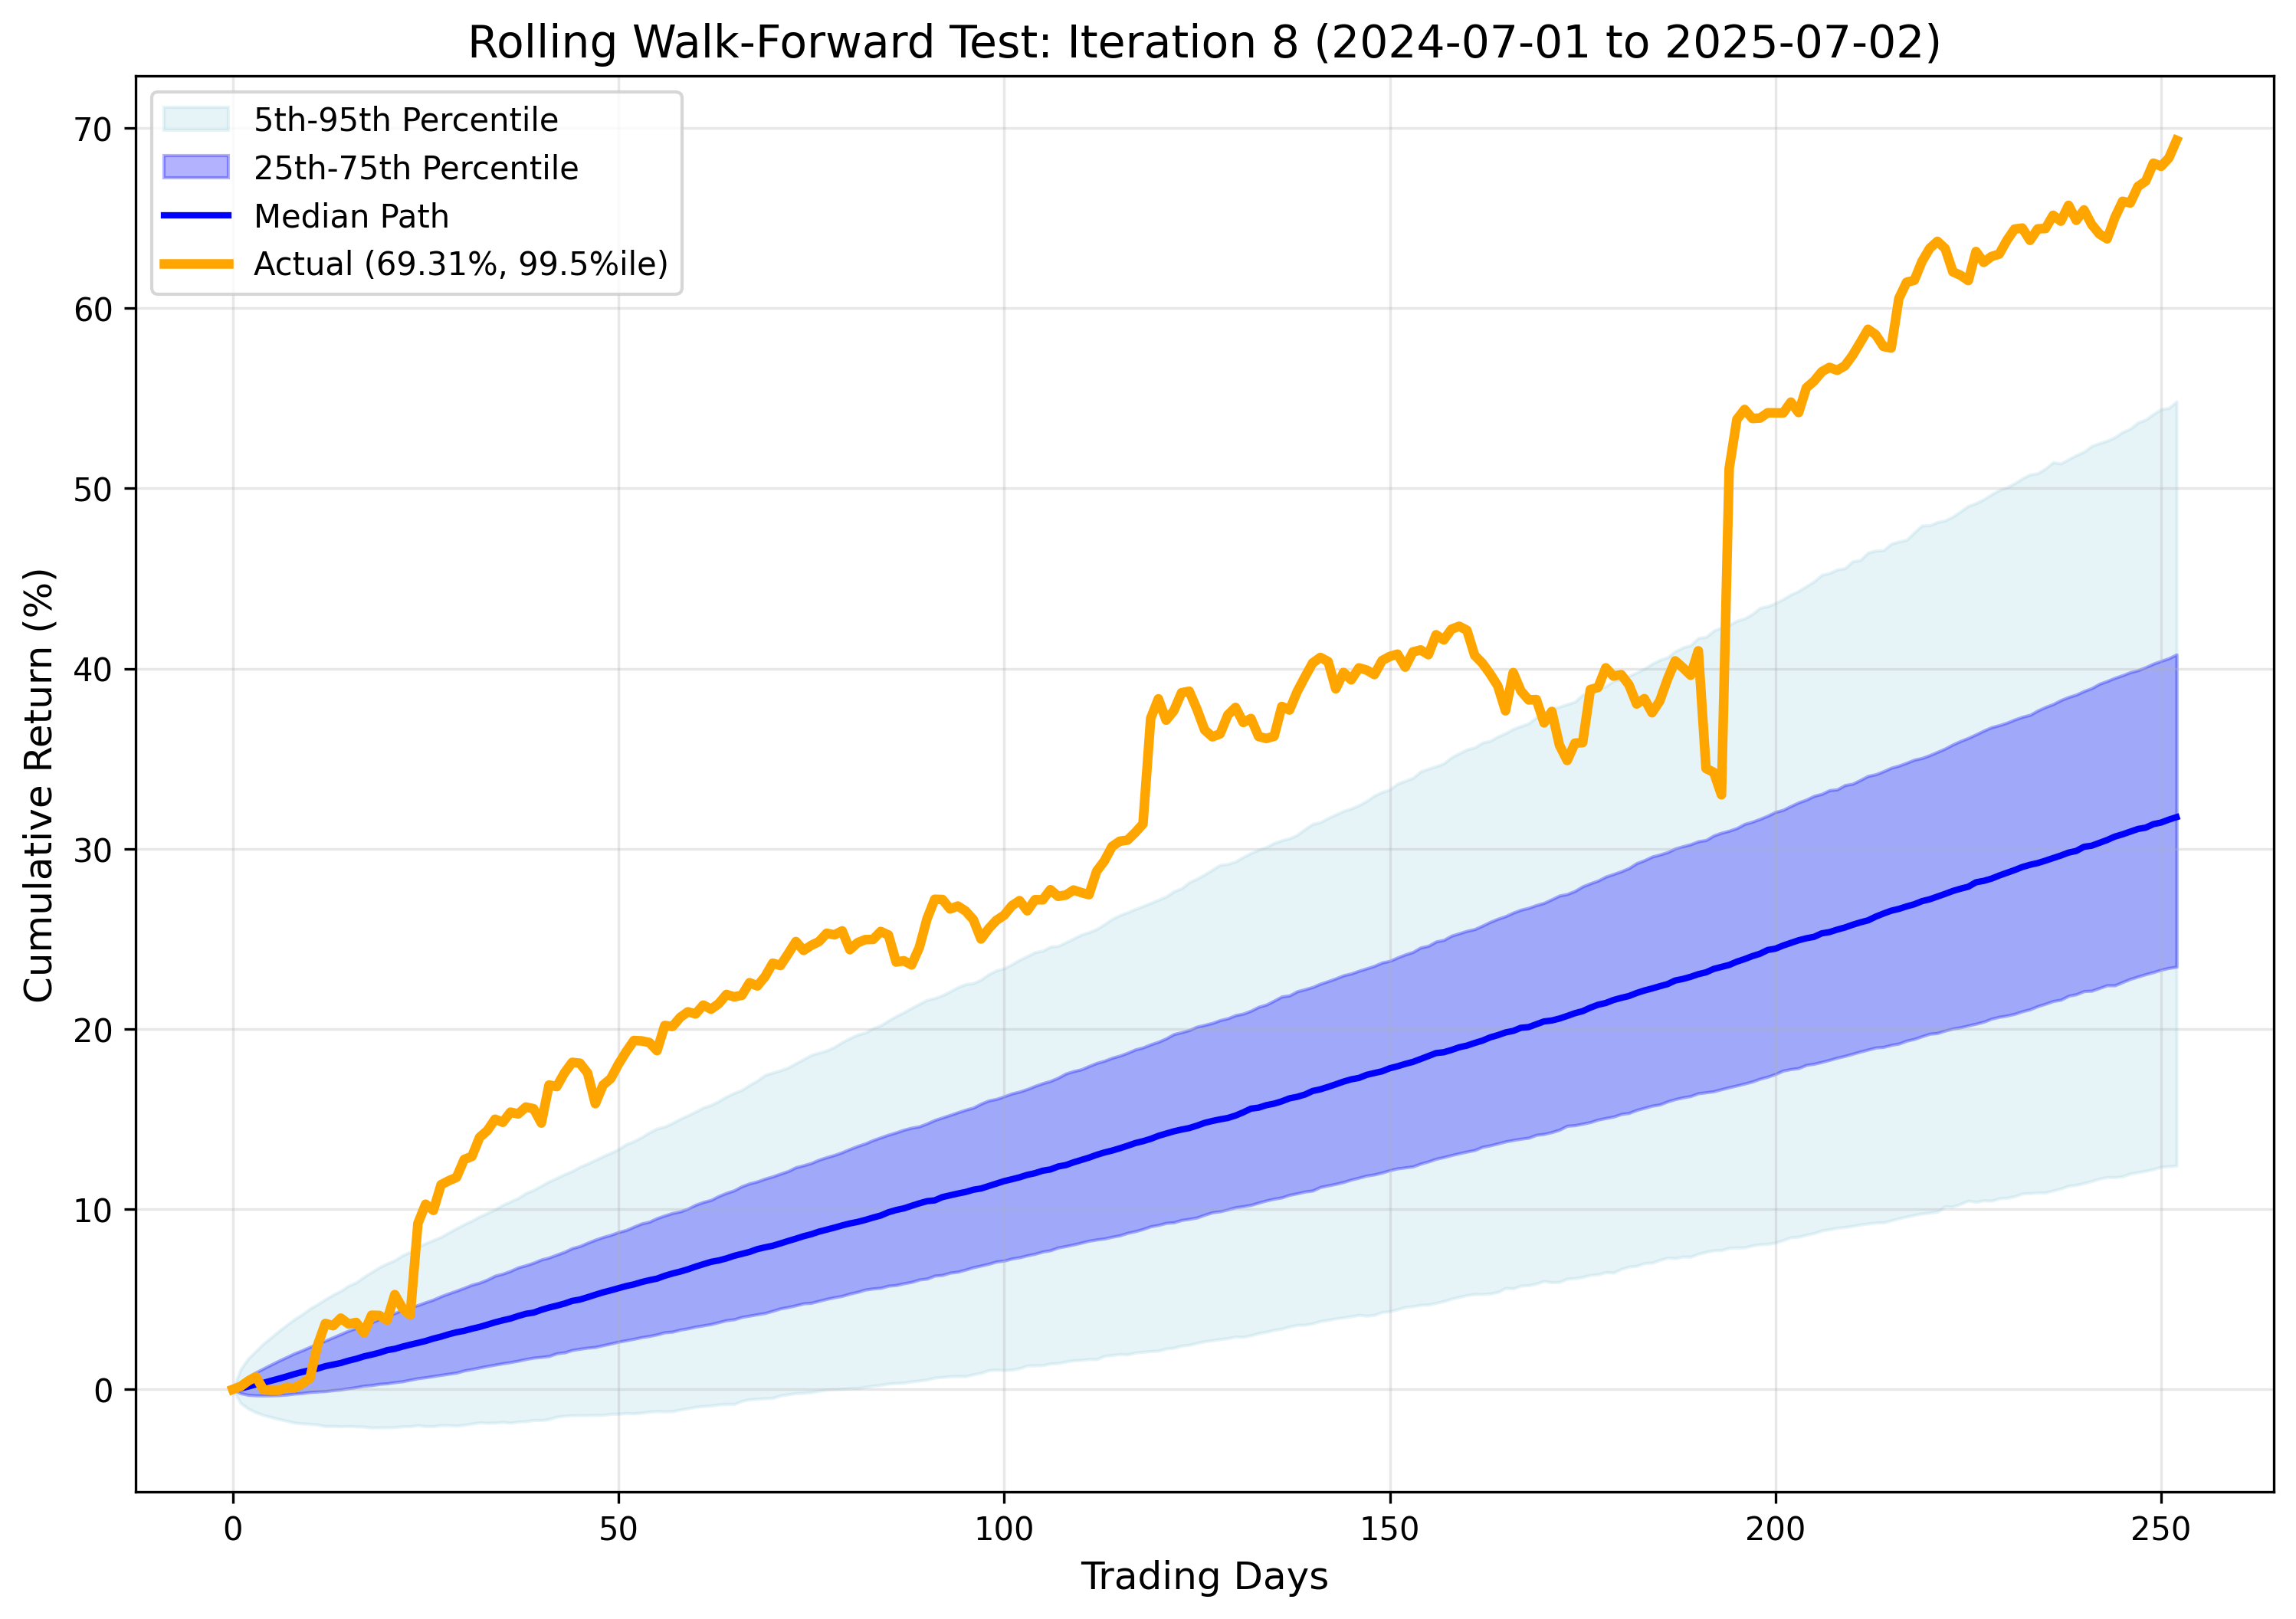
Monte Carlo robustness analysis to evaluate strategy's performance predictability using 10,000 simulations per test period within a rolling walk-forward framework
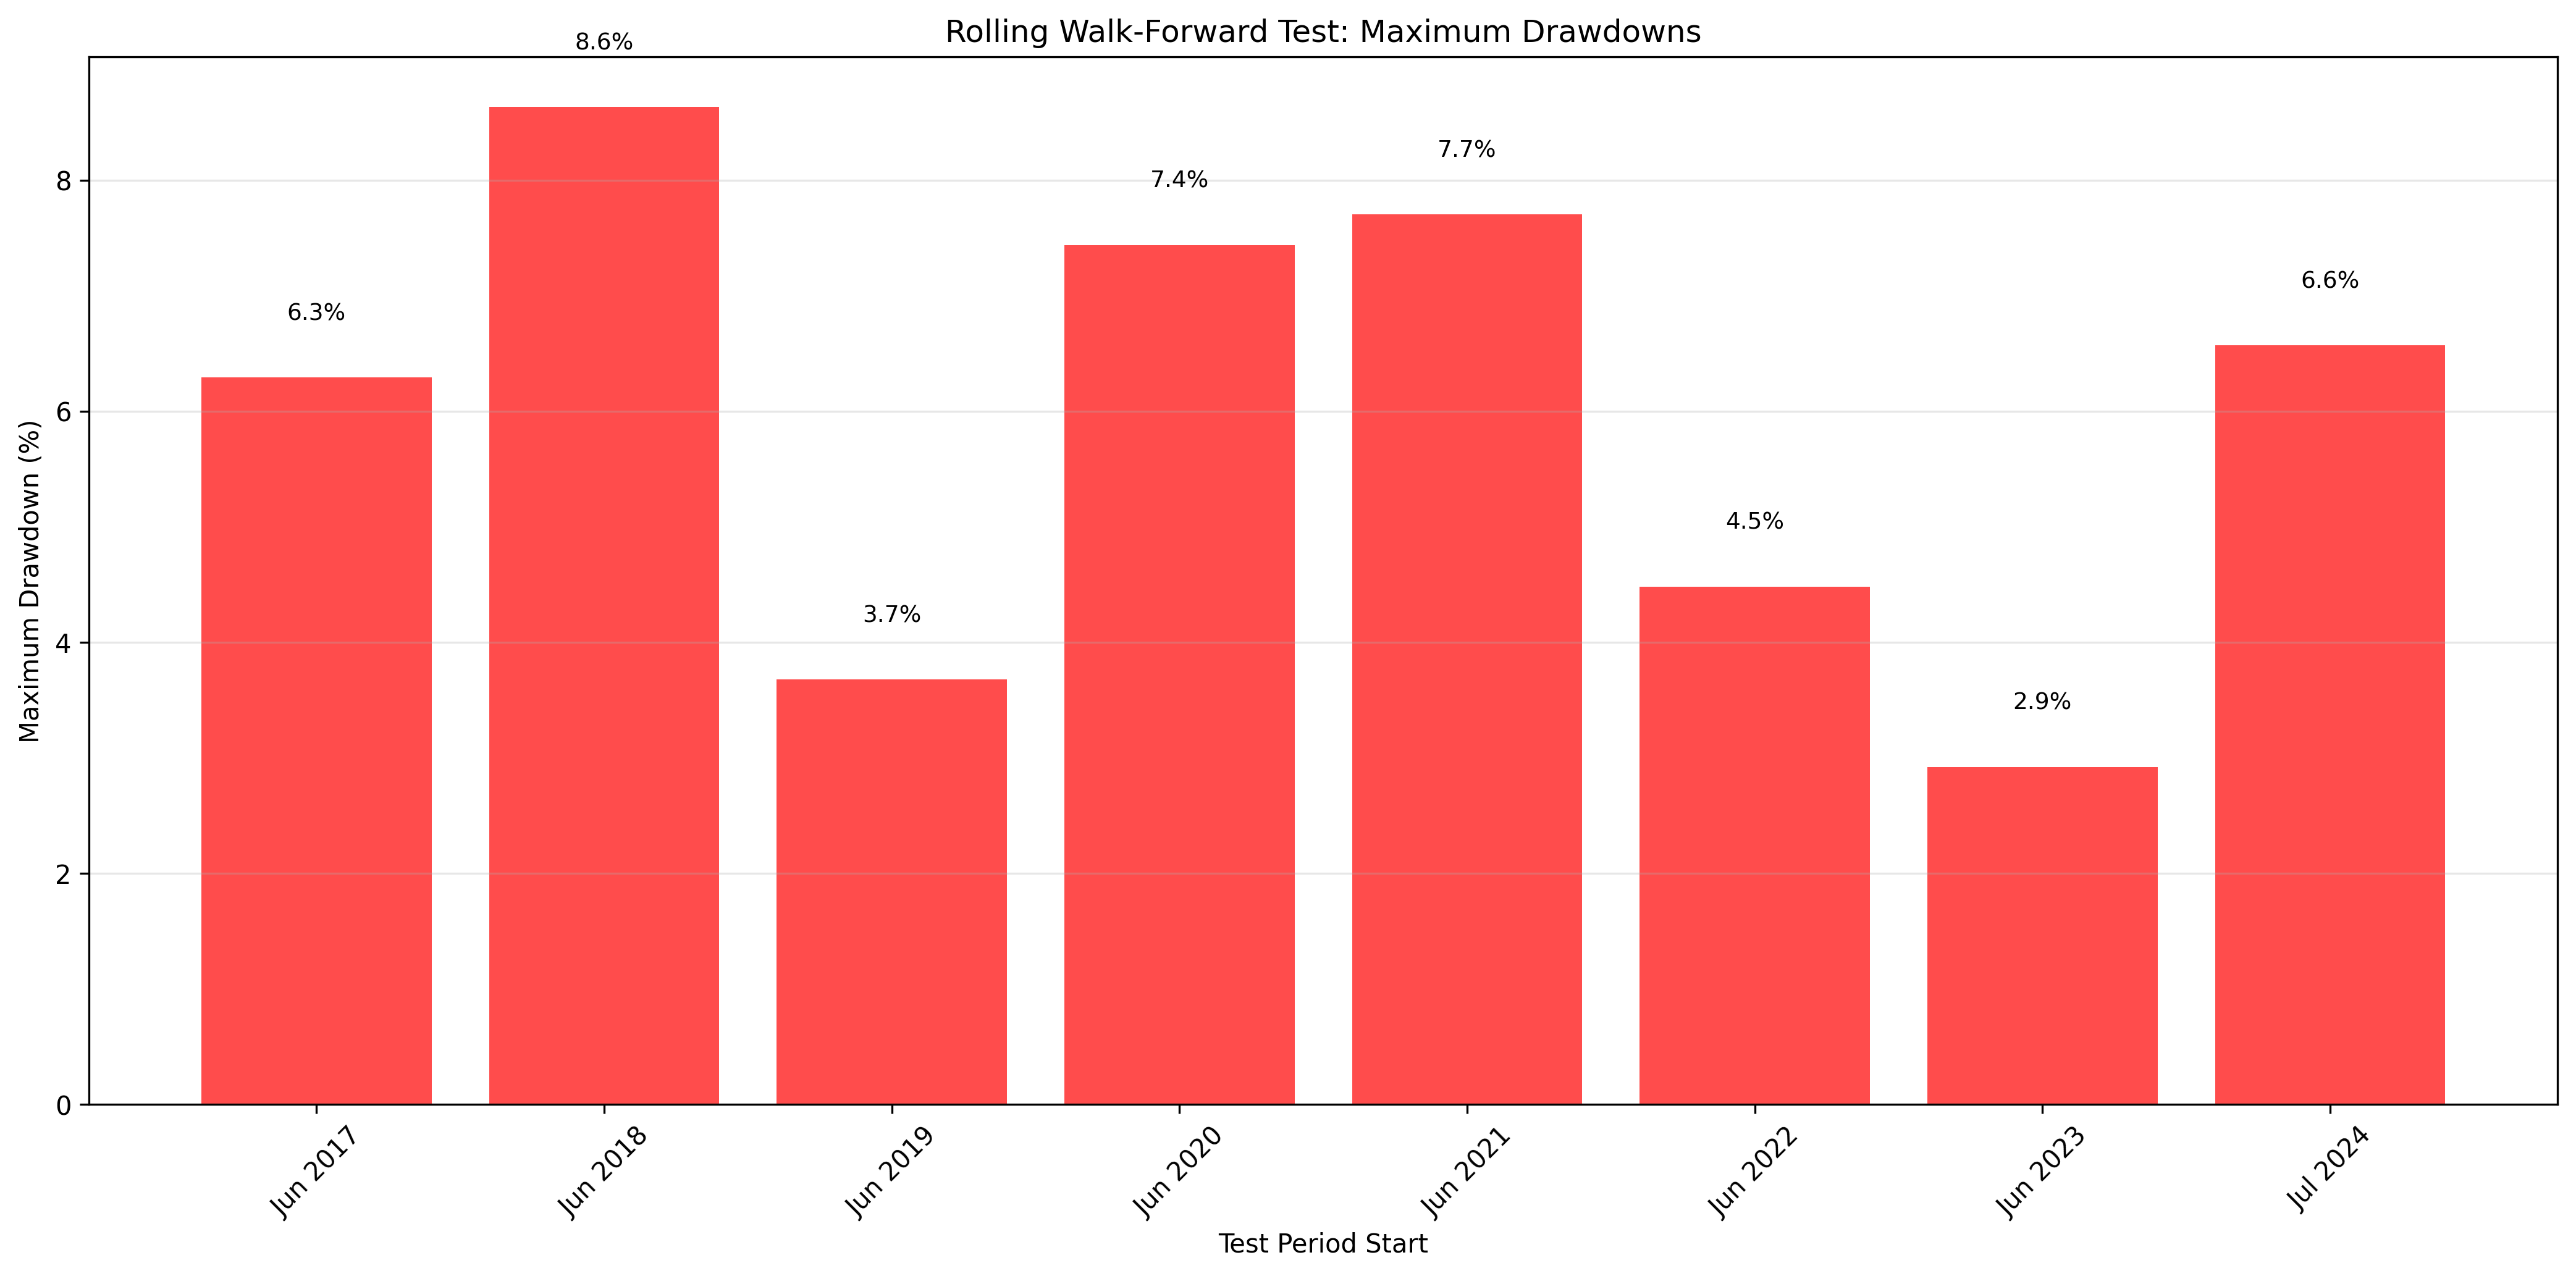
The Walk-Forward Analysis confirms that the edge is robust across regimes, not just an artifact of overfitting. Across 8 distinct walk-forward windows, the strategy never produced a negative return period.
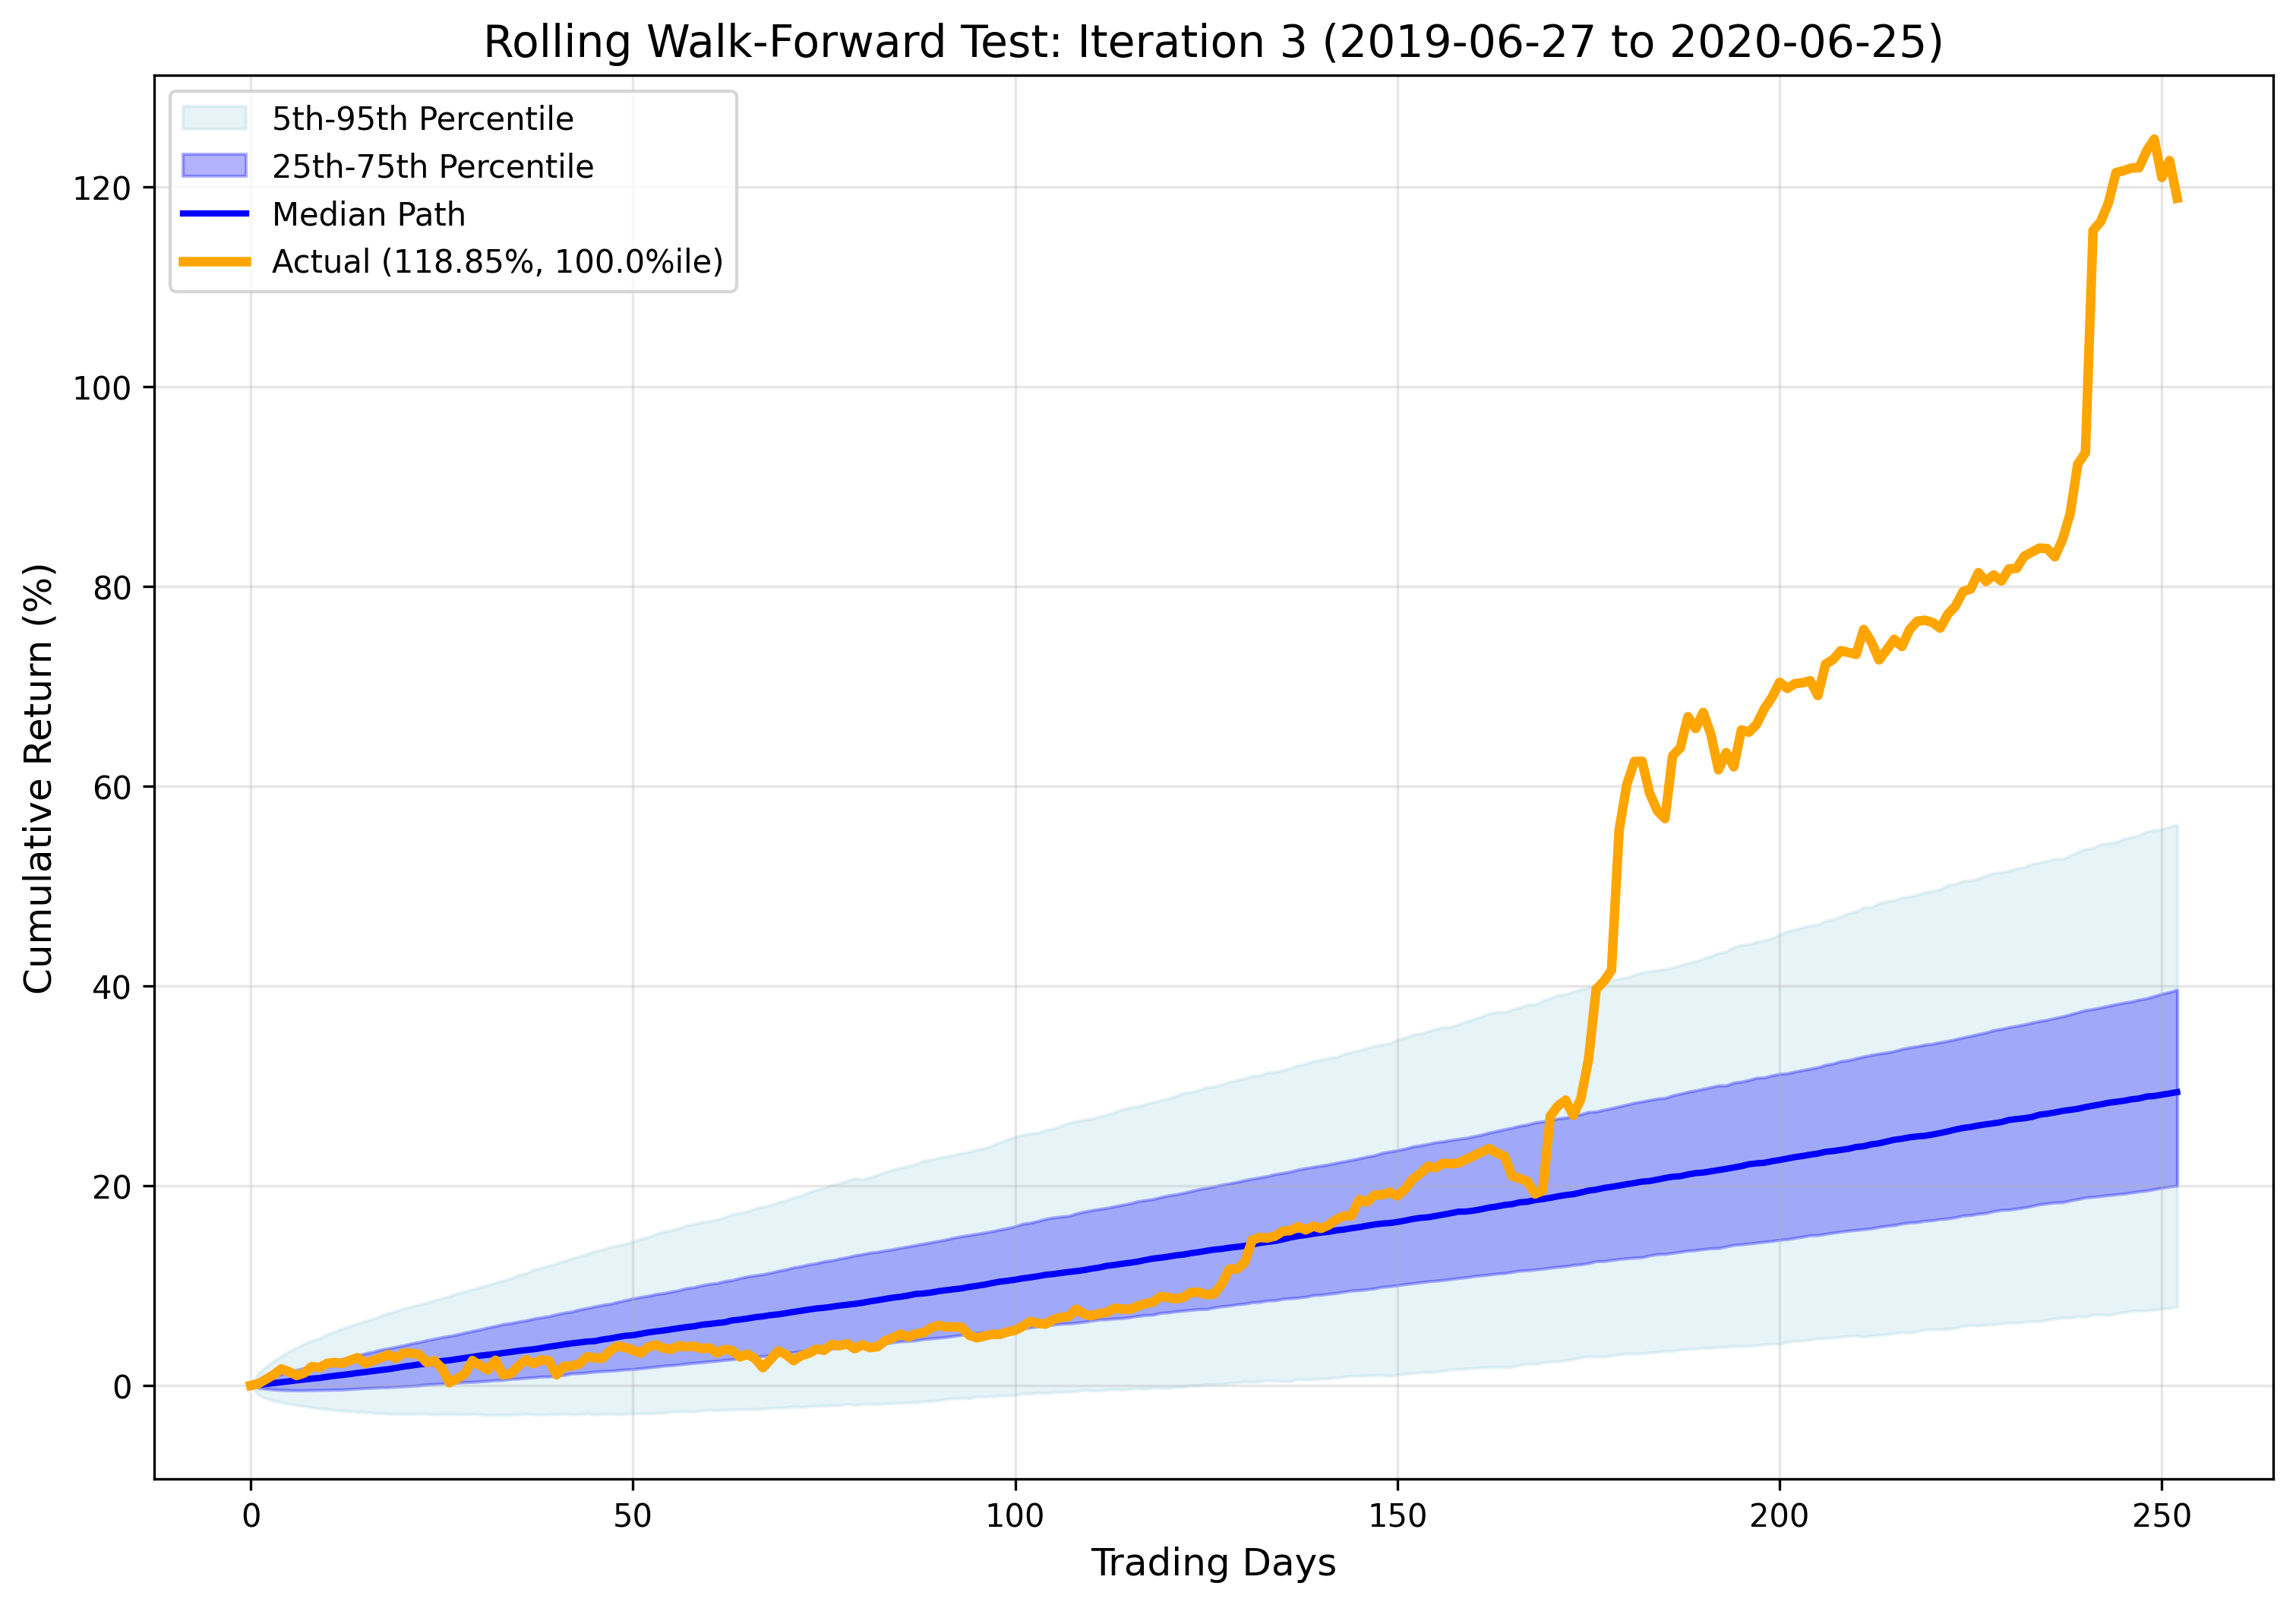
The high positive Skew and Kurtosis confirm that the strategy utilizes “crisis alpha.” While the general market crashes (left-tail risk), this strategy captures right-tail outliers (extreme positive gains).
NOTE: This strategy is intentionally designed to capture outlier returns during specific market conditions. Following the periods of exceptional performance, Monte Carlo forecasts may appear overly optimistic in subsequent iterations, consequently making the strategy appear to underperform during those iterations. This is expected behavior as the simulations incorporate recent extreme returns into their probability distributions.
| Rank | Trading Days | Calendar Days | Max Drawdown | Start Date | End Date |
|---|---|---|---|---|---|
| 1 | 56 | 80 | 6.29% | 2018-03-12 | 2018-05-31 |
| 2 | 32 | 44 | 2.11% | 2017-09-12 | 2017-10-26 |
| 3 | 20 | 32 | 2.01% | 2017-12-01 | 2018-01-02 |
| Rank | Trading Days | Calendar Days | Max Drawdown | Start Date | End Date |
|---|---|---|---|---|---|
| 1 | 38 | 58 | 8.63% | 2018-12-03 | 2019-01-30 |
| 2 | 24 | 35 | 4.67% | 2019-05-03 | 2019-06-07 |
| 3 | 30 | 45 | 3.40% | 2018-08-31 | 2018-10-15 |
| 4 | 22 | 31 | 2.81% | 2018-10-30 | 2018-11-30 |
| Rank | Trading Days | Calendar Days | Max Drawdown | Start Date | End Date |
|---|---|---|---|---|---|
| 1 | 26 | 39 | 2.89% | 2019-07-26 | 2019-09-03 |
| 2 | 22 | 32 | 2.20% | 2019-09-12 | 2019-10-14 |
| Rank | Trading Days | Calendar Days | Max Drawdown | Start Date | End Date |
|---|---|---|---|---|---|
| 1 | 38 | 53 | 7.44% | 2020-10-12 | 2020-12-04 |
| 2 | 25 | 36 | 7.33% | 2020-09-03 | 2020-10-09 |
| Rank | Trading Days | Calendar Days | Max Drawdown | Start Date | End Date |
|---|---|---|---|---|---|
| 1 | 61 | 87 | 7.70% | 2021-12-27 | 2022-03-24 |
| 2 | 21 | 32 | 3.80% | 2021-11-19 | 2021-12-21 |
| 3 | 20 | 29 | 3.38% | 2022-03-29 | 2022-04-27 |
| 4 | 27 | 40 | 2.64% | 2021-09-03 | 2021-10-13 |
| Rank | Trading Days | Calendar Days | Max Drawdown | Start Date | End Date |
|---|---|---|---|---|---|
| 1 | 41 | 58 | 3.93% | 2022-08-16 | 2022-10-13 |
| 2 | 38 | 55 | 3.78% | 2023-02-02 | 2023-03-29 |
| 3 | 29 | 43 | 3.69% | 2022-11-30 | 2023-01-12 |
| Rank | Trading Days | Calendar Days | Max Drawdown | Start Date | End Date |
|---|---|---|---|---|---|
| 1 | 18 | 26 | 2.92% | 2023-09-14 | 2023-10-10 |
| 2 | 23 | 33 | 2.84% | 2024-04-05 | 2024-05-08 |
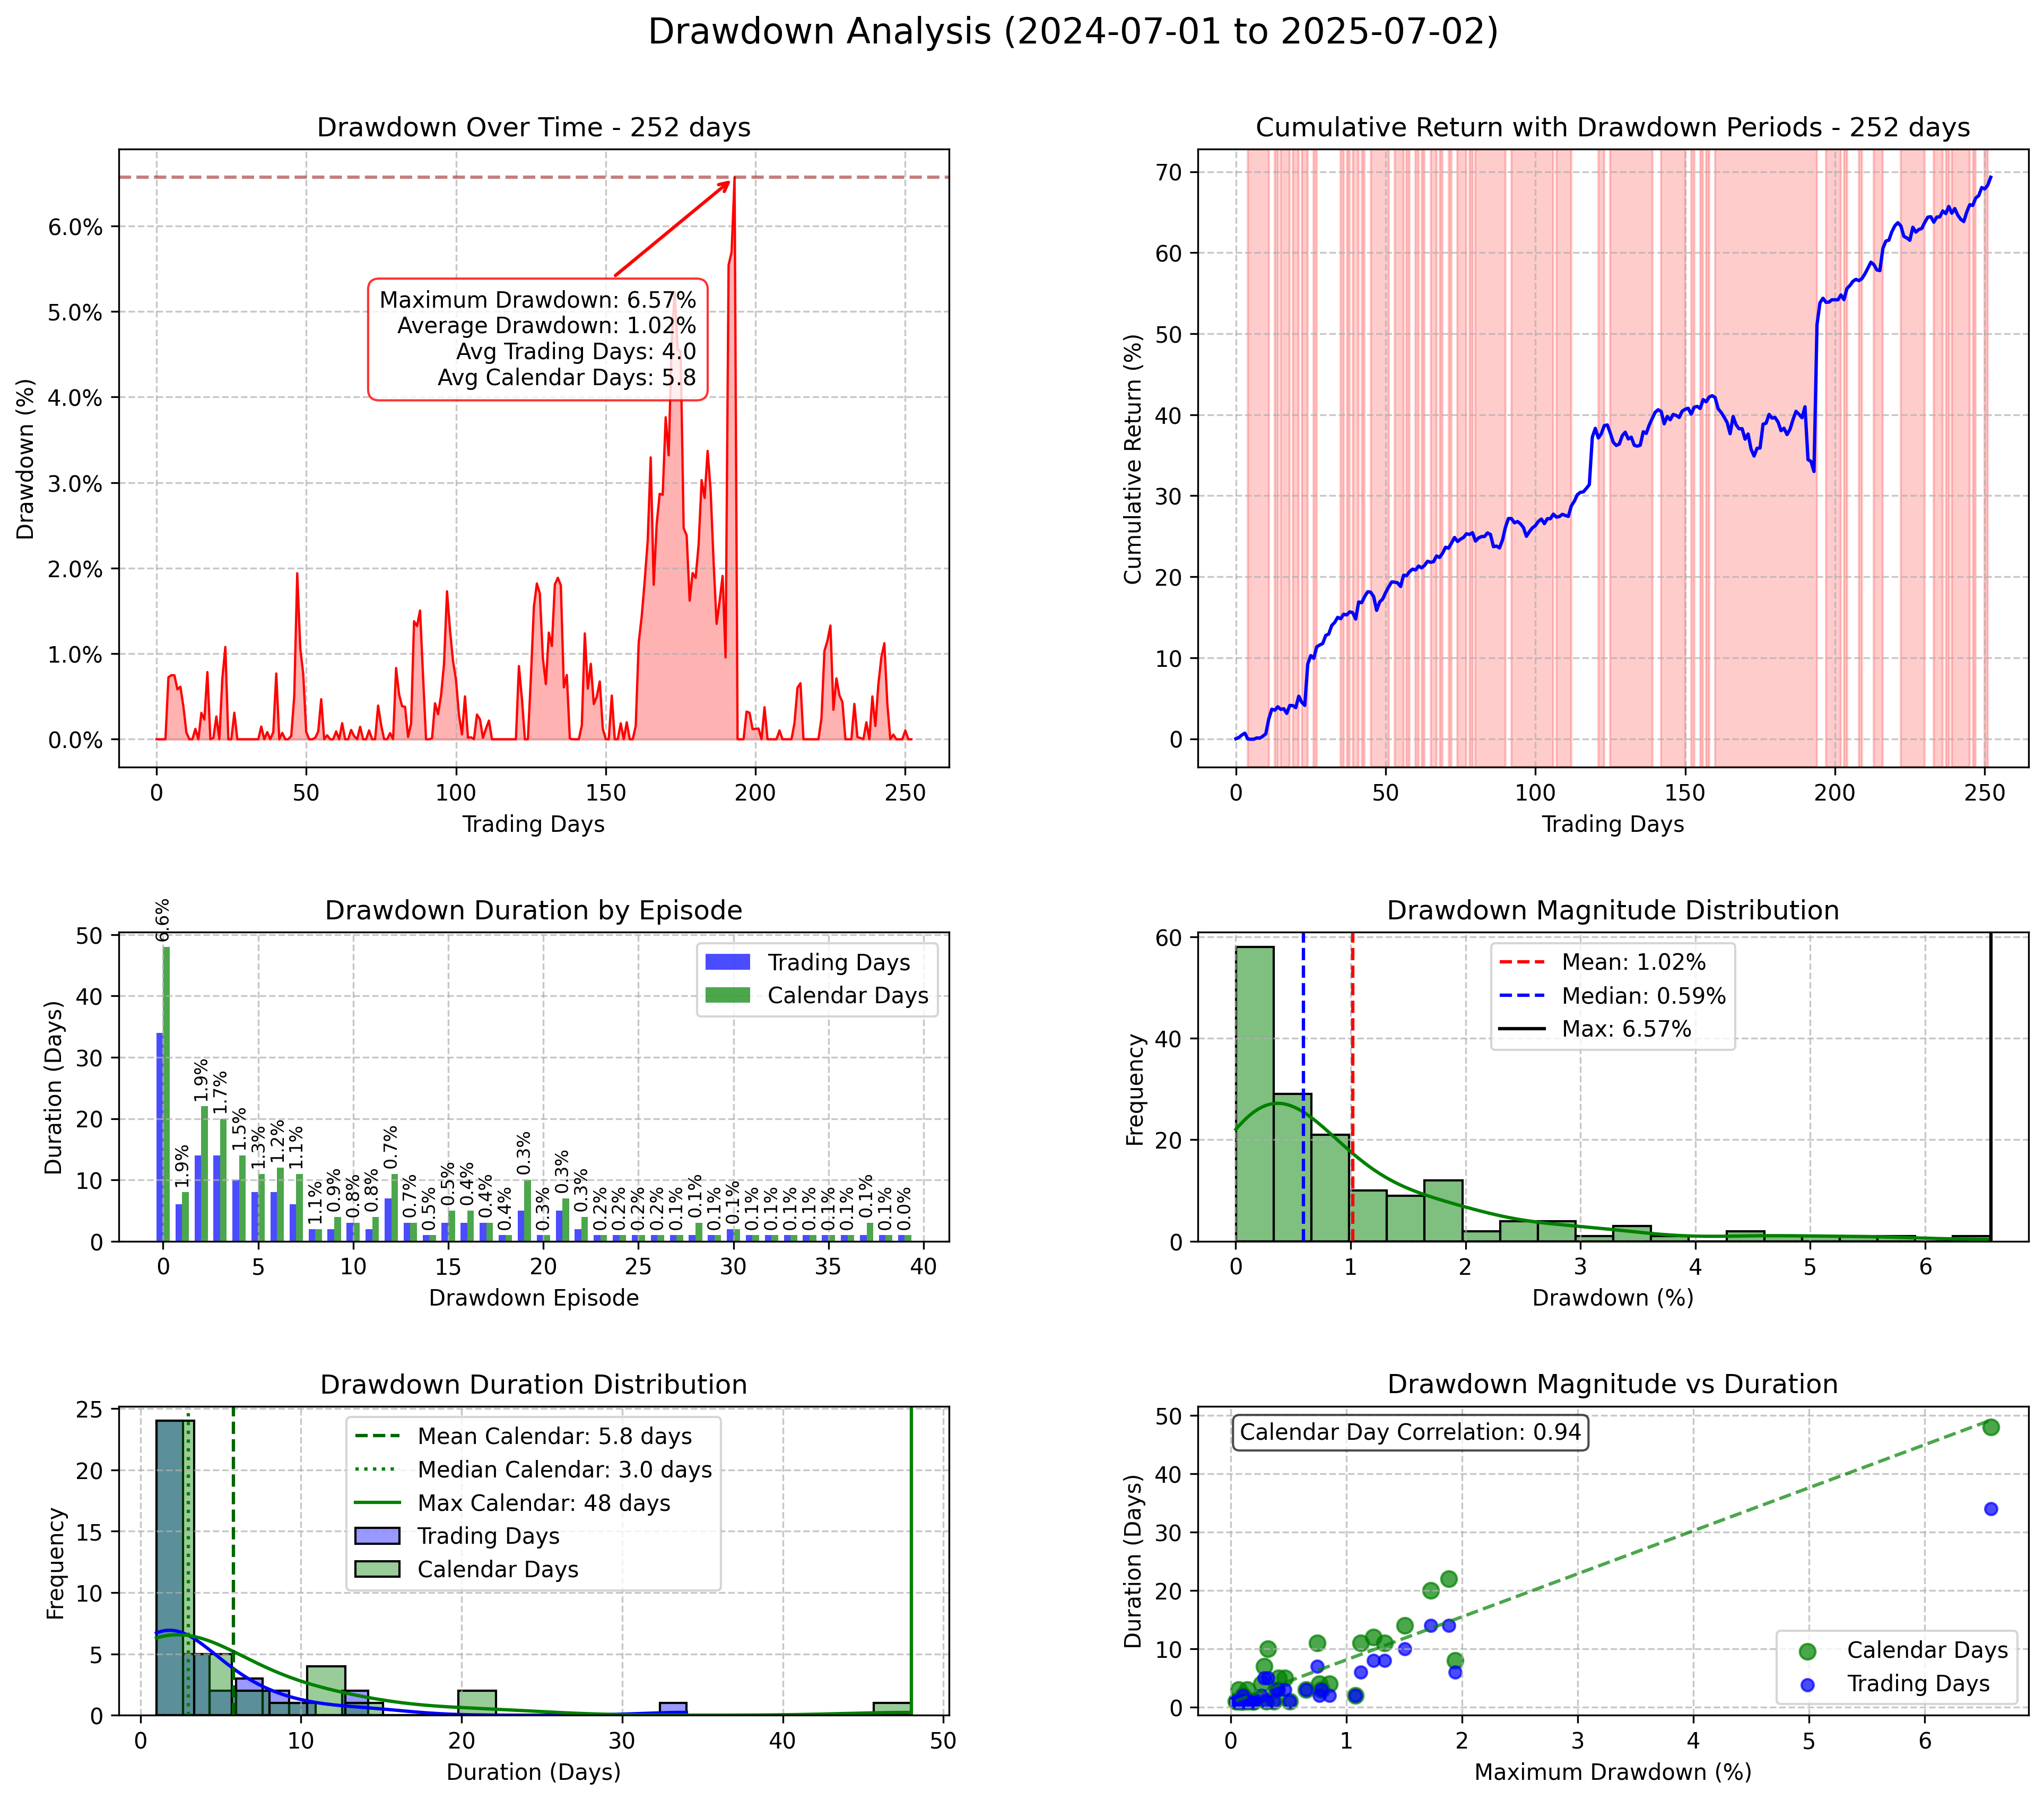
| Rank | Trading Days | Calendar Days | Max Drawdown | Start Date | End Date |
|---|---|---|---|---|---|
| 1 | 34 | 48 | 6.57% | 2025-02-19 | 2025-04-08 |
| 2 | 14 | 22 | 1.89% | 2024-12-26 | 2025-01-17 |
| Metric | Value |
|---|---|
| Average Actual Return | 49.74% |
| Average Forecast Return | 42.17% |
| Average Error | 7.57% |
| Average Percentile | 54.8% |
| Average Max Drawdown | 5.97% |
| Average Actual CAGR | 49.74% |
| Average Forecast CAGR | 42.17% |

Please wait while we get Zehnvisor on the line for you...