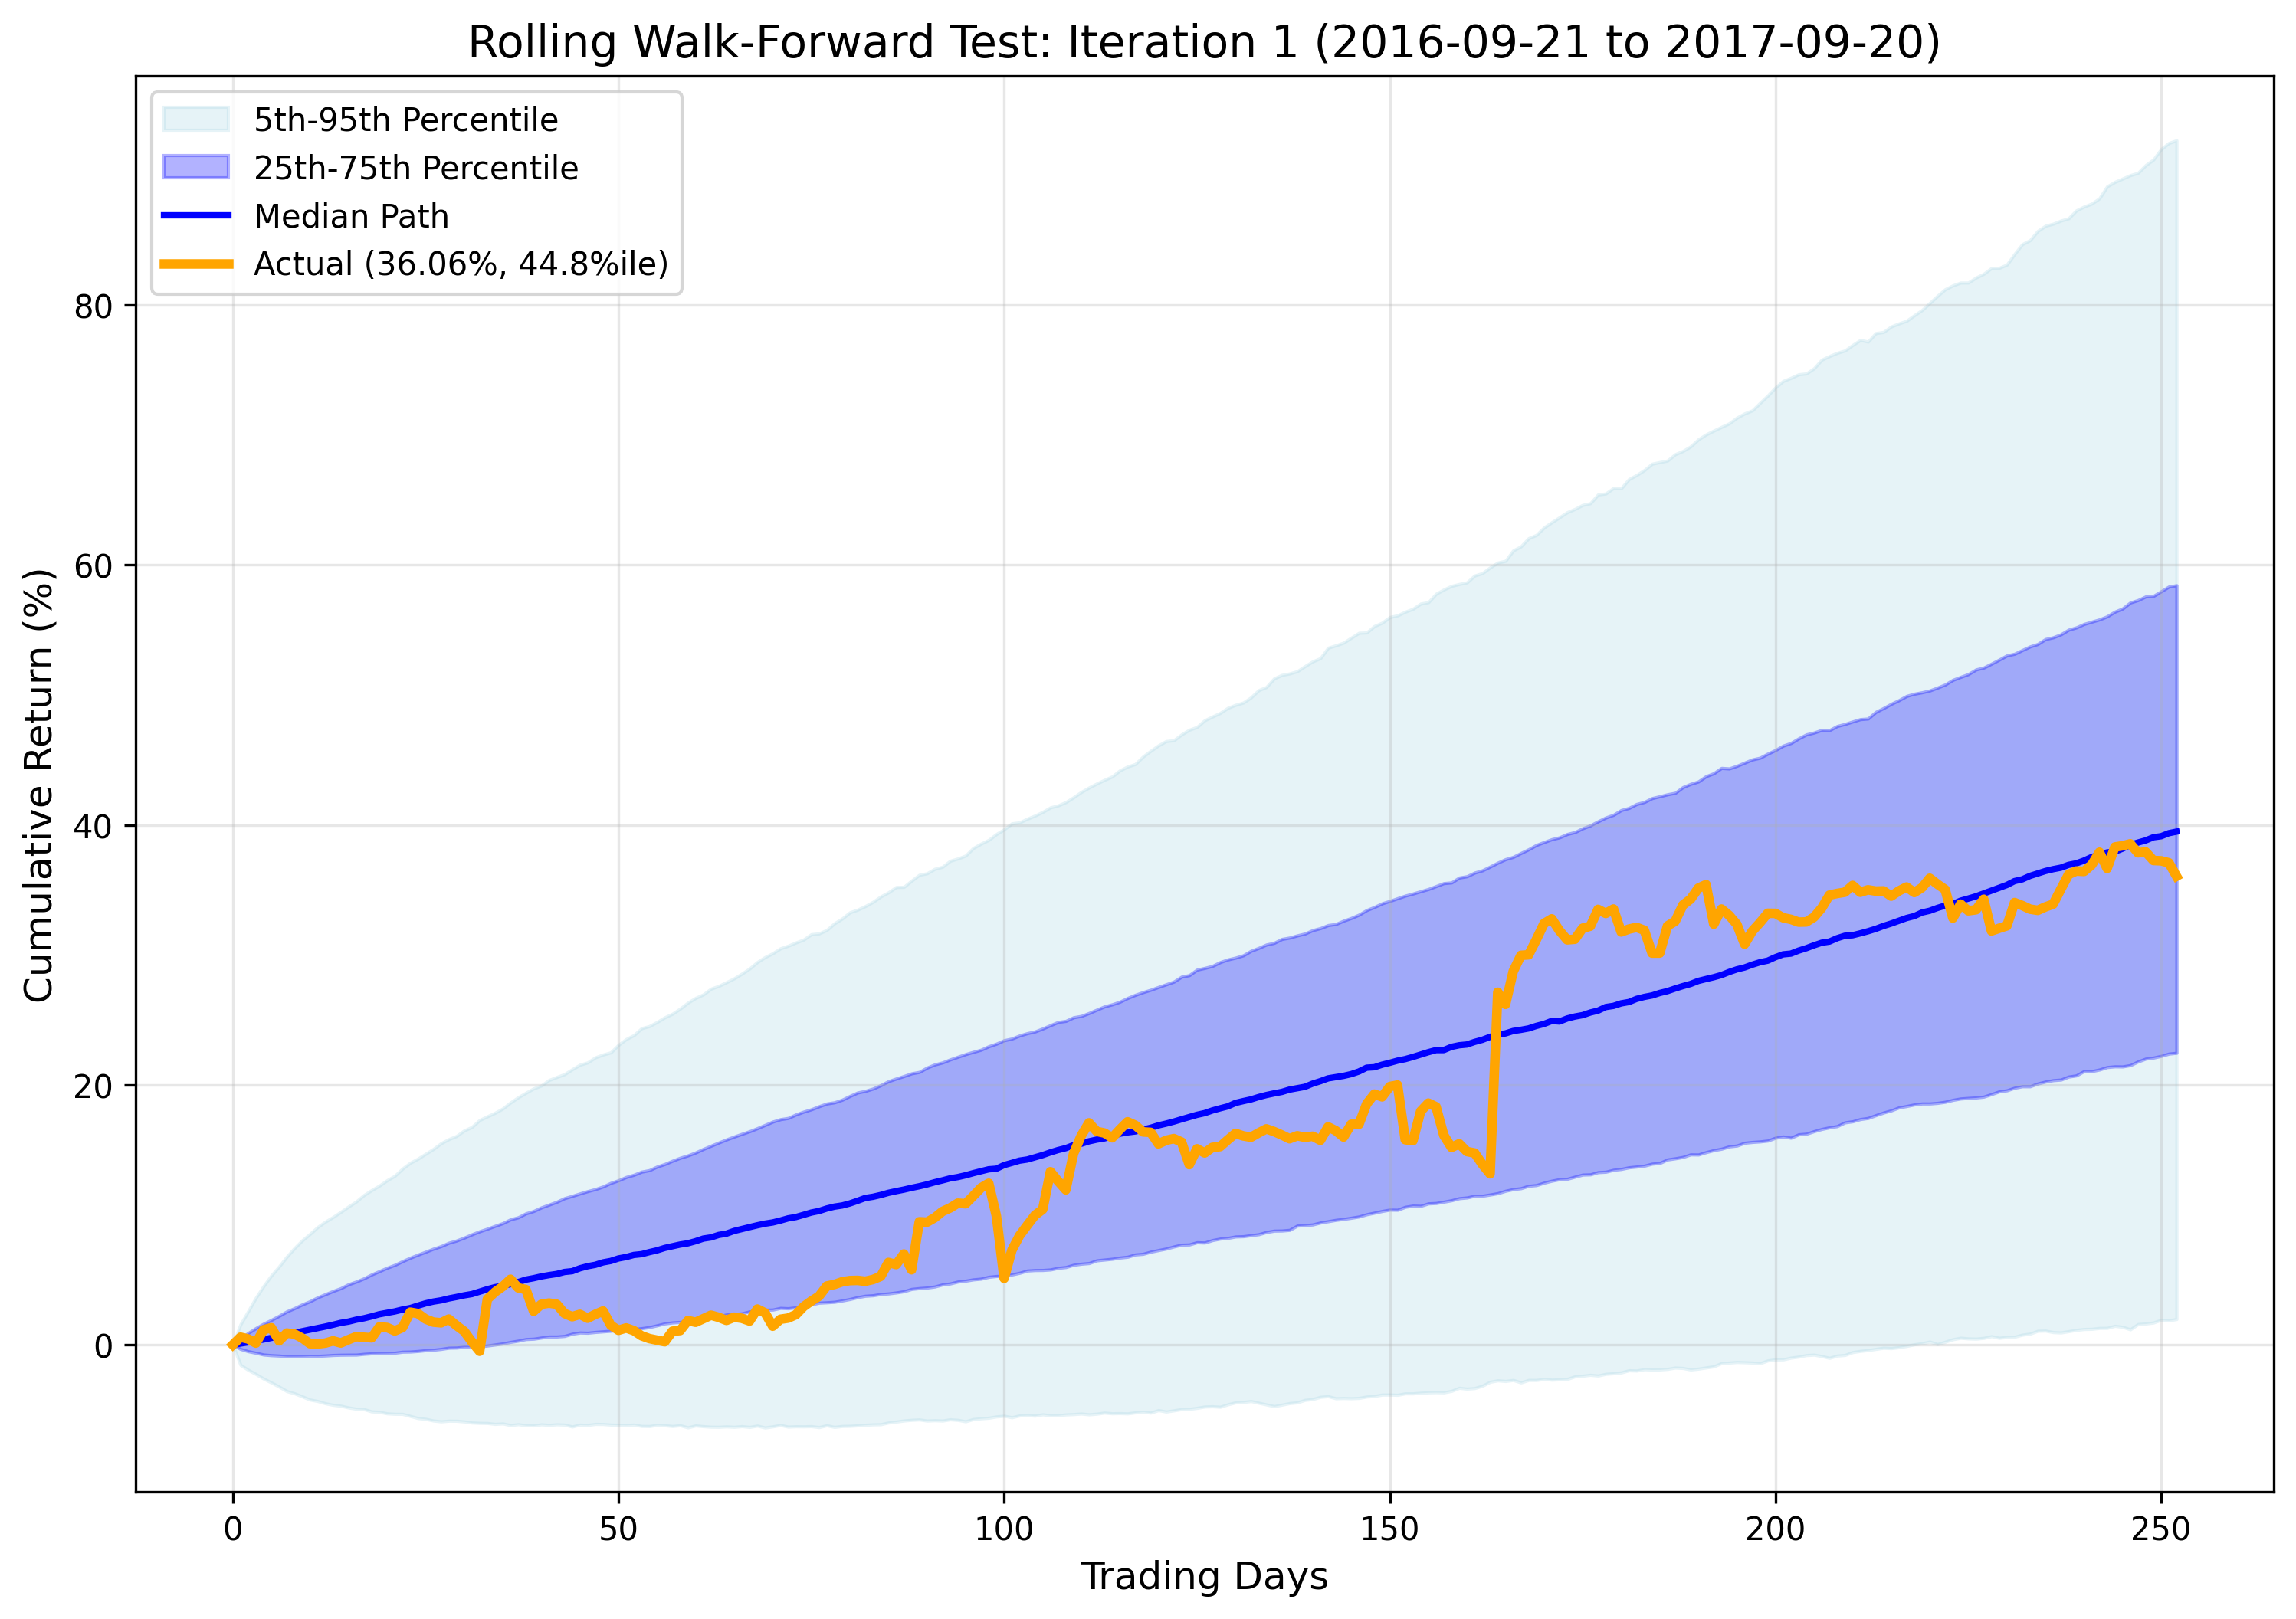
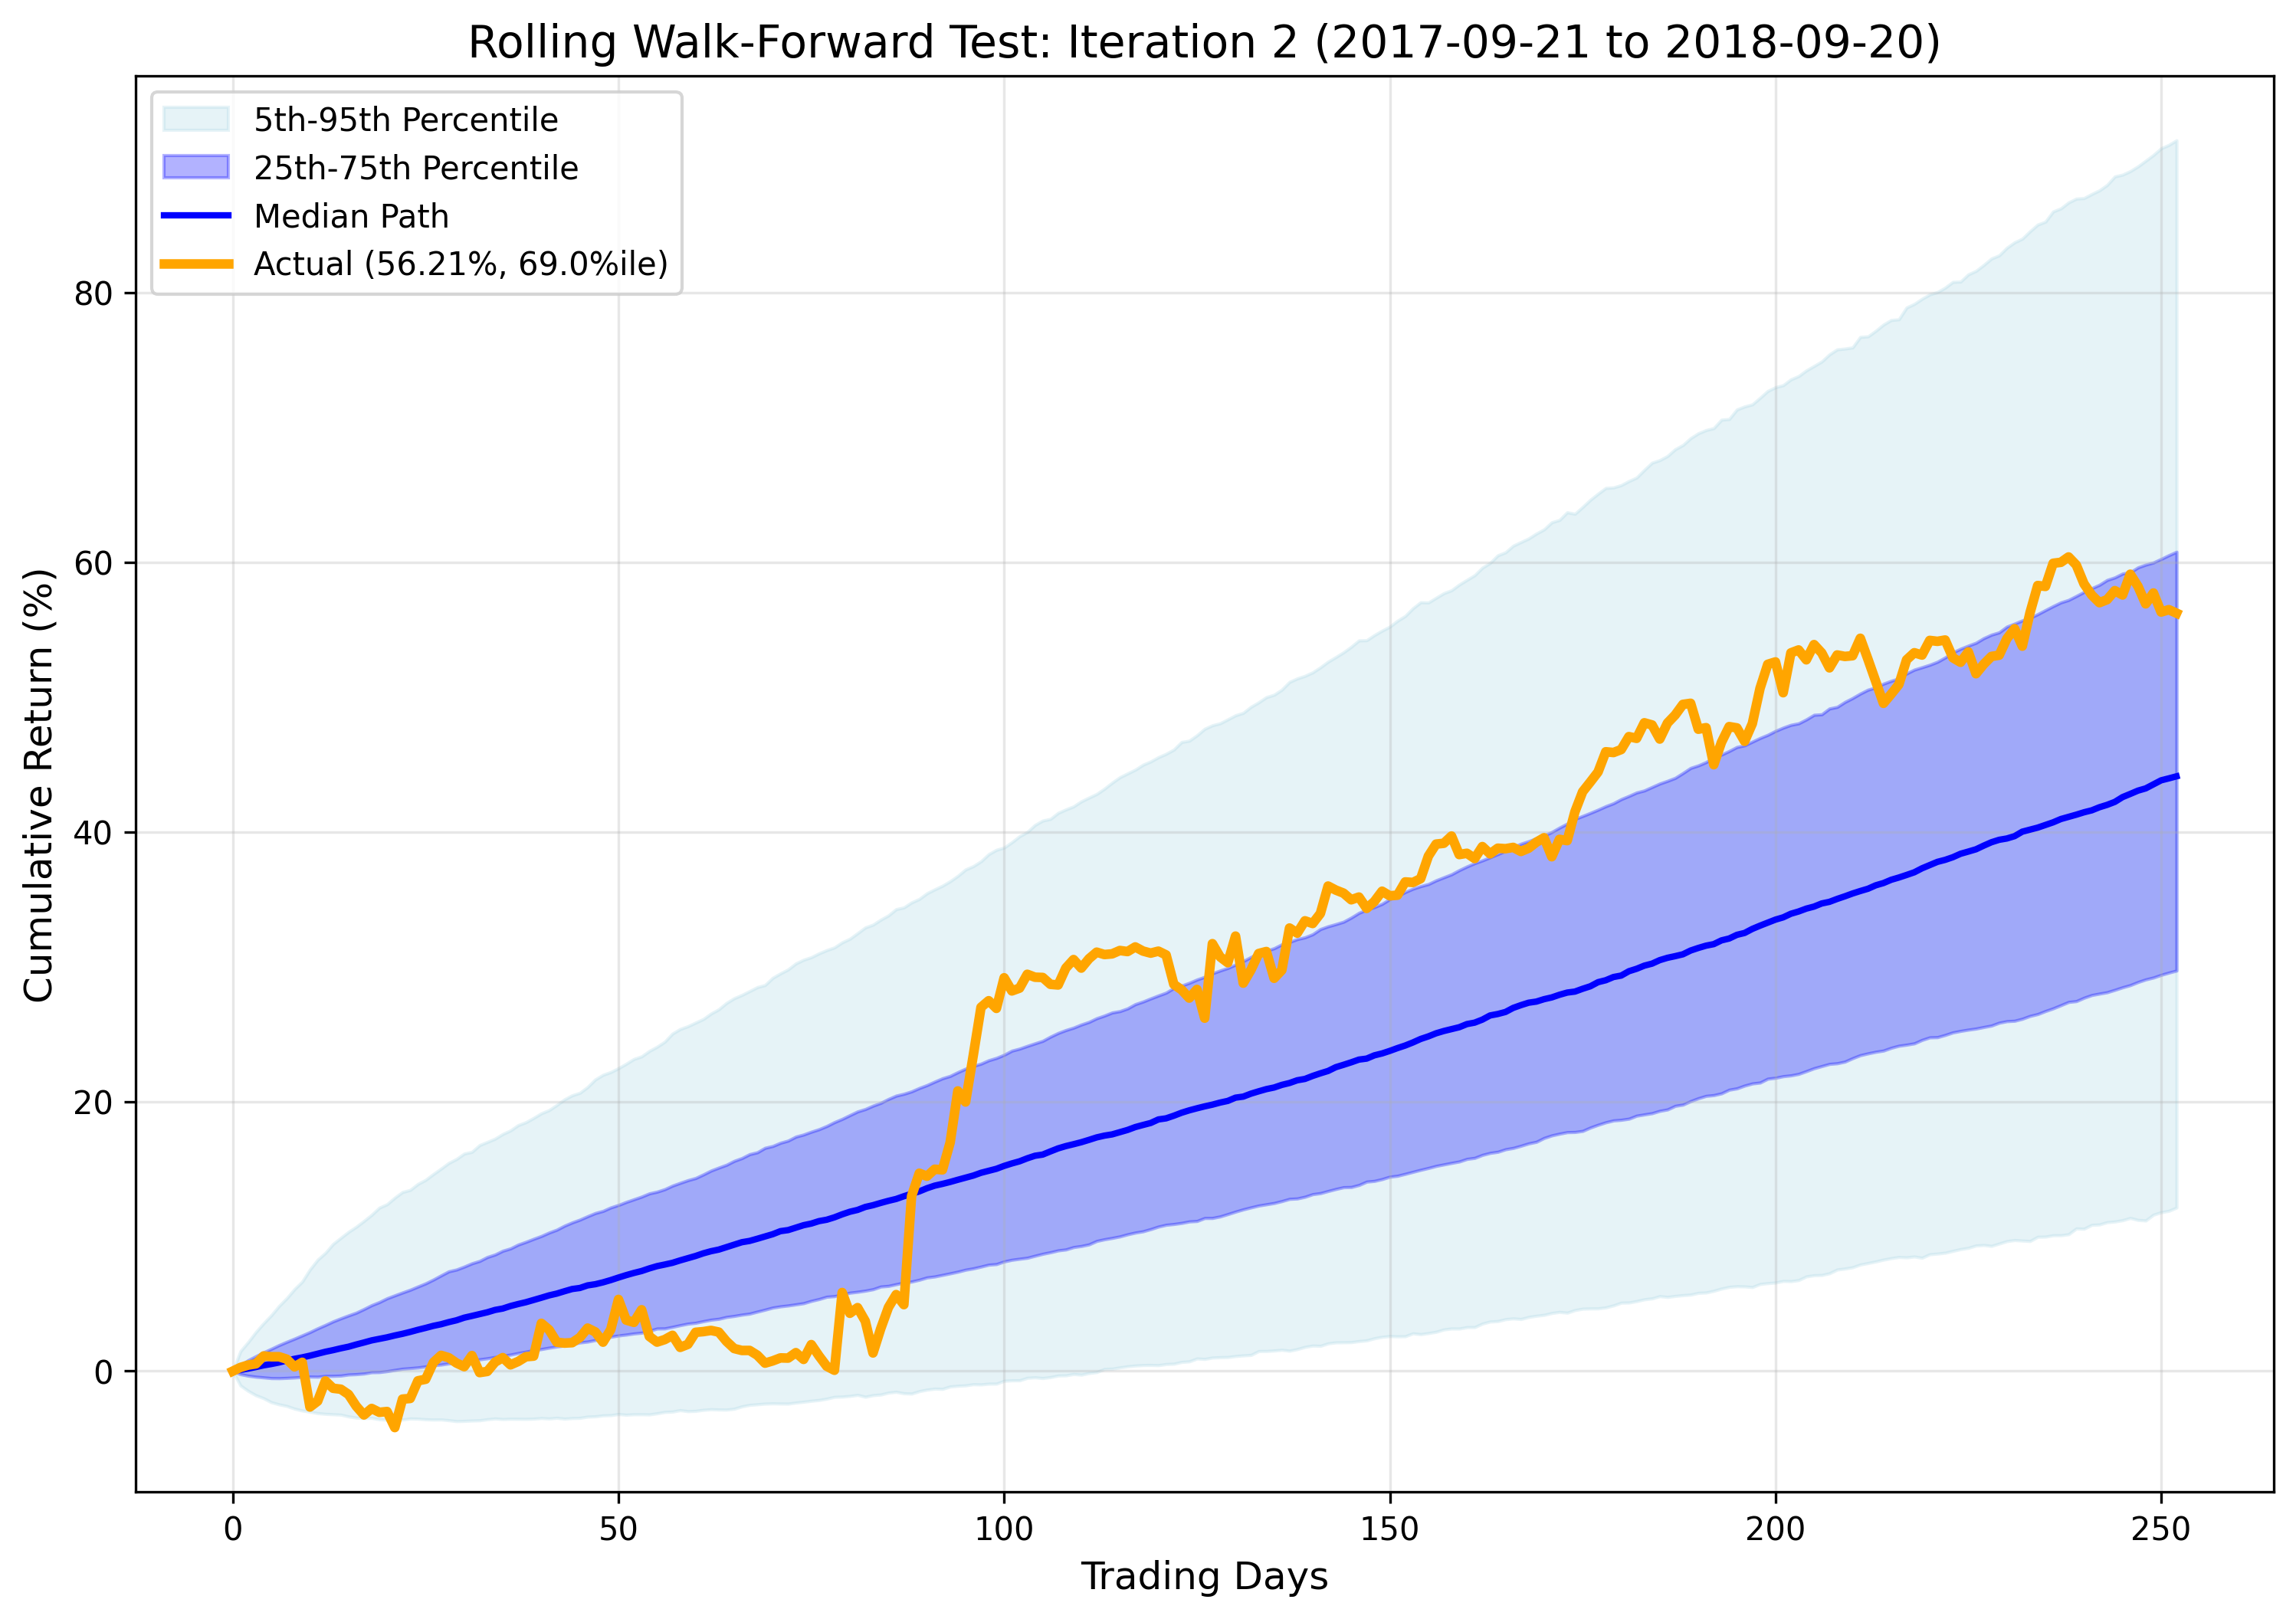
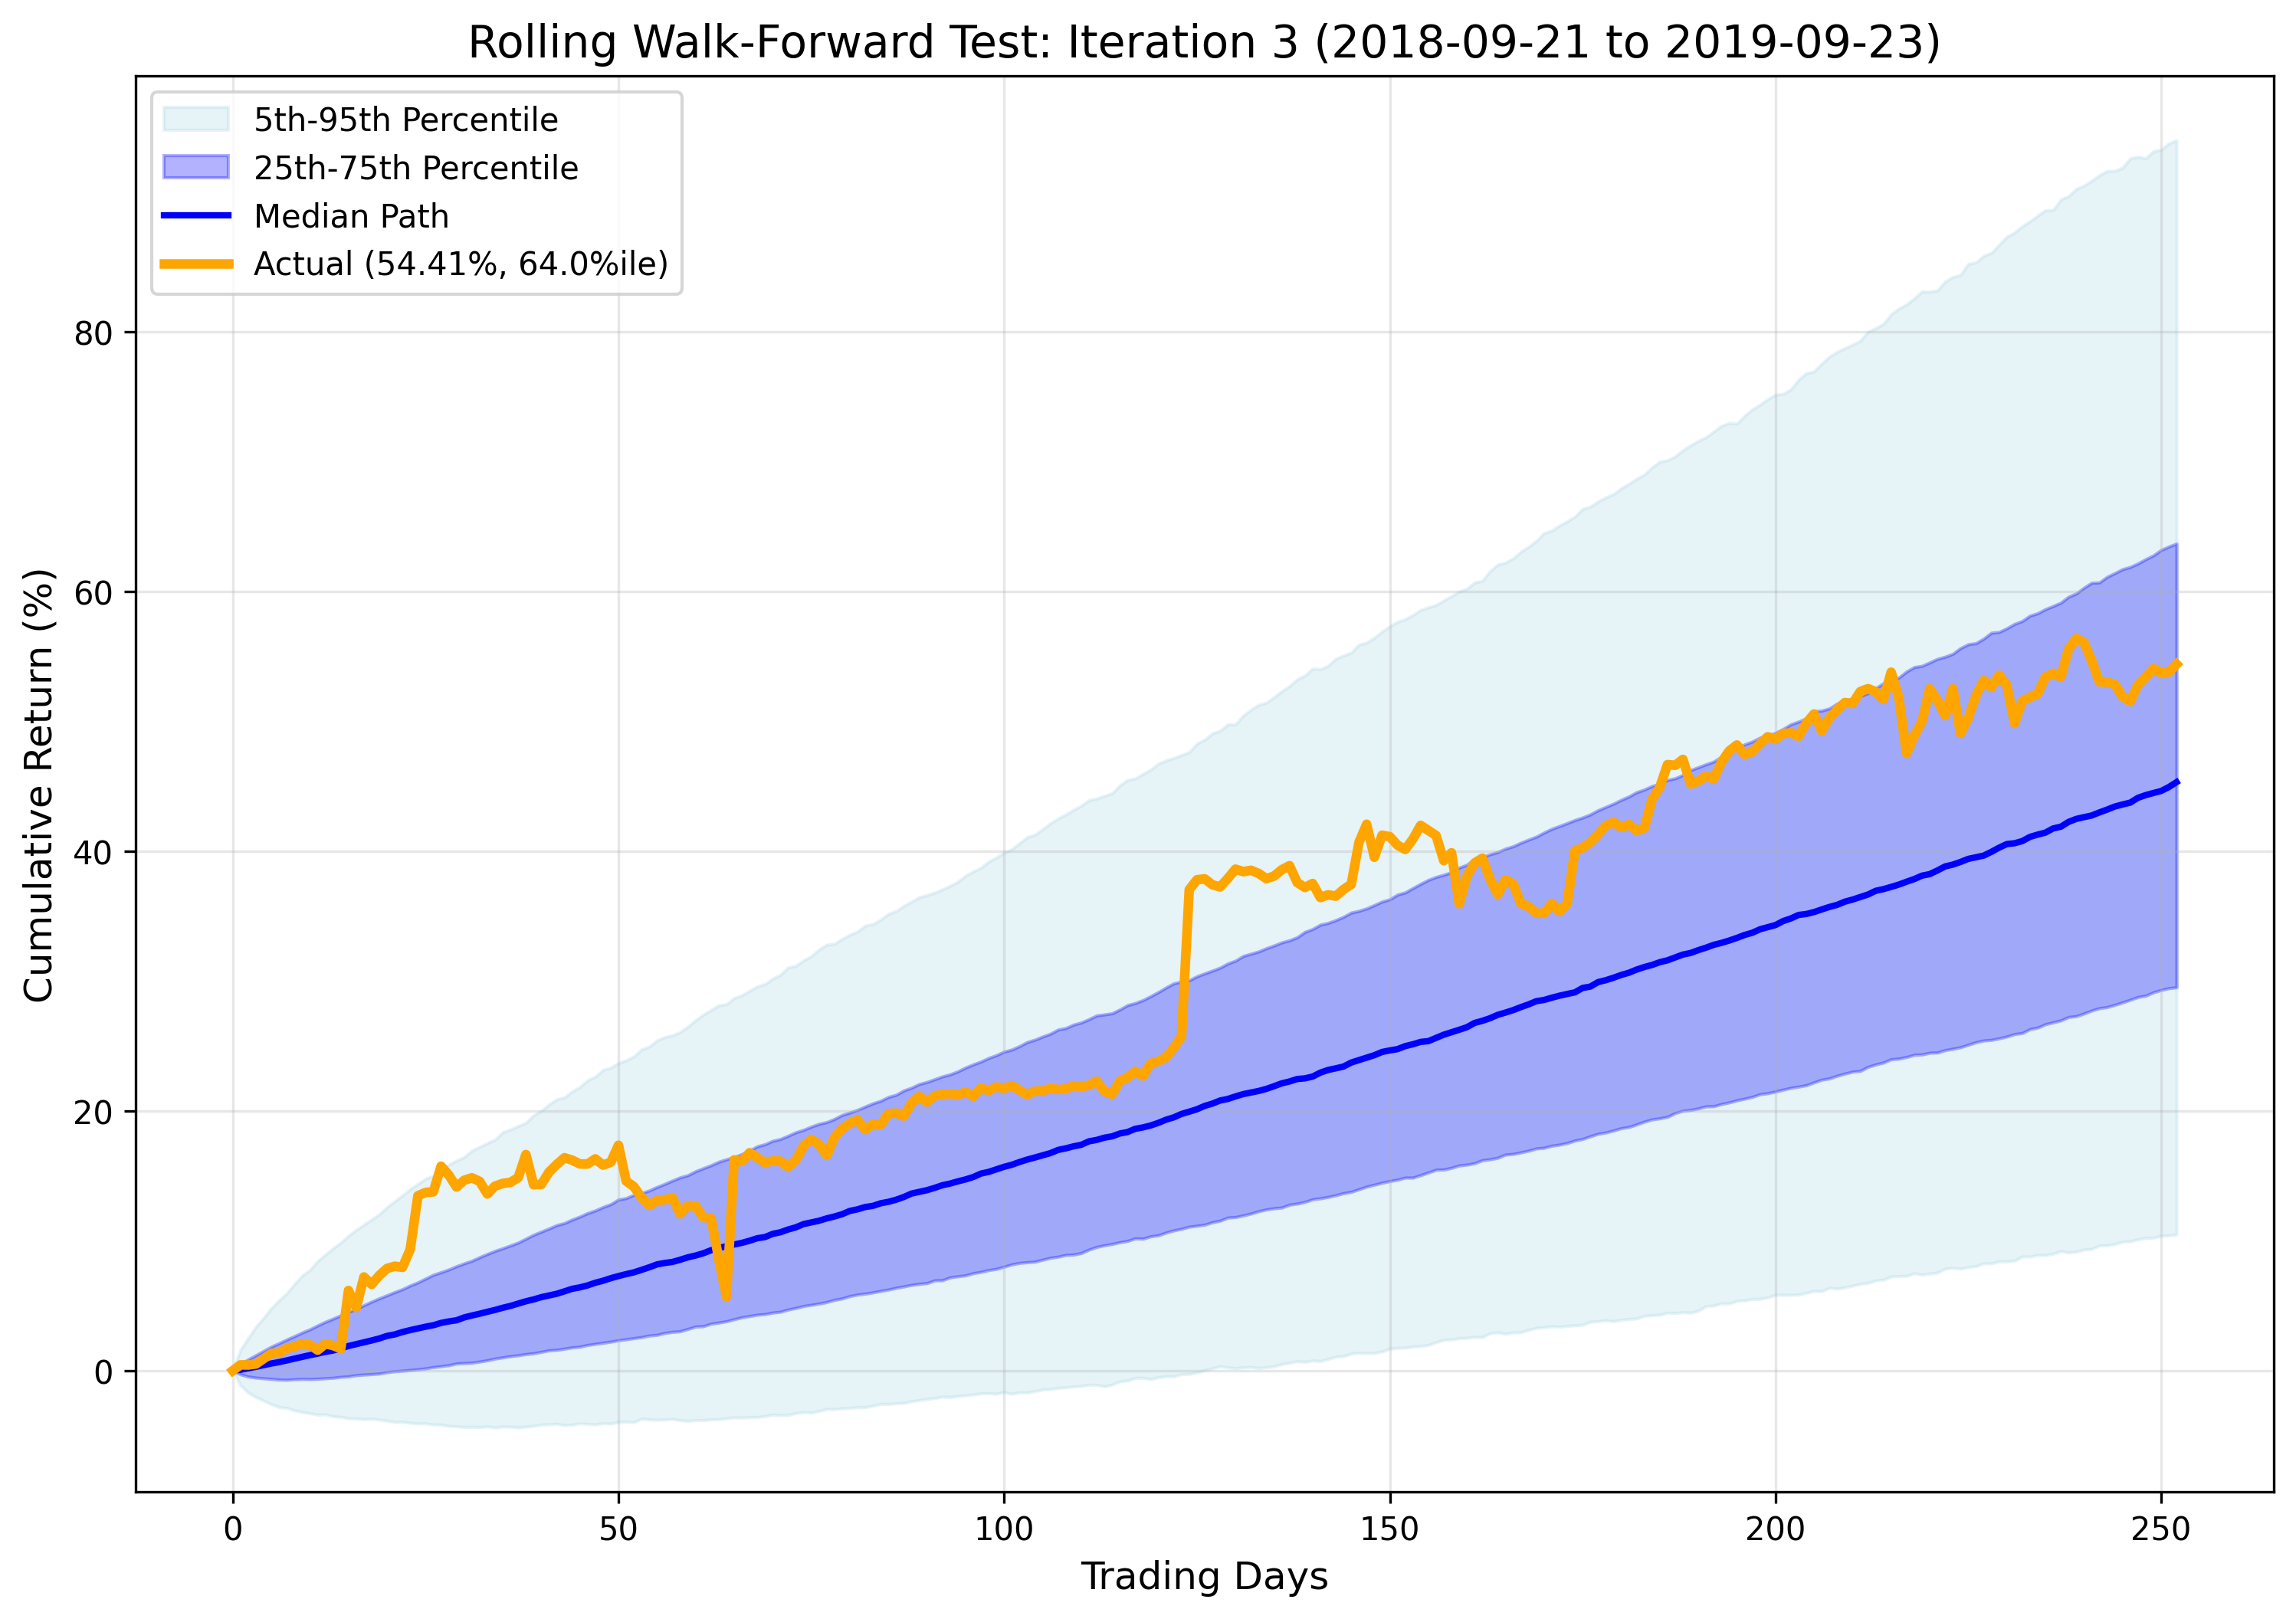
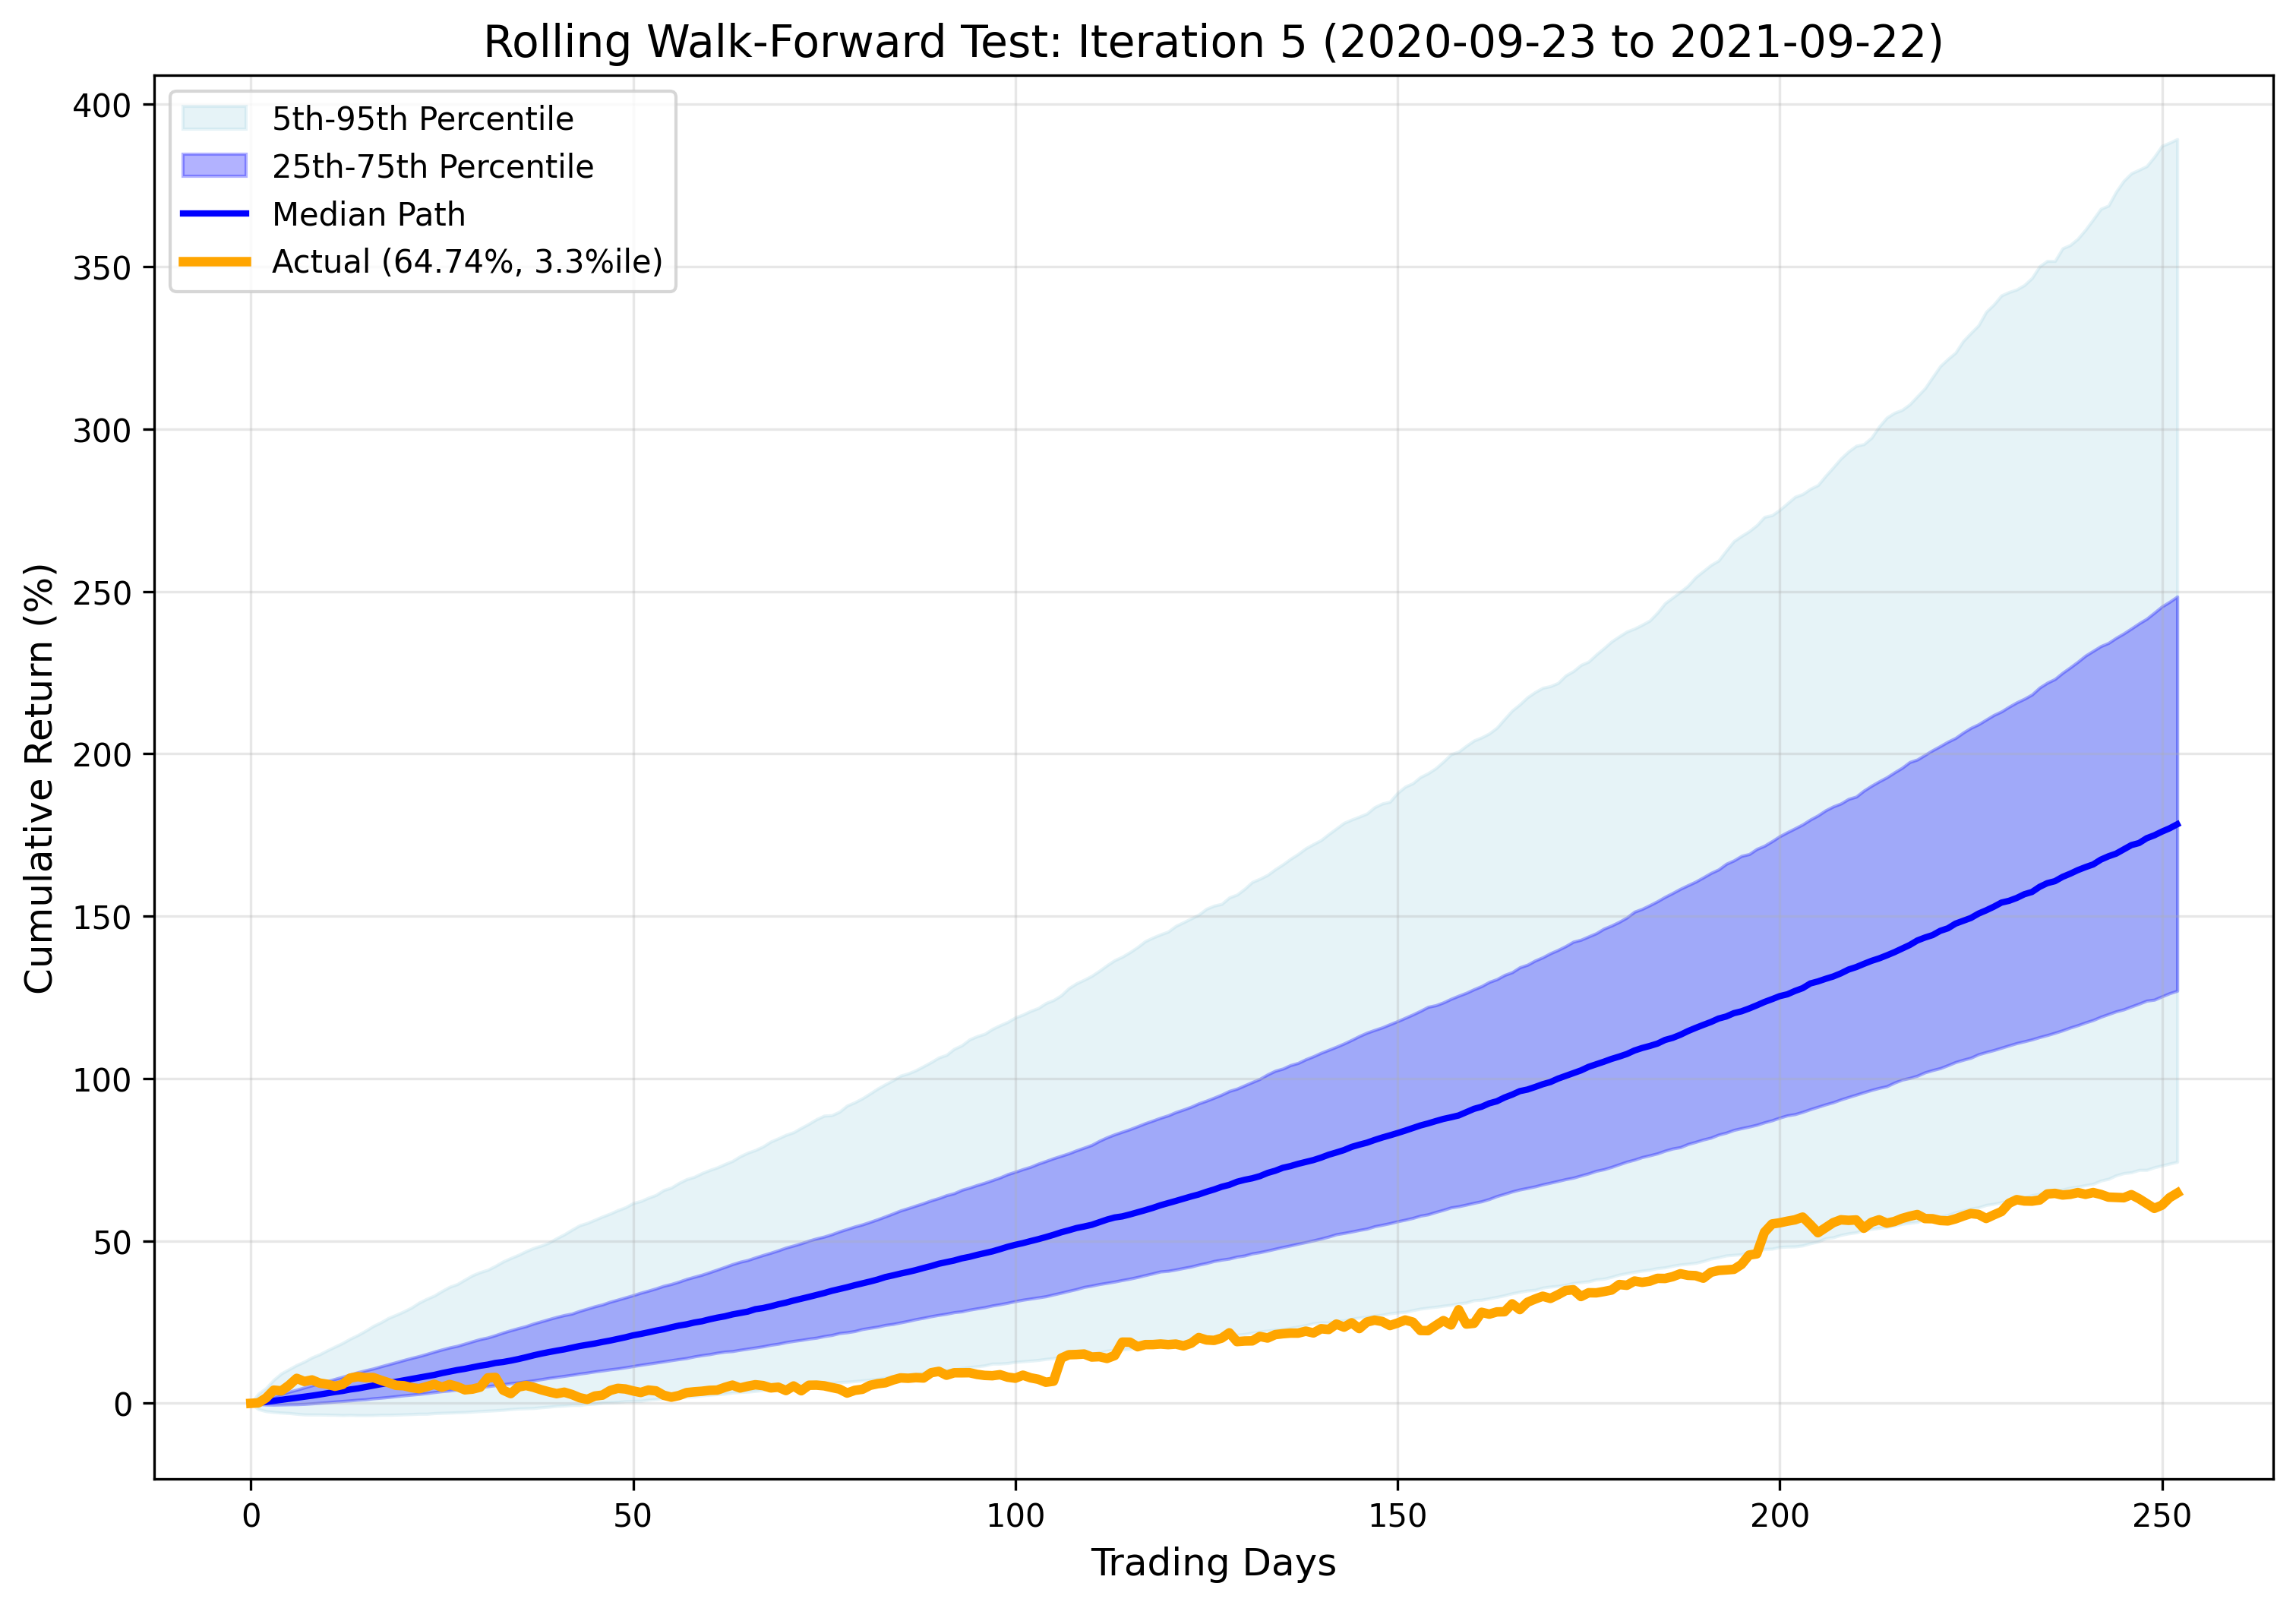
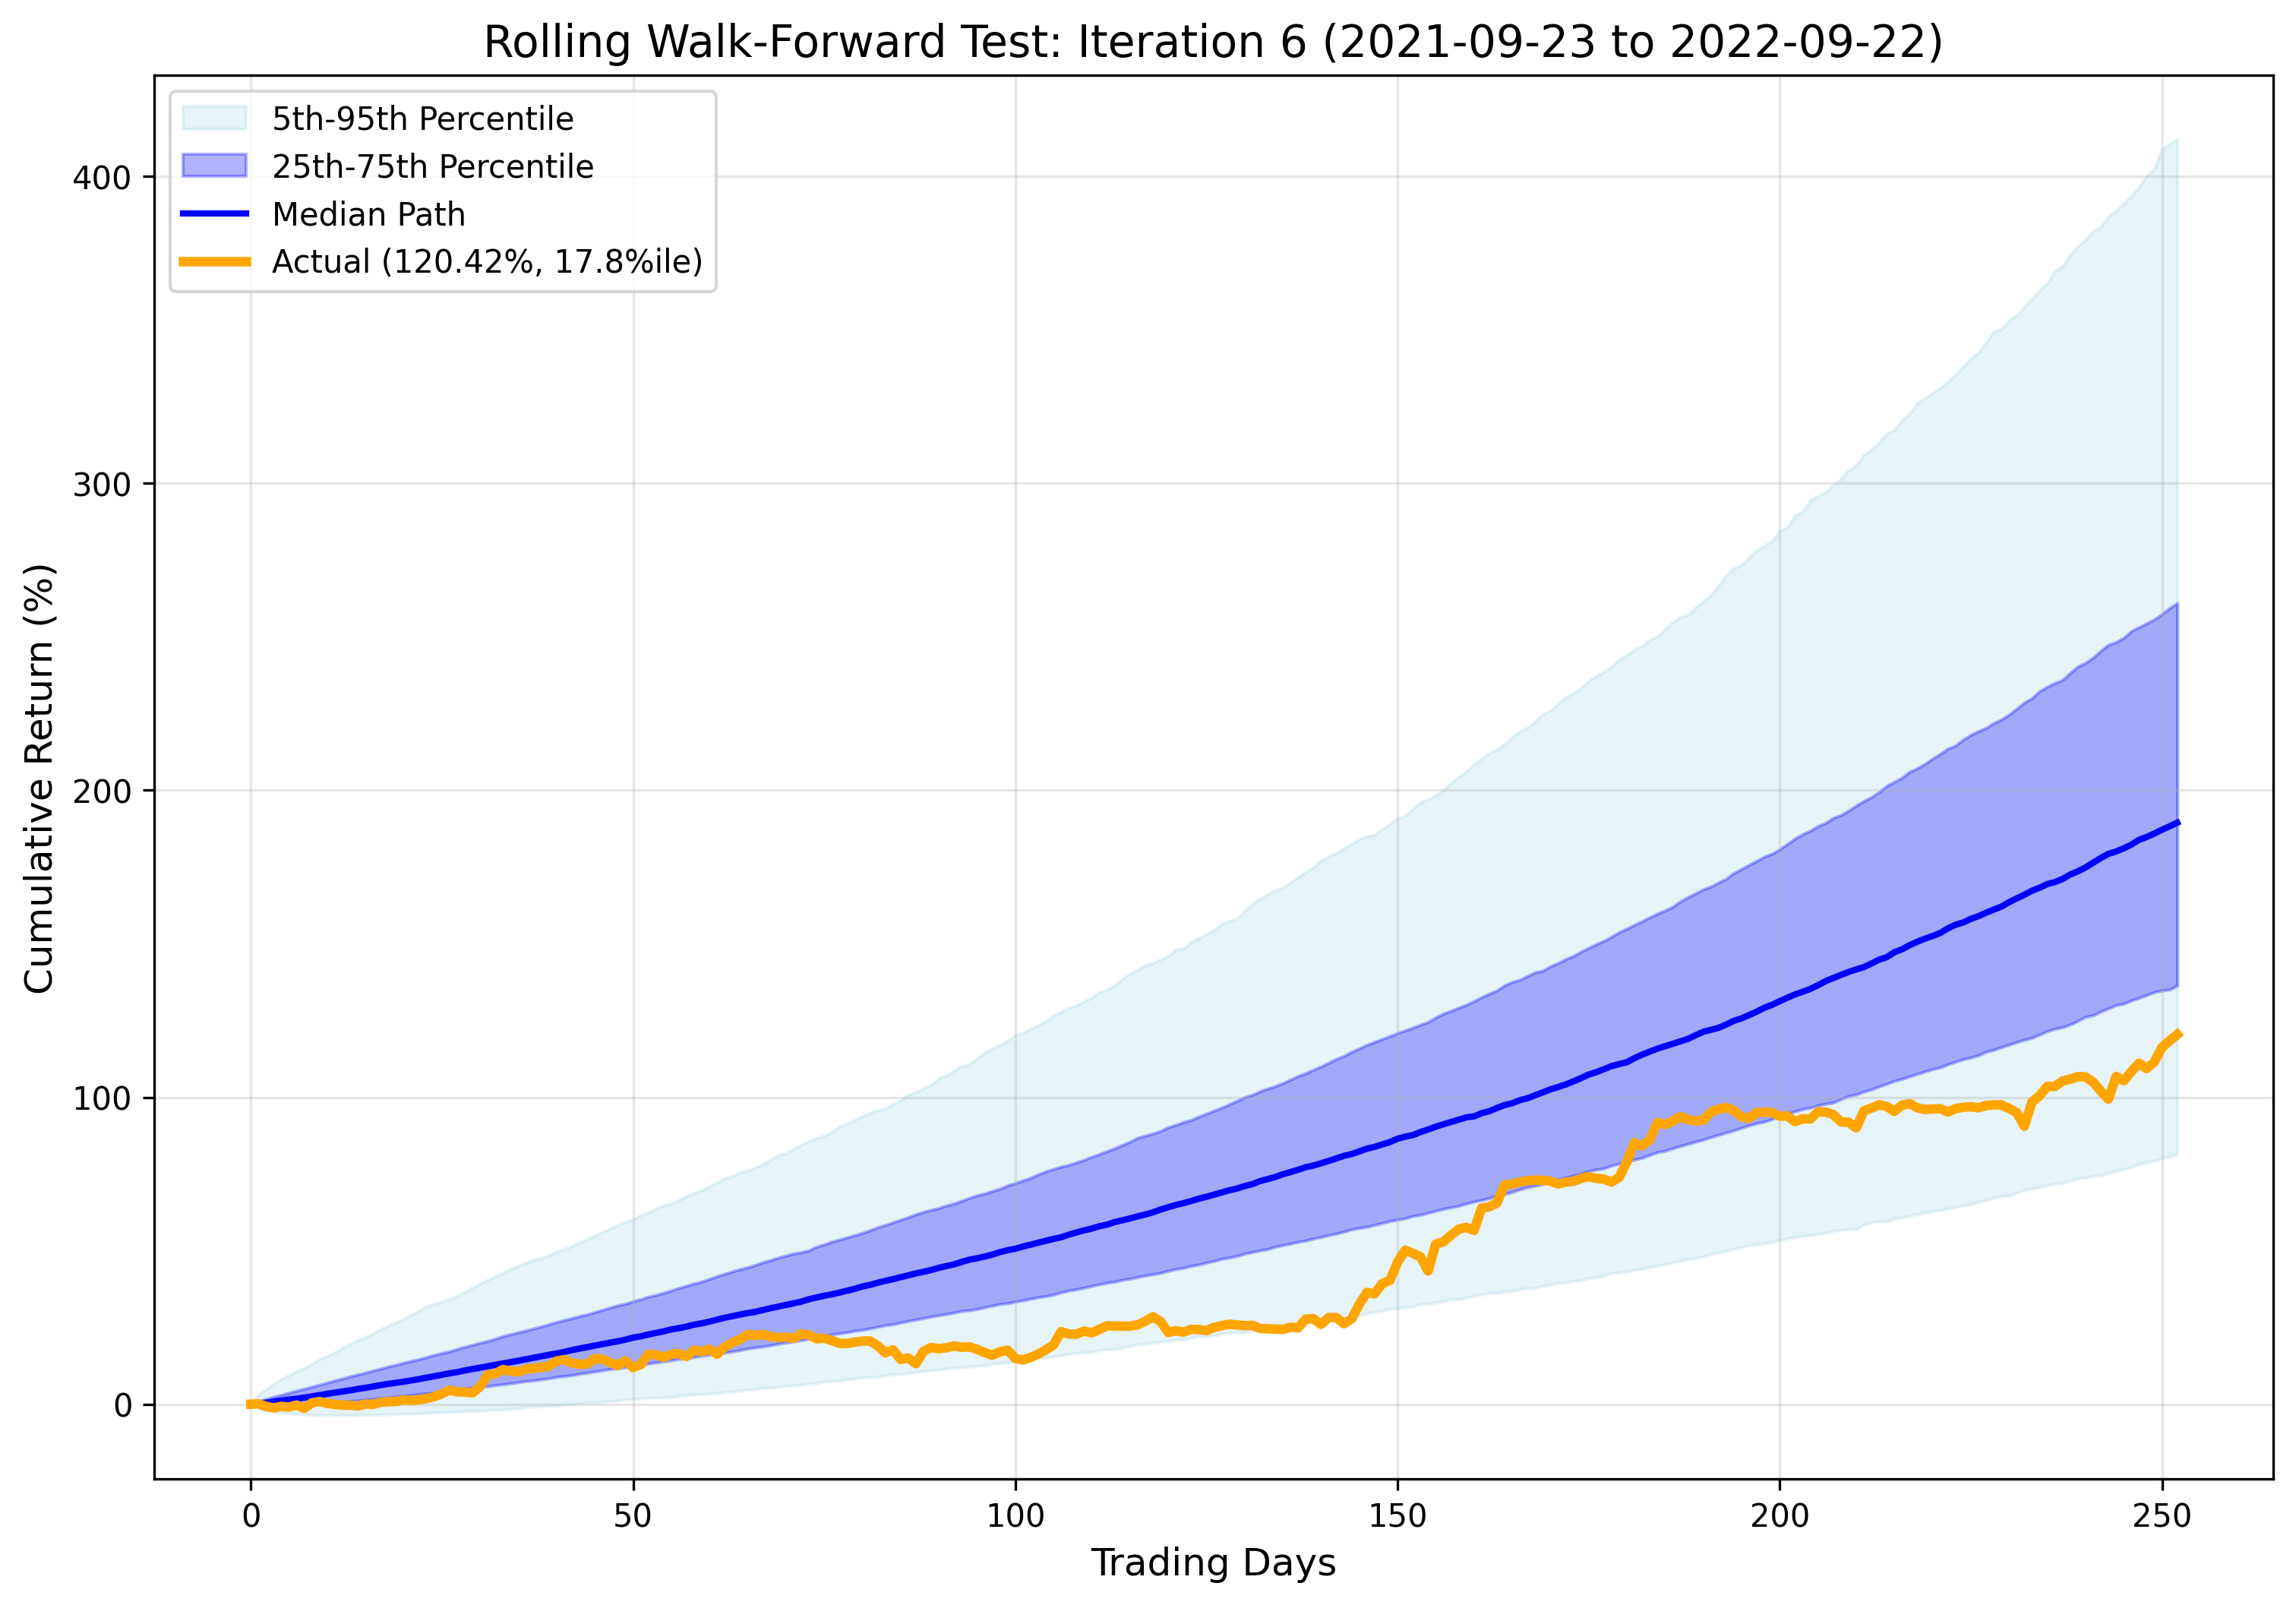
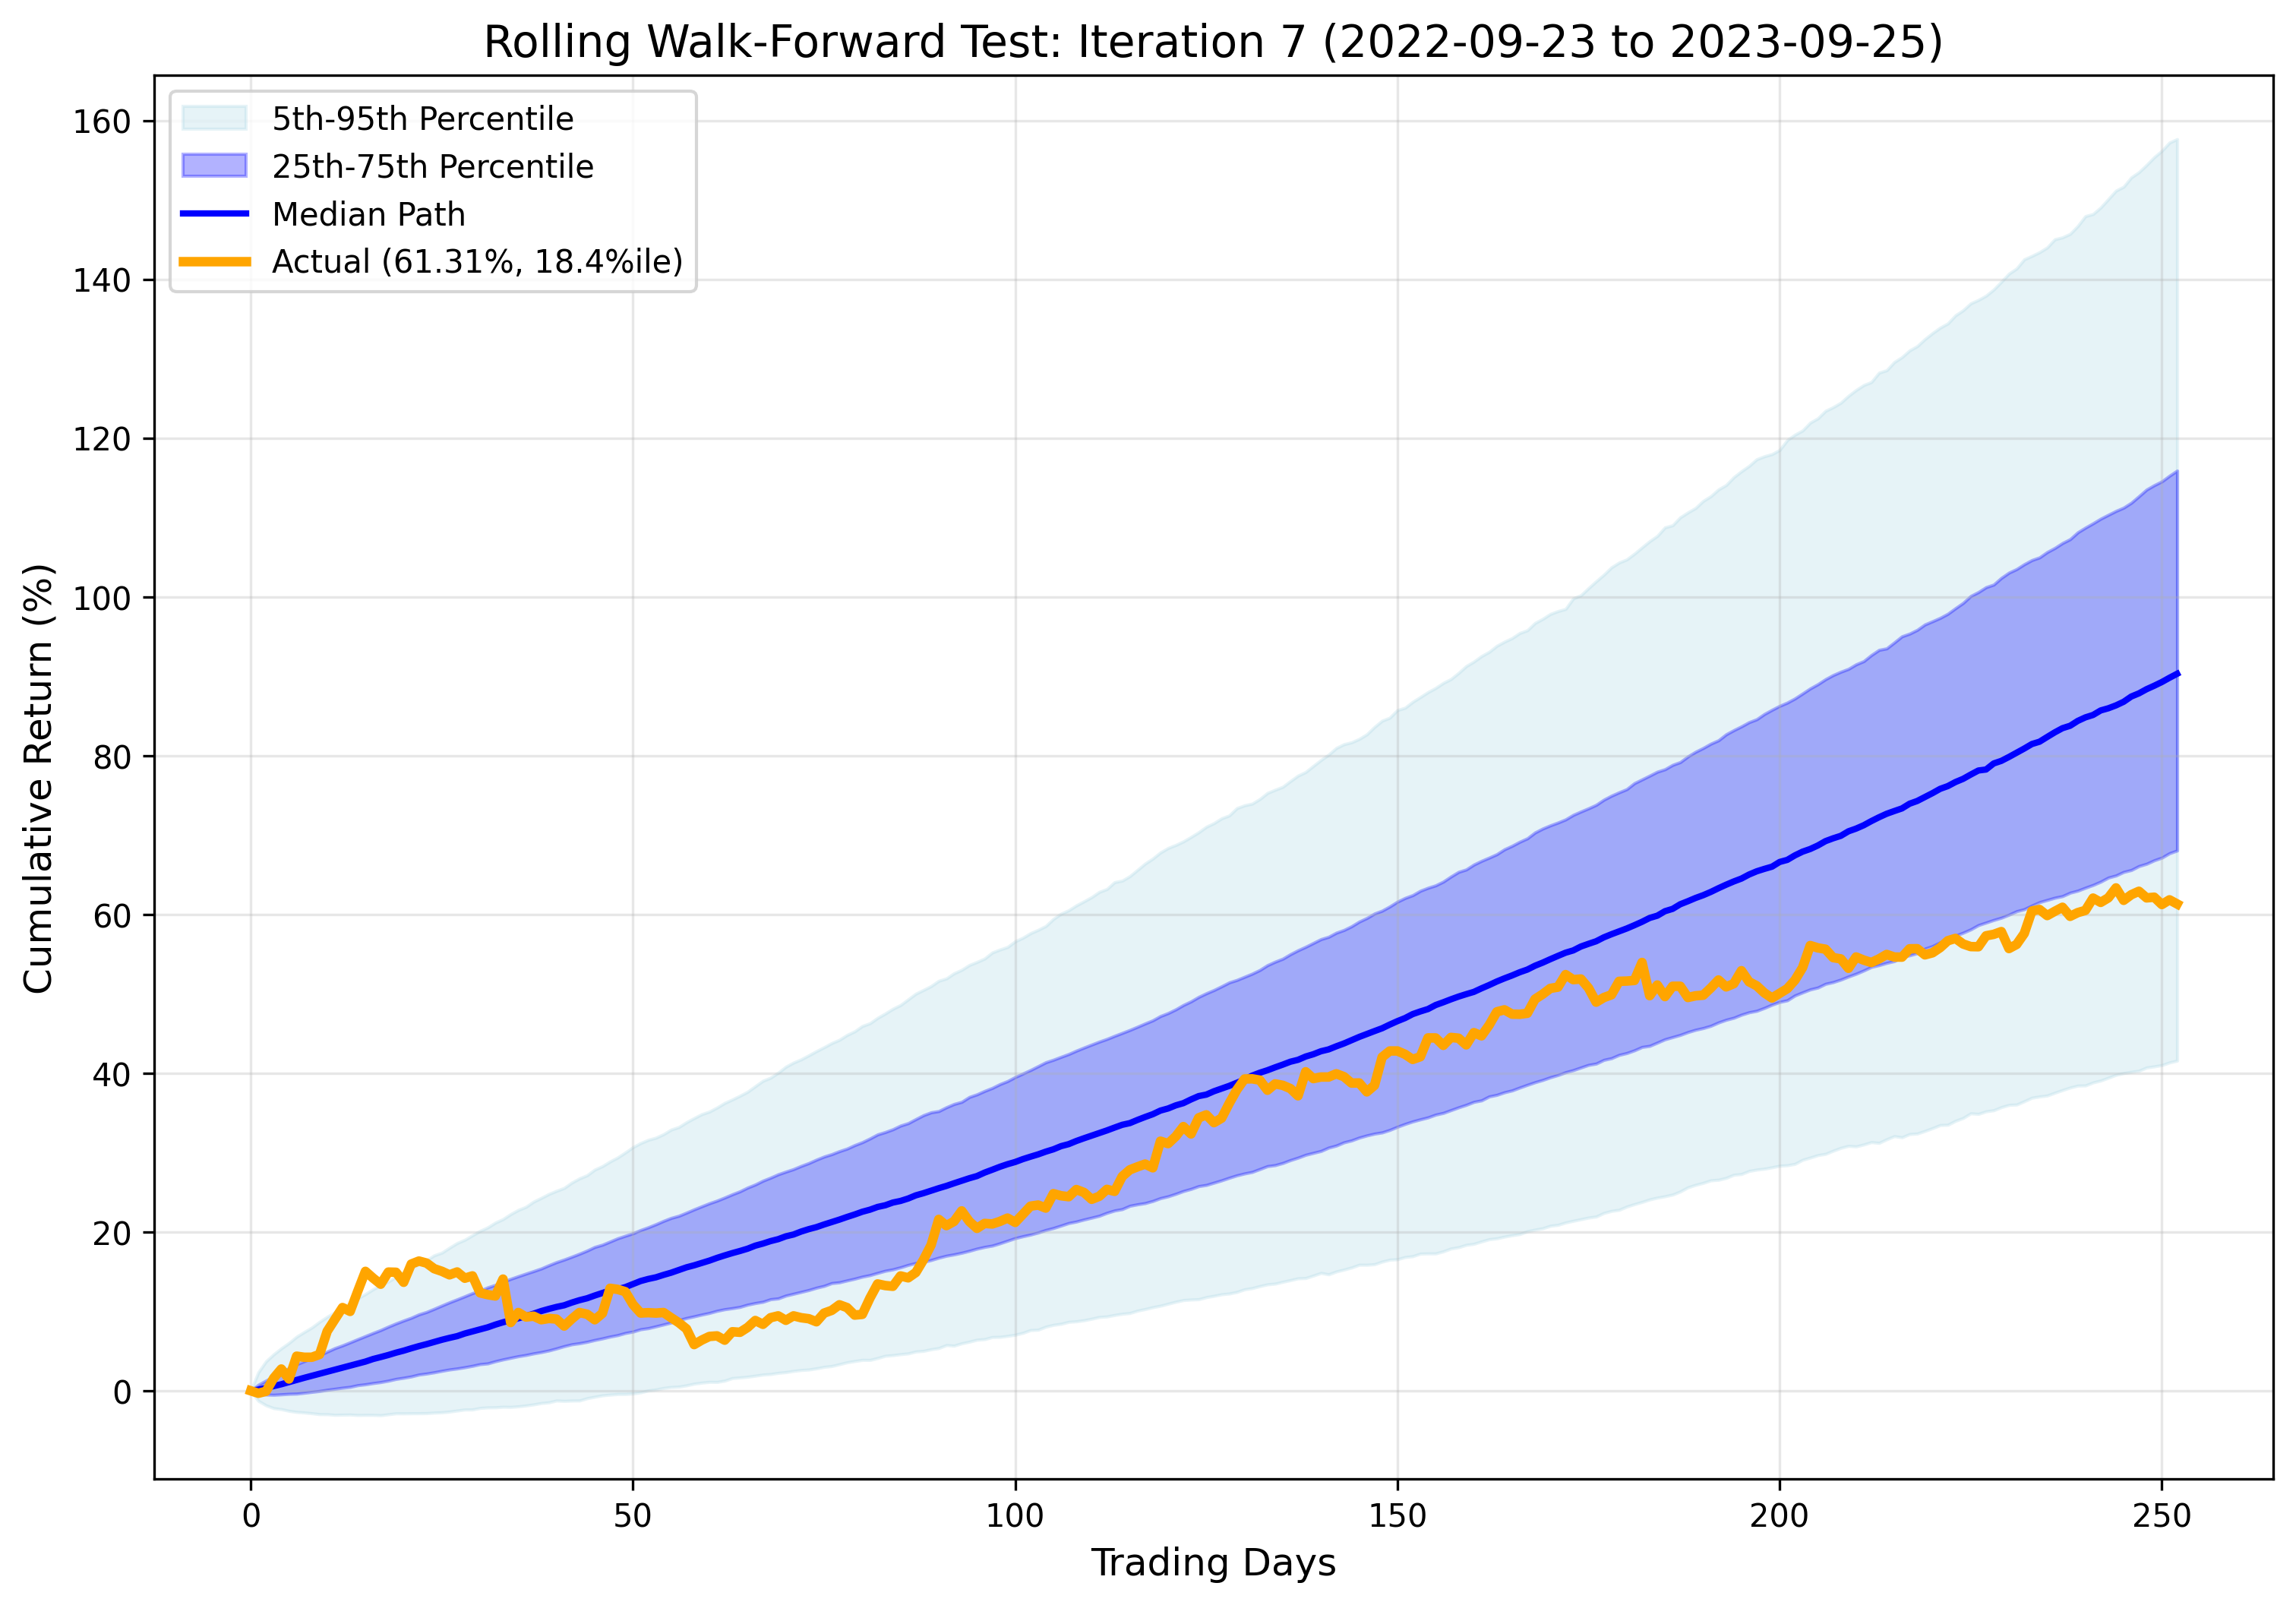
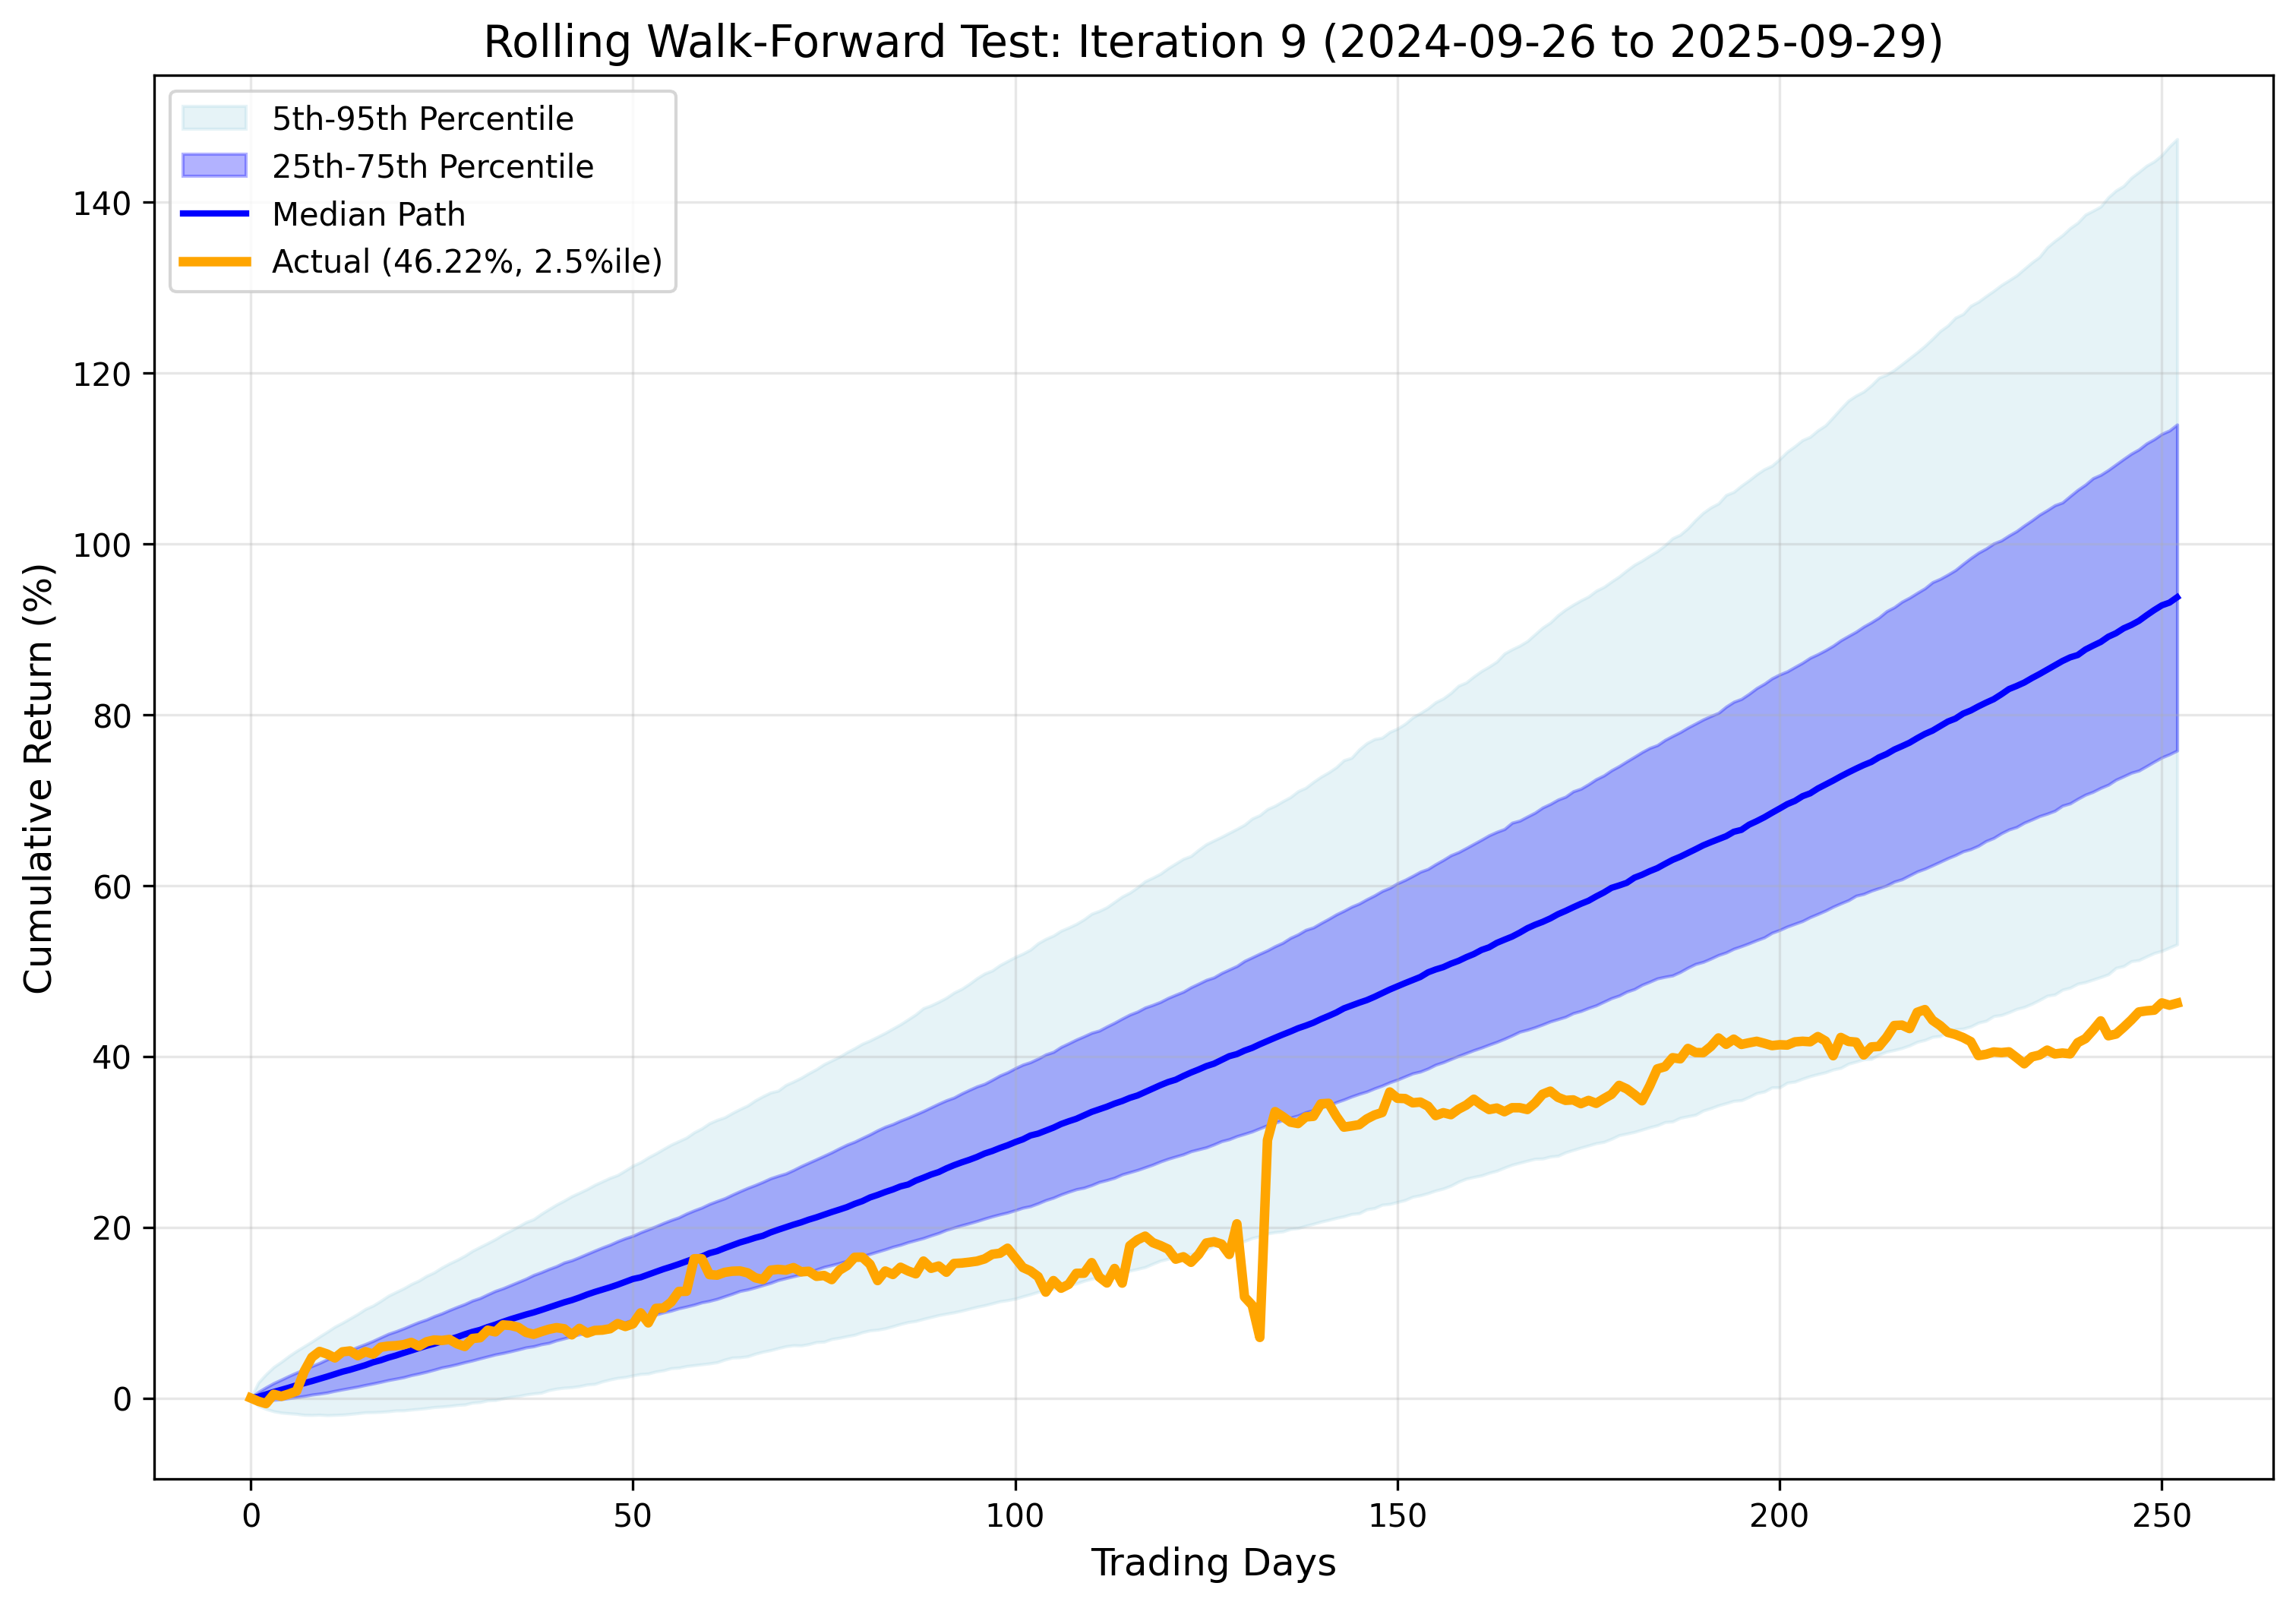
Monte Carlo robustness analysis to evaluate strategy's performance predictability using 10,000 simulations per test period within a rolling walk-forward framework
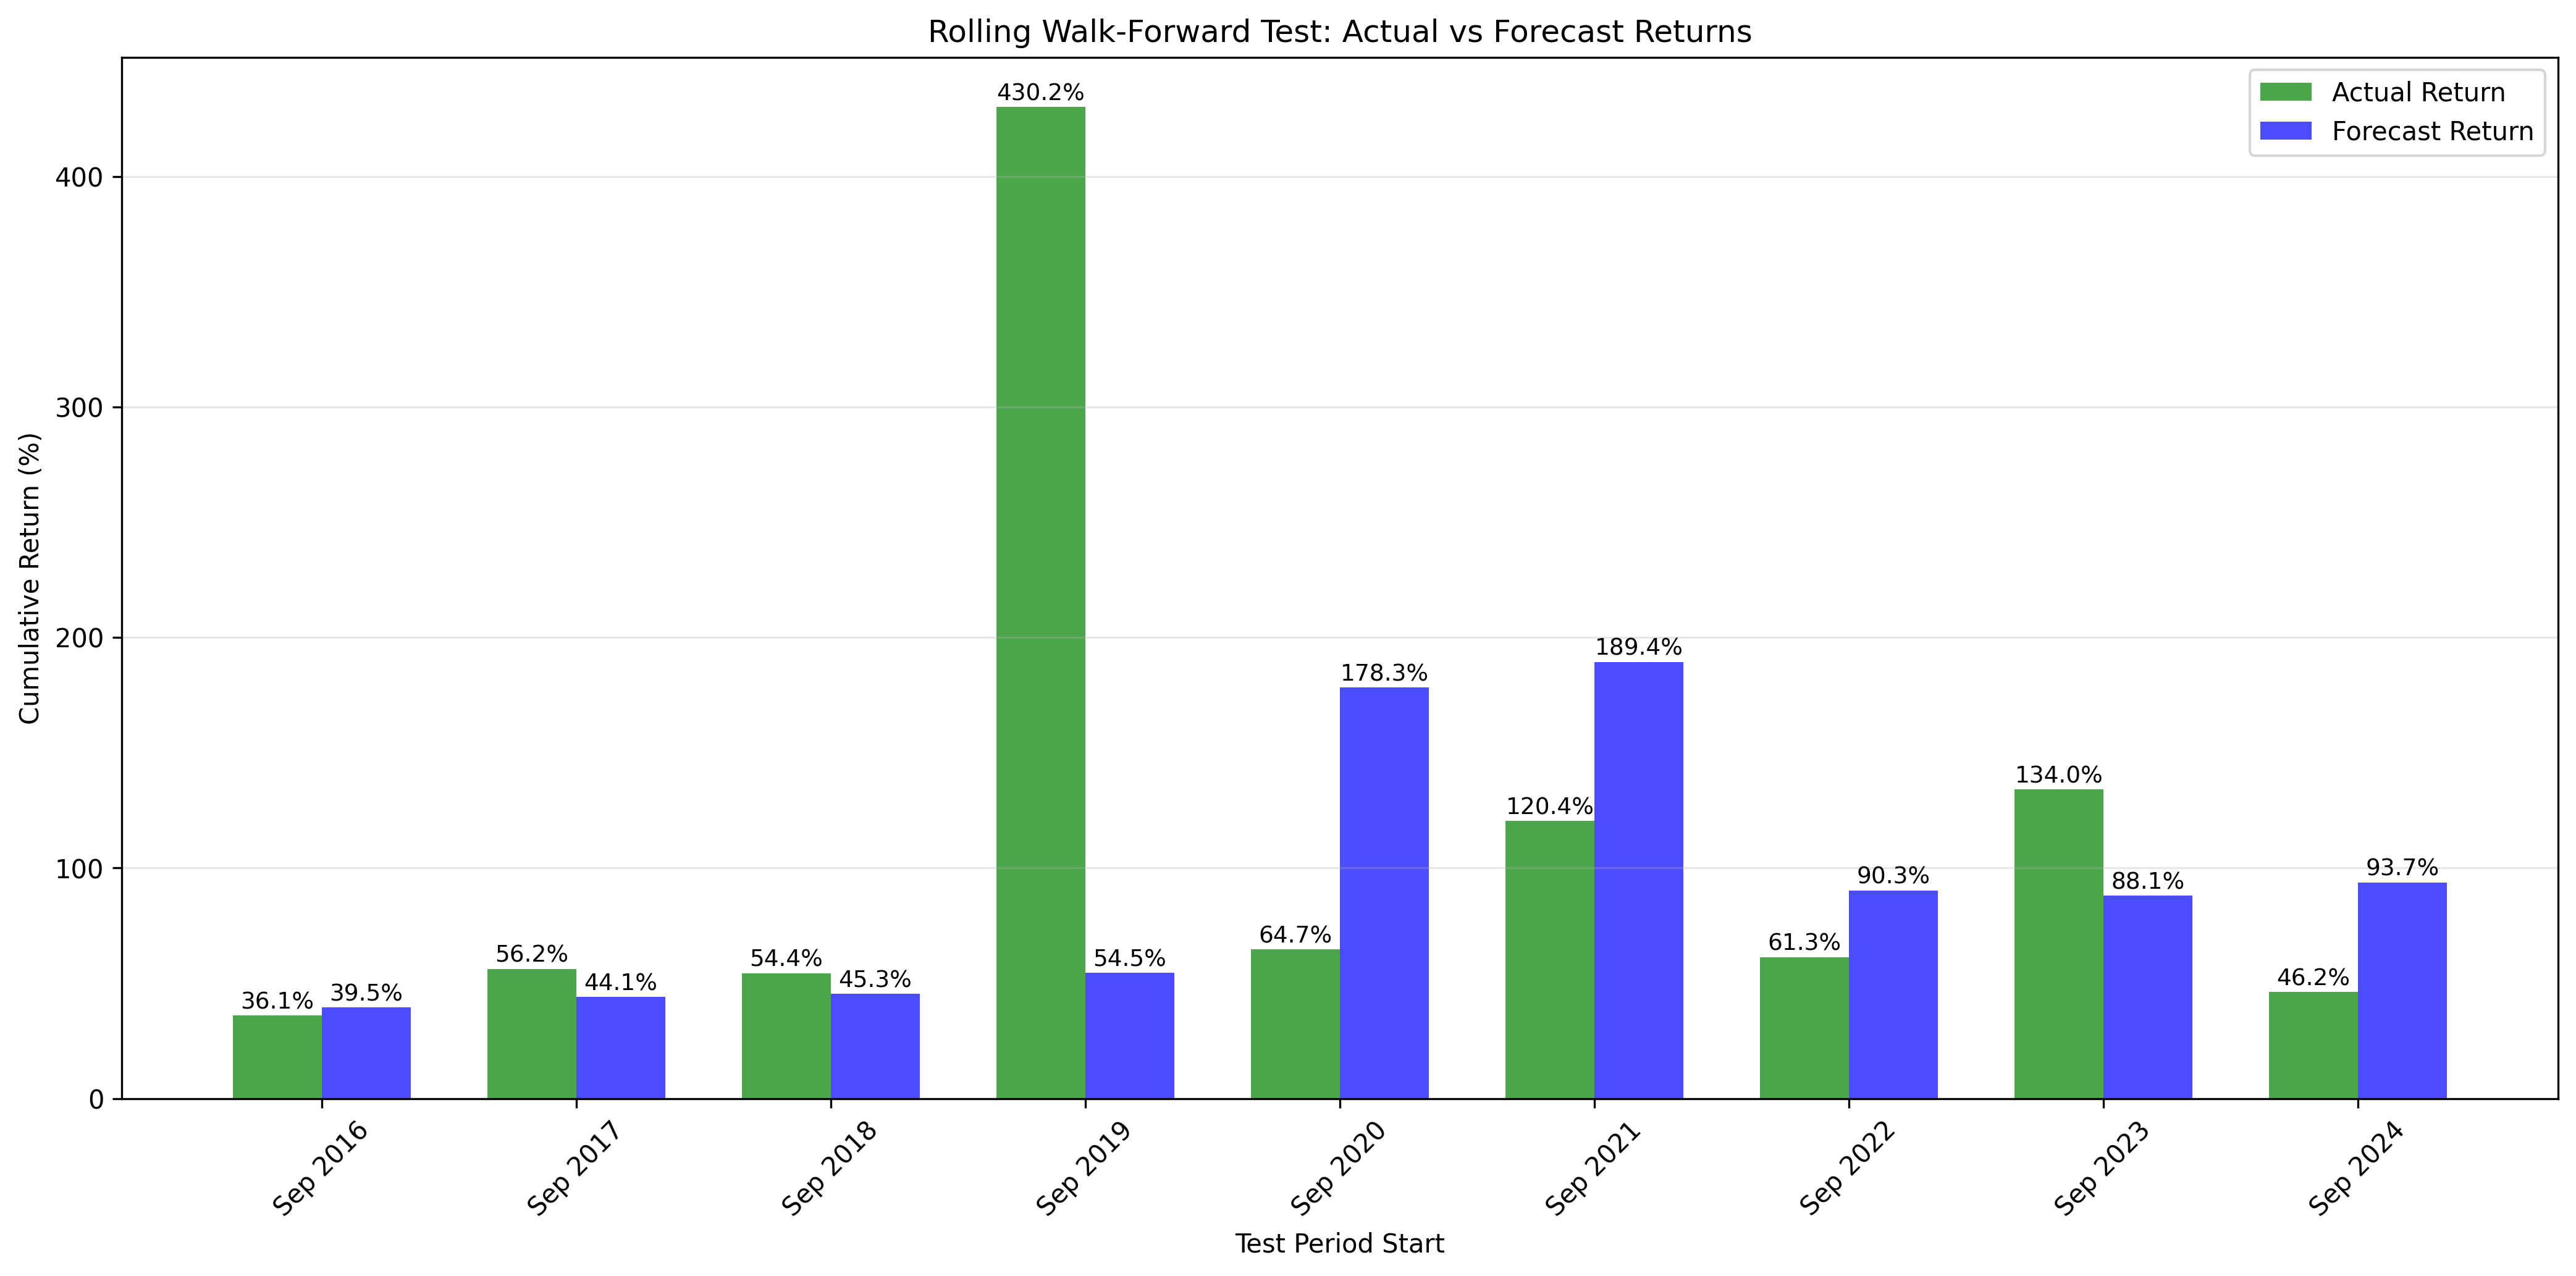
The rolling walk-forward test confirms the backtest is not a result of curve-fitting a specific market regime. Across 9 distinct market regimes, the strategy never posted a negative test period.
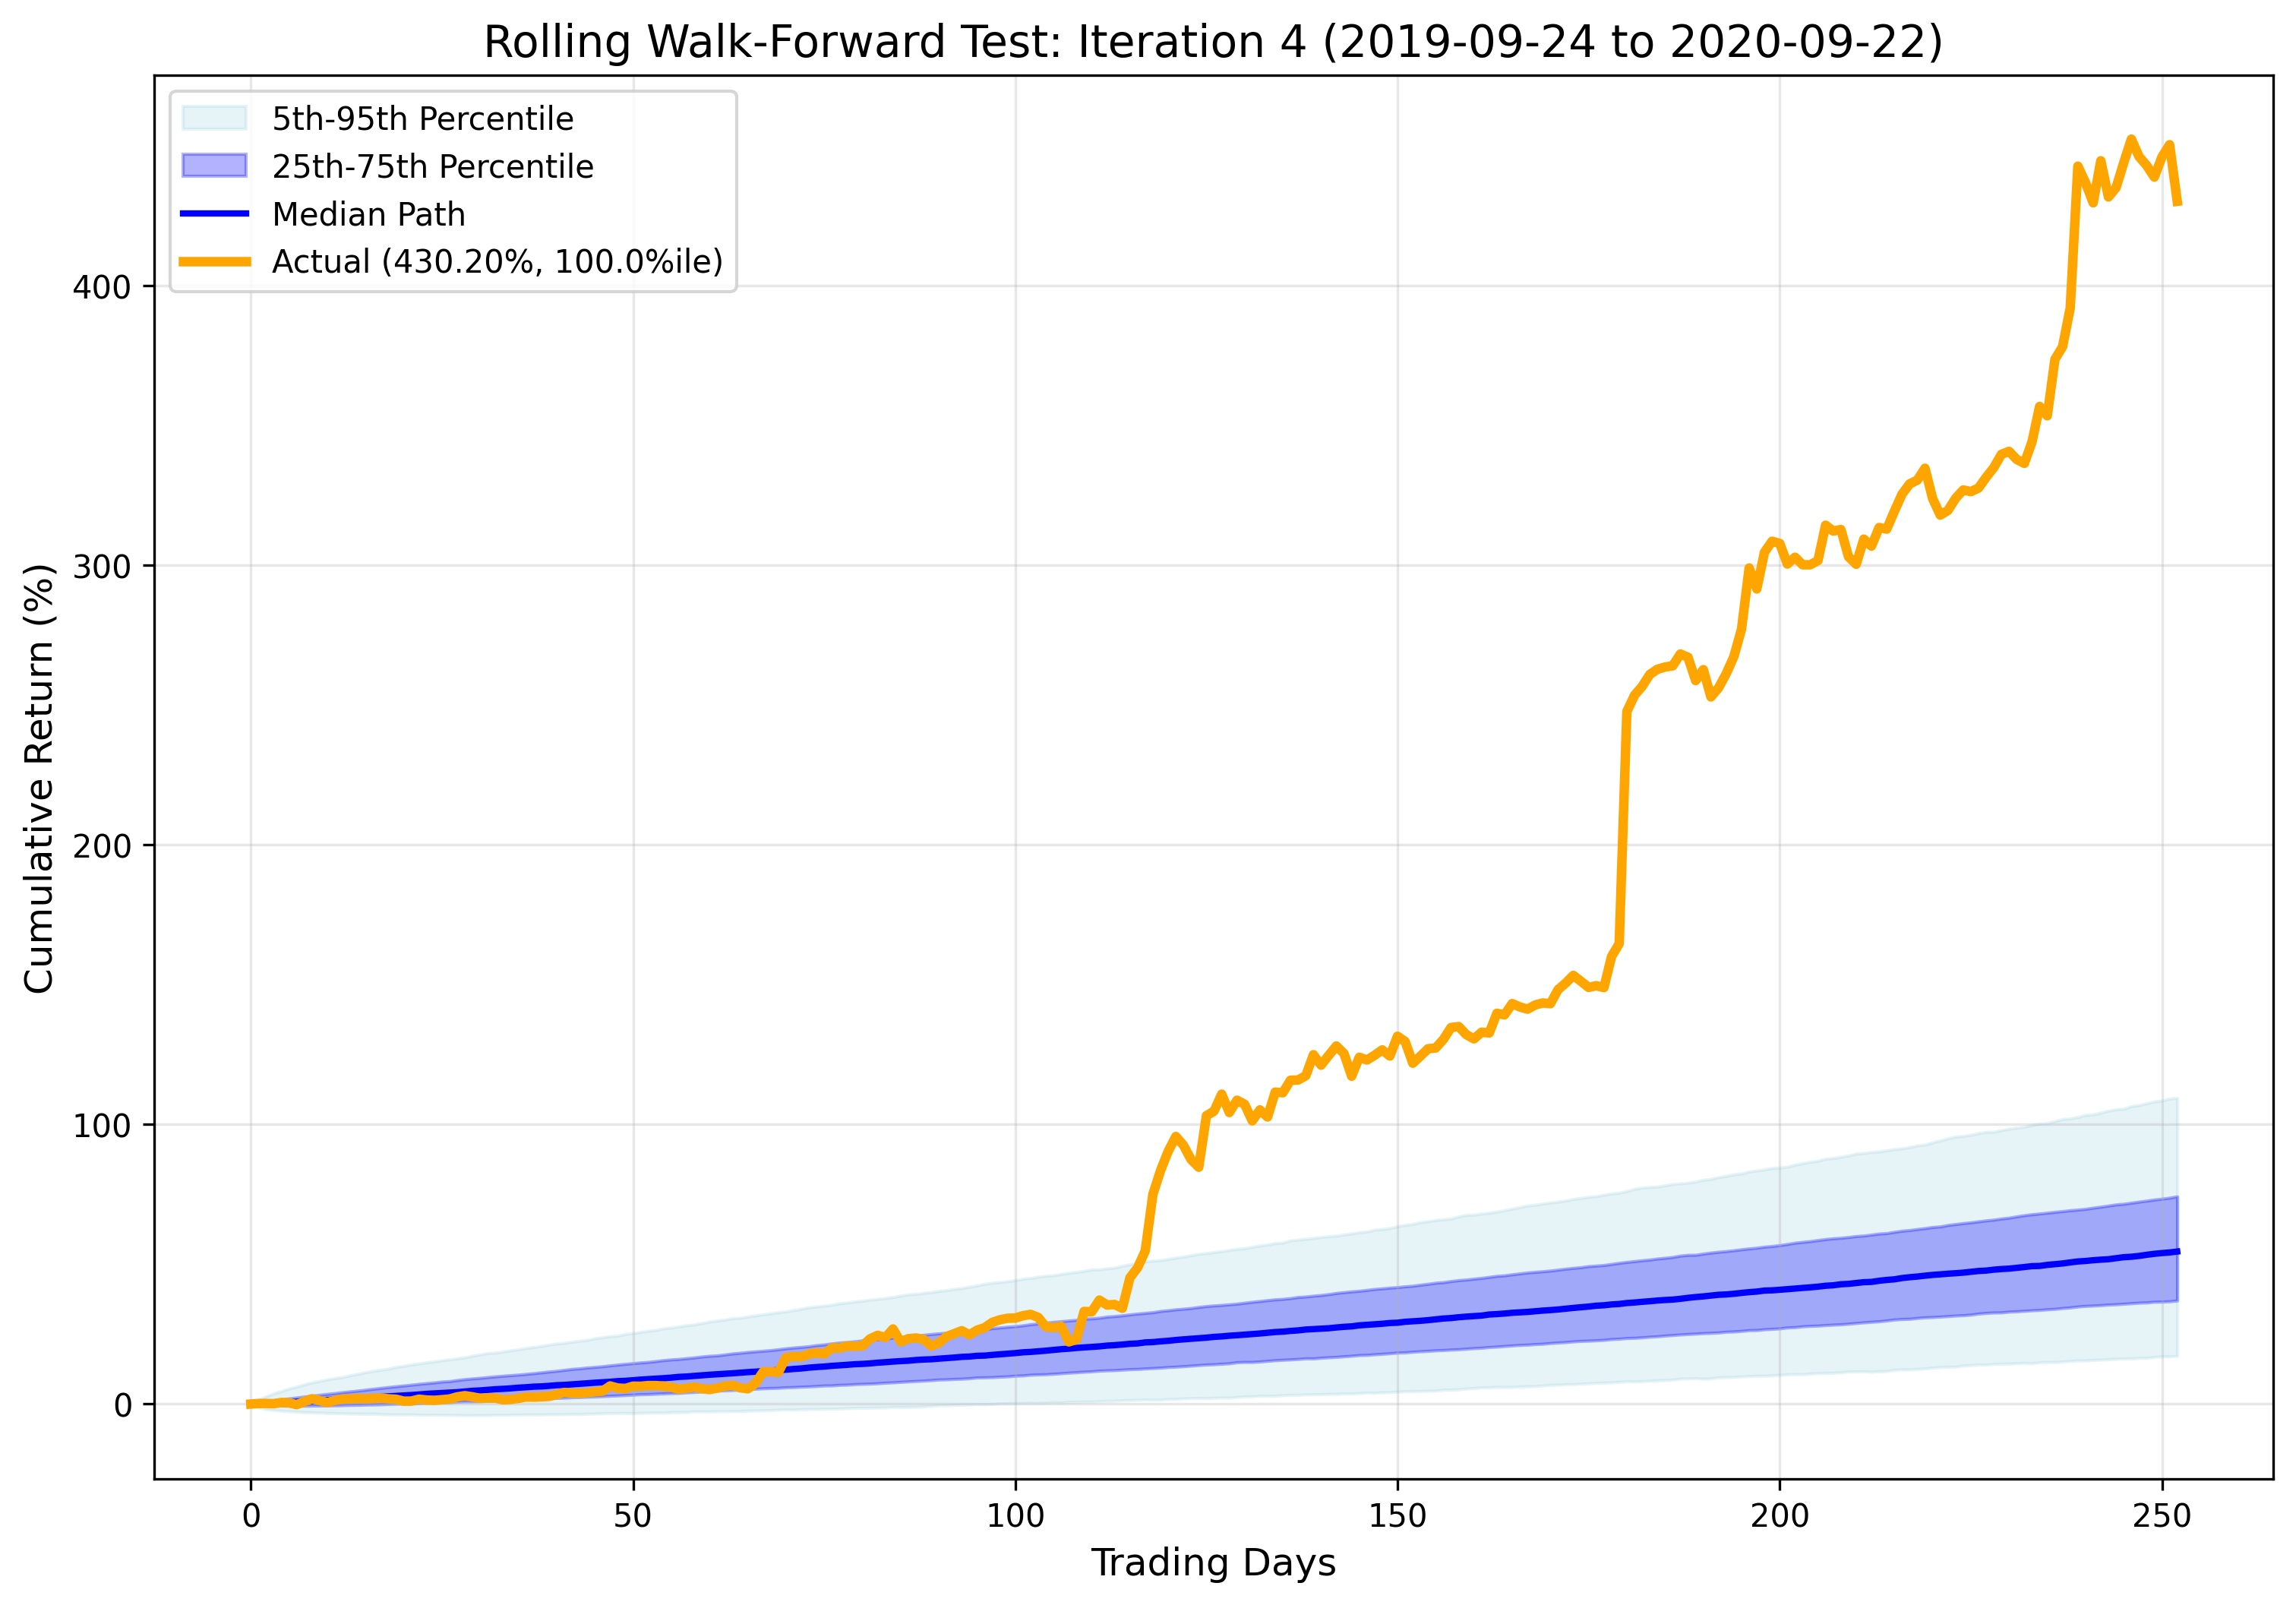
Iteration 4 delivered an outstanding return during a period that included the COVID crash. This confirms the strategy utilizes “long volatility” or “safe haven” rotation very effectively. While the 2019-2020 outlier skews averages, even “quiet” years (e.g., 2016-2017) produced exceptional returns. The edge is persistent, not random.
NOTE: This strategy is intentionally designed to capture outlier returns during specific market conditions. Following the periods of exceptional performance, Monte Carlo forecasts may appear overly optimistic in subsequent iterations, consequently making the strategy appear to underperform during those iterations. This is expected behavior as the simulations incorporate recent extreme returns into their probability distributions.
| Rank | Trading Days | Calendar Days | Max Drawdown | Start Date | End Date |
|---|---|---|---|---|---|
| 1 | 47 | 71 | 4.58% | 2016-11-10 | 2017-01-20 |
| 2 | 28 | 39 | 3.39% | 2017-06-26 | 2017-08-04 |
| 3 | 17 | 23 | 2.98% | 2017-08-07 | 2017-08-30 |
| 4 | 30 | 43 | 2.81% | 2017-03-09 | 2017-04-21 |
| Rank | Trading Days | Calendar Days | Max Drawdown | Start Date | End Date |
|---|---|---|---|---|---|
| 1 | 22 | 30 | 5.25% | 2017-09-27 | 2017-10-27 |
| 2 | 28 | 42 | 4.95% | 2017-12-01 | 2018-01-12 |
| 3 | 19 | 27 | 3.12% | 2018-07-25 | 2018-08-21 |
| 4 | 15 | 22 | 1.19% | 2018-05-09 | 2018-05-31 |
| Rank | Trading Days | Calendar Days | Max Drawdown | Start Date | End Date |
|---|---|---|---|---|---|
| 1 | 24 | 37 | 9.94% | 2018-12-03 | 2019-01-09 |
| 2 | 31 | 46 | 4.79% | 2019-04-25 | 2019-06-10 |
| 3 | 22 | 33 | 4.08% | 2019-08-01 | 2019-09-03 |
No significant drawdown periods (>20 calendar days) found.
| Rank | Trading Days | Calendar Days | Max Drawdown | Start Date | End Date |
|---|---|---|---|---|---|
| 1 | 74 | 108 | 6.46% | 2020-10-13 | 2021-01-29 |
| 2 | 15 | 22 | 3.06% | 2021-02-02 | 2021-02-24 |
| Rank | Trading Days | Calendar Days | Max Drawdown | Start Date | End Date |
|---|---|---|---|---|---|
| 1 | 33 | 49 | 7.87% | 2022-01-05 | 2022-02-23 |
| 2 | 26 | 37 | 3.98% | 2022-03-14 | 2022-04-20 |
| 3 | 15 | 21 | 3.70% | 2022-08-04 | 2022-08-25 |
| 4 | 19 | 28 | 3.38% | 2022-06-30 | 2022-07-28 |
| Rank | Trading Days | Calendar Days | Max Drawdown | Start Date | End Date |
|---|---|---|---|---|---|
| 1 | 65 | 97 | 9.05% | 2022-10-25 | 2023-01-30 |
| 2 | 21 | 33 | 2.91% | 2023-06-15 | 2023-07-18 |
| 3 | 17 | 23 | 1.84% | 2023-07-19 | 2023-08-11 |
| Rank | Trading Days | Calendar Days | Max Drawdown | Start Date | End Date |
|---|---|---|---|---|---|
| 1 | 21 | 32 | 3.05% | 2024-02-02 | 2024-03-05 |
| 2 | 14 | 21 | 1.60% | 2023-11-20 | 2023-12-11 |

| Rank | Trading Days | Calendar Days | Max Drawdown | Start Date | End Date |
|---|---|---|---|---|---|
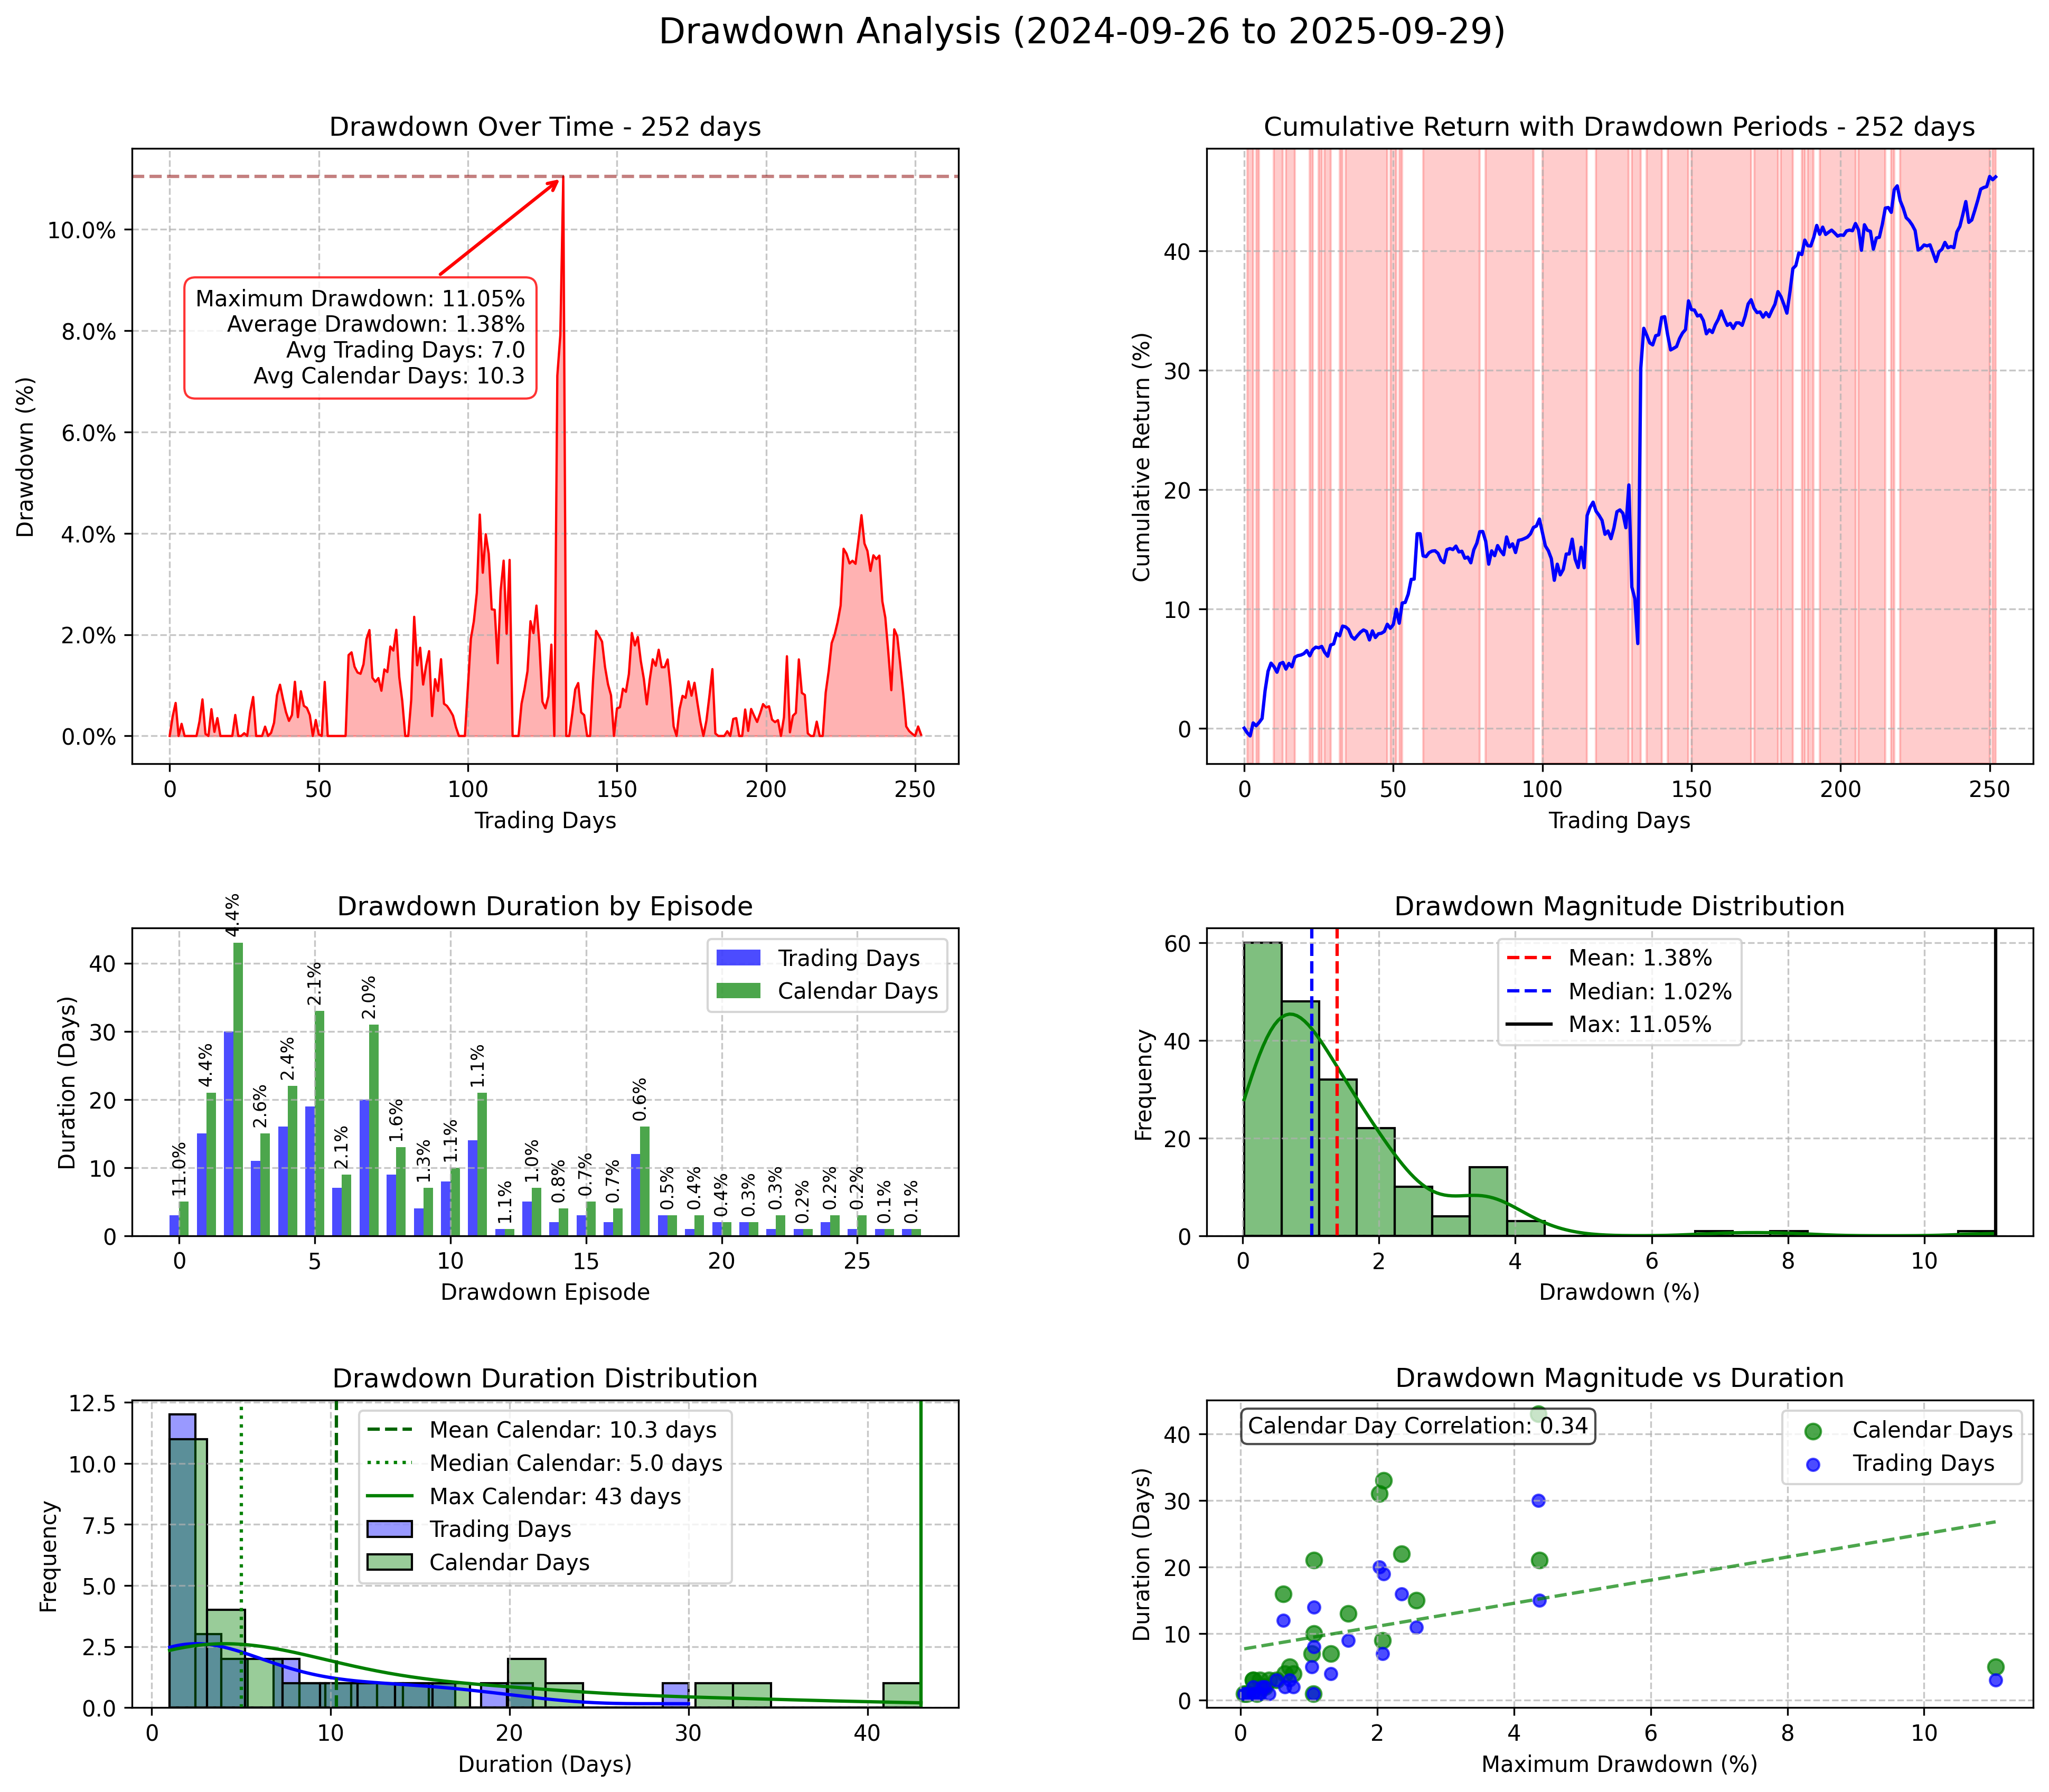
| 1 | 15 | 21 | 4.37% | 2025-02-20 | 2025-03-13 |
| 2 | 30 | 43 | 4.36% | 2025-08-13 | 2025-09-25 |
| 3 | 16 | 22 | 2.35% | 2025-01-23 | 2025-02-14 |
| 4 | 19 | 33 | 2.10% | 2024-12-19 | 2025-01-21 |
| 5 | 20 | 31 | 2.03% | 2025-05-02 | 2025-06-02 |
| Metric | Value |
|---|---|
| Average Actual Return | 111.51% |
| Average Forecast Return | 91.43% |
| Average Error | 20.08% |
| Average Percentile | 45.5% |
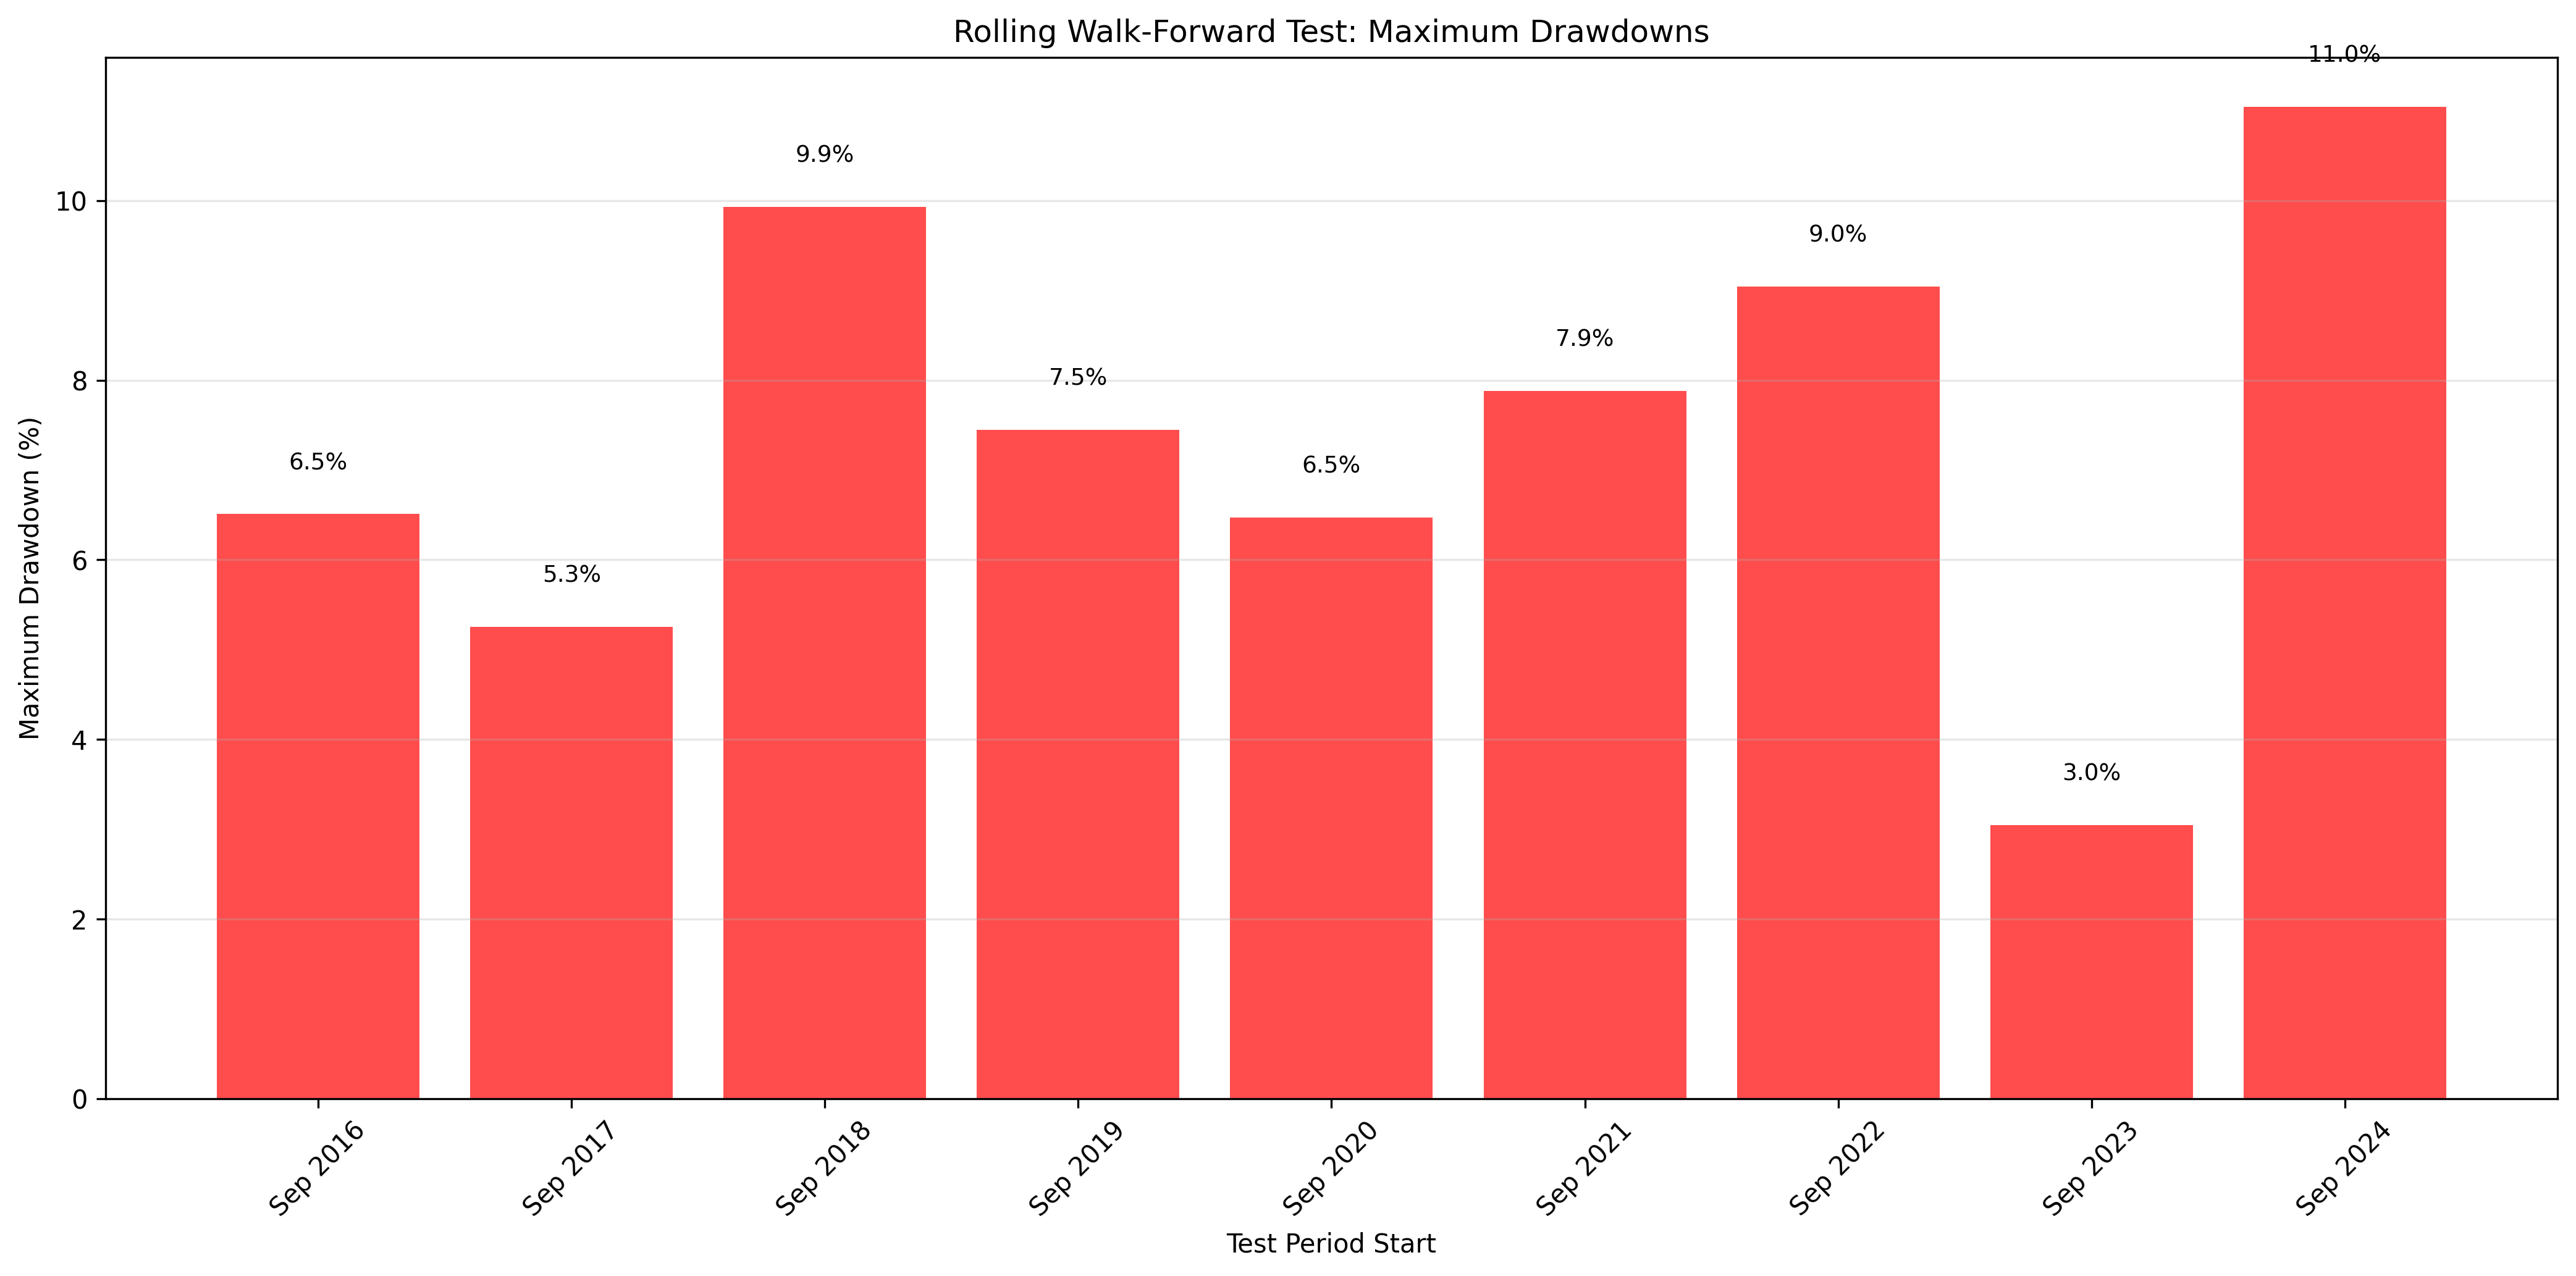
| Average Max Drawdown | 7.40% |
| Average Actual CAGR | 111.51% |
| Average Forecast CAGR | 91.43% |
Please wait while we get Zehnvisor on the line for you...