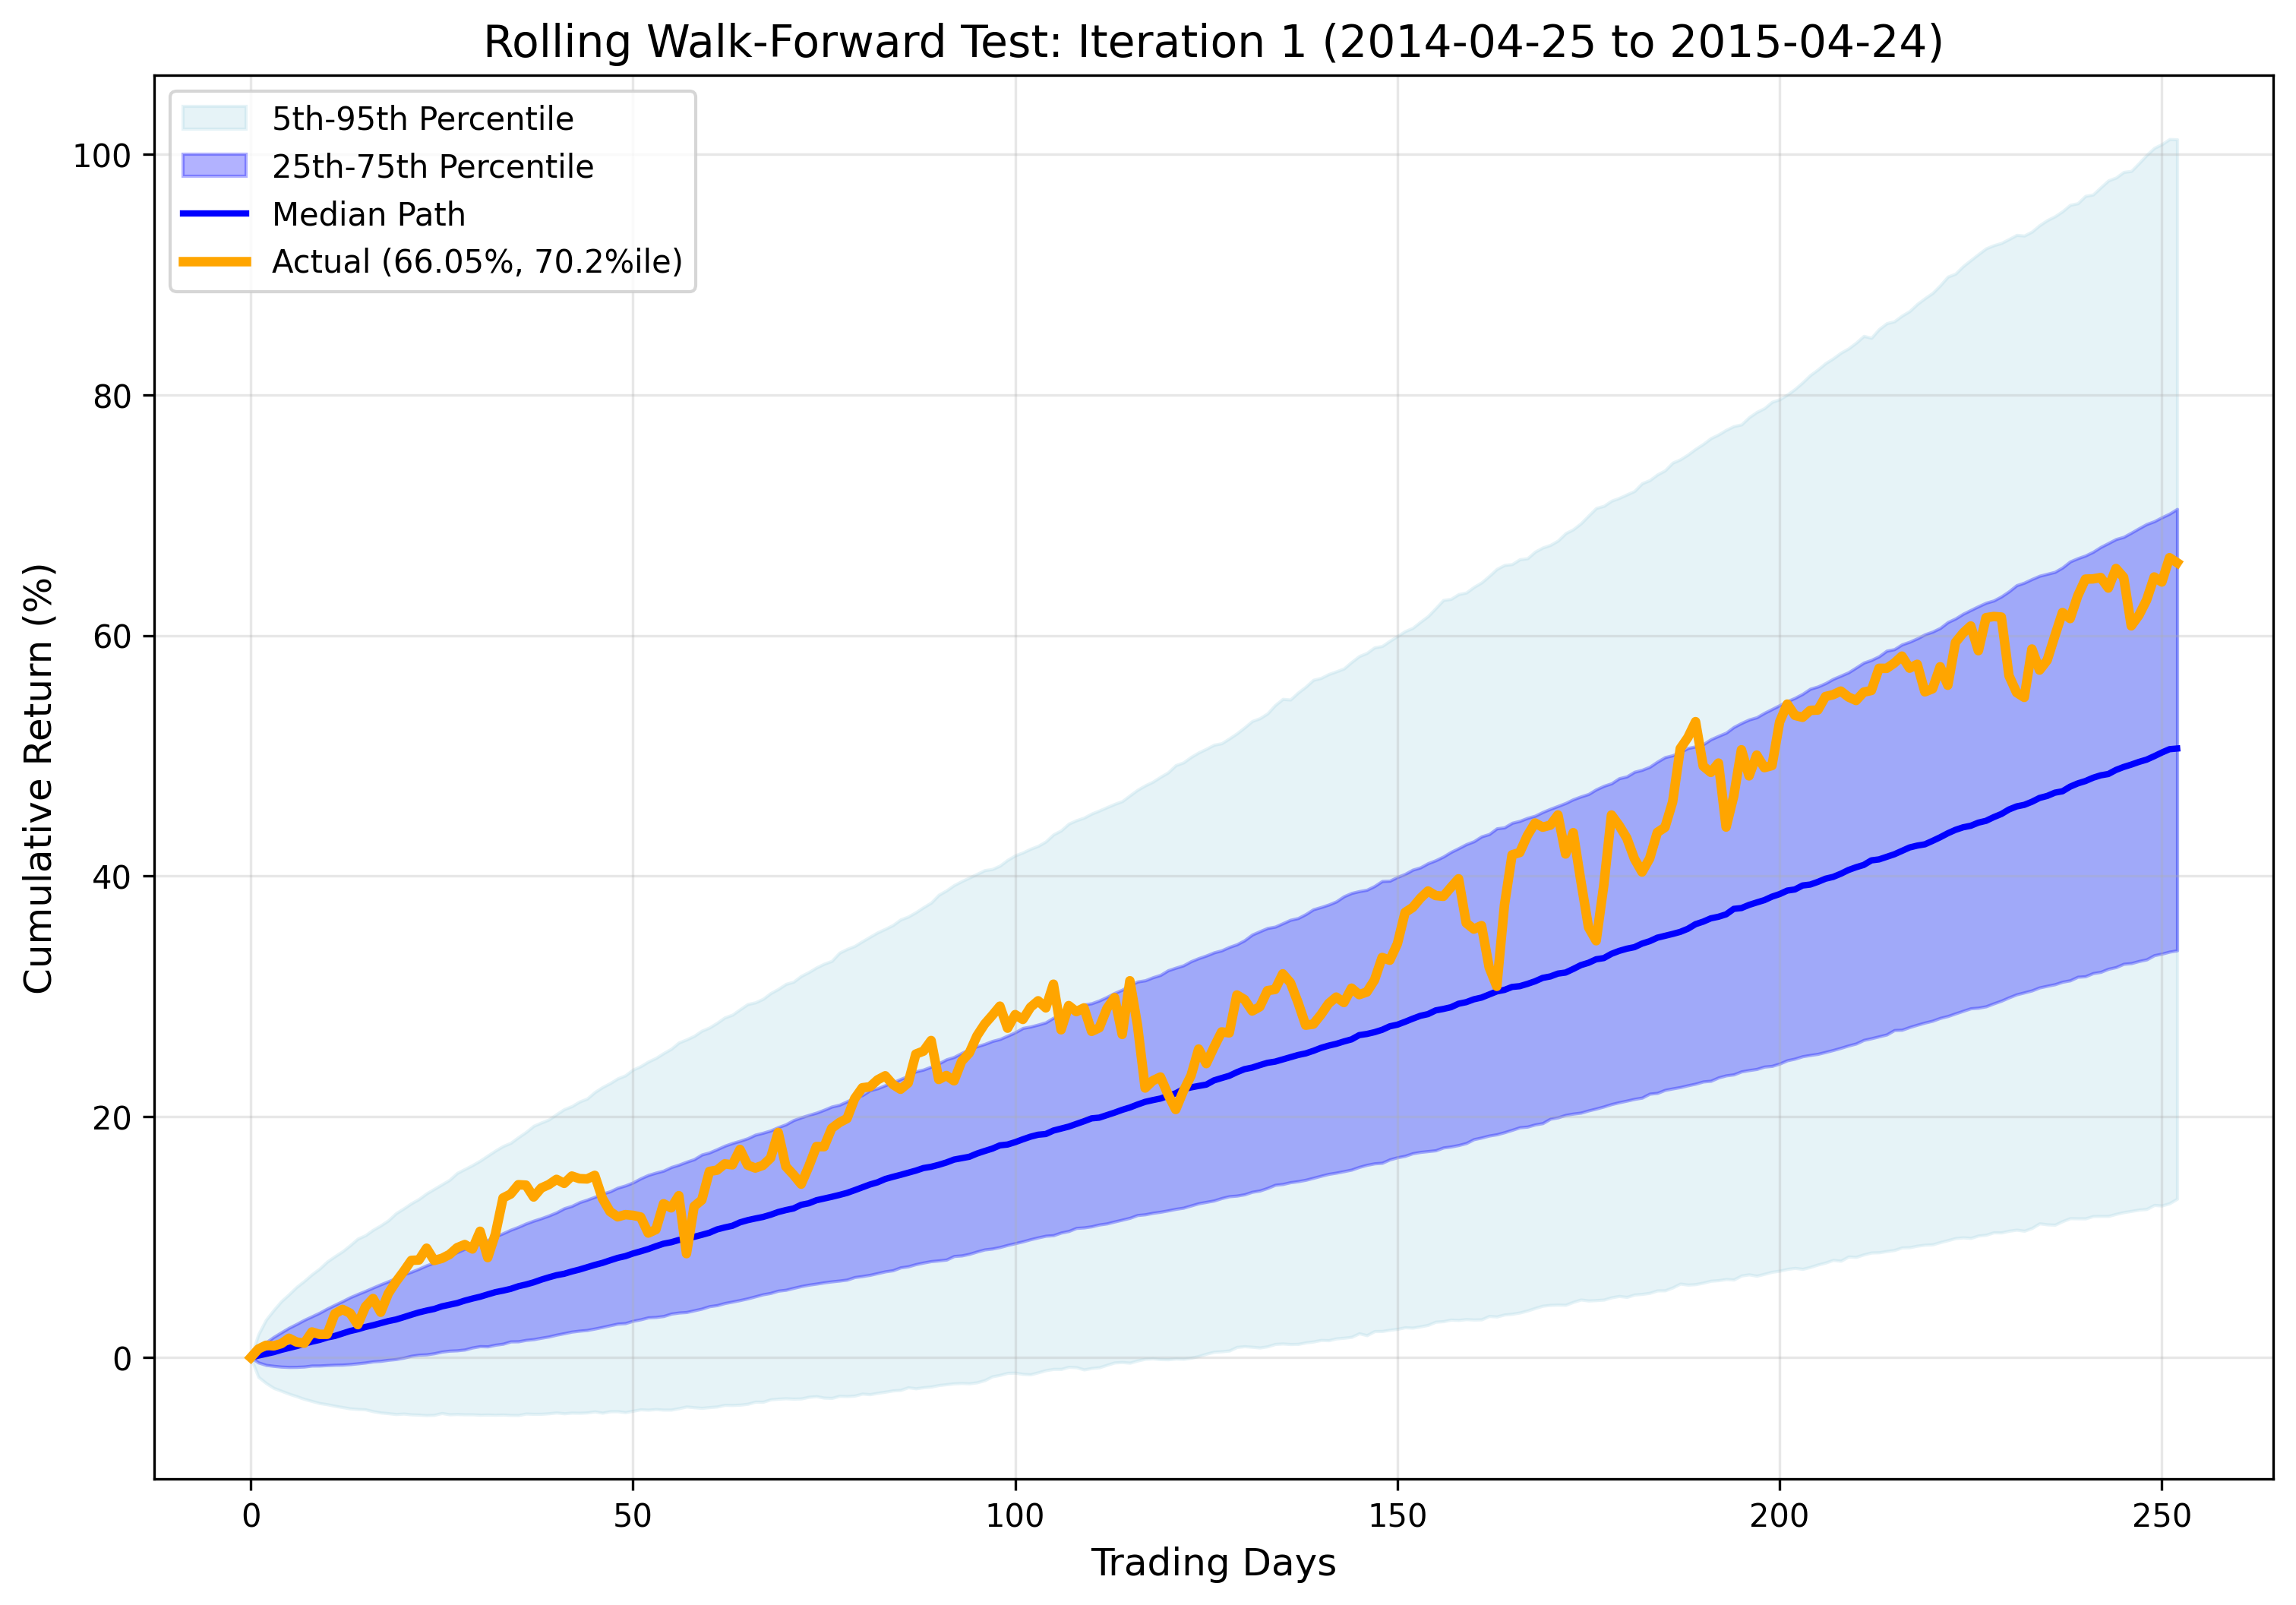
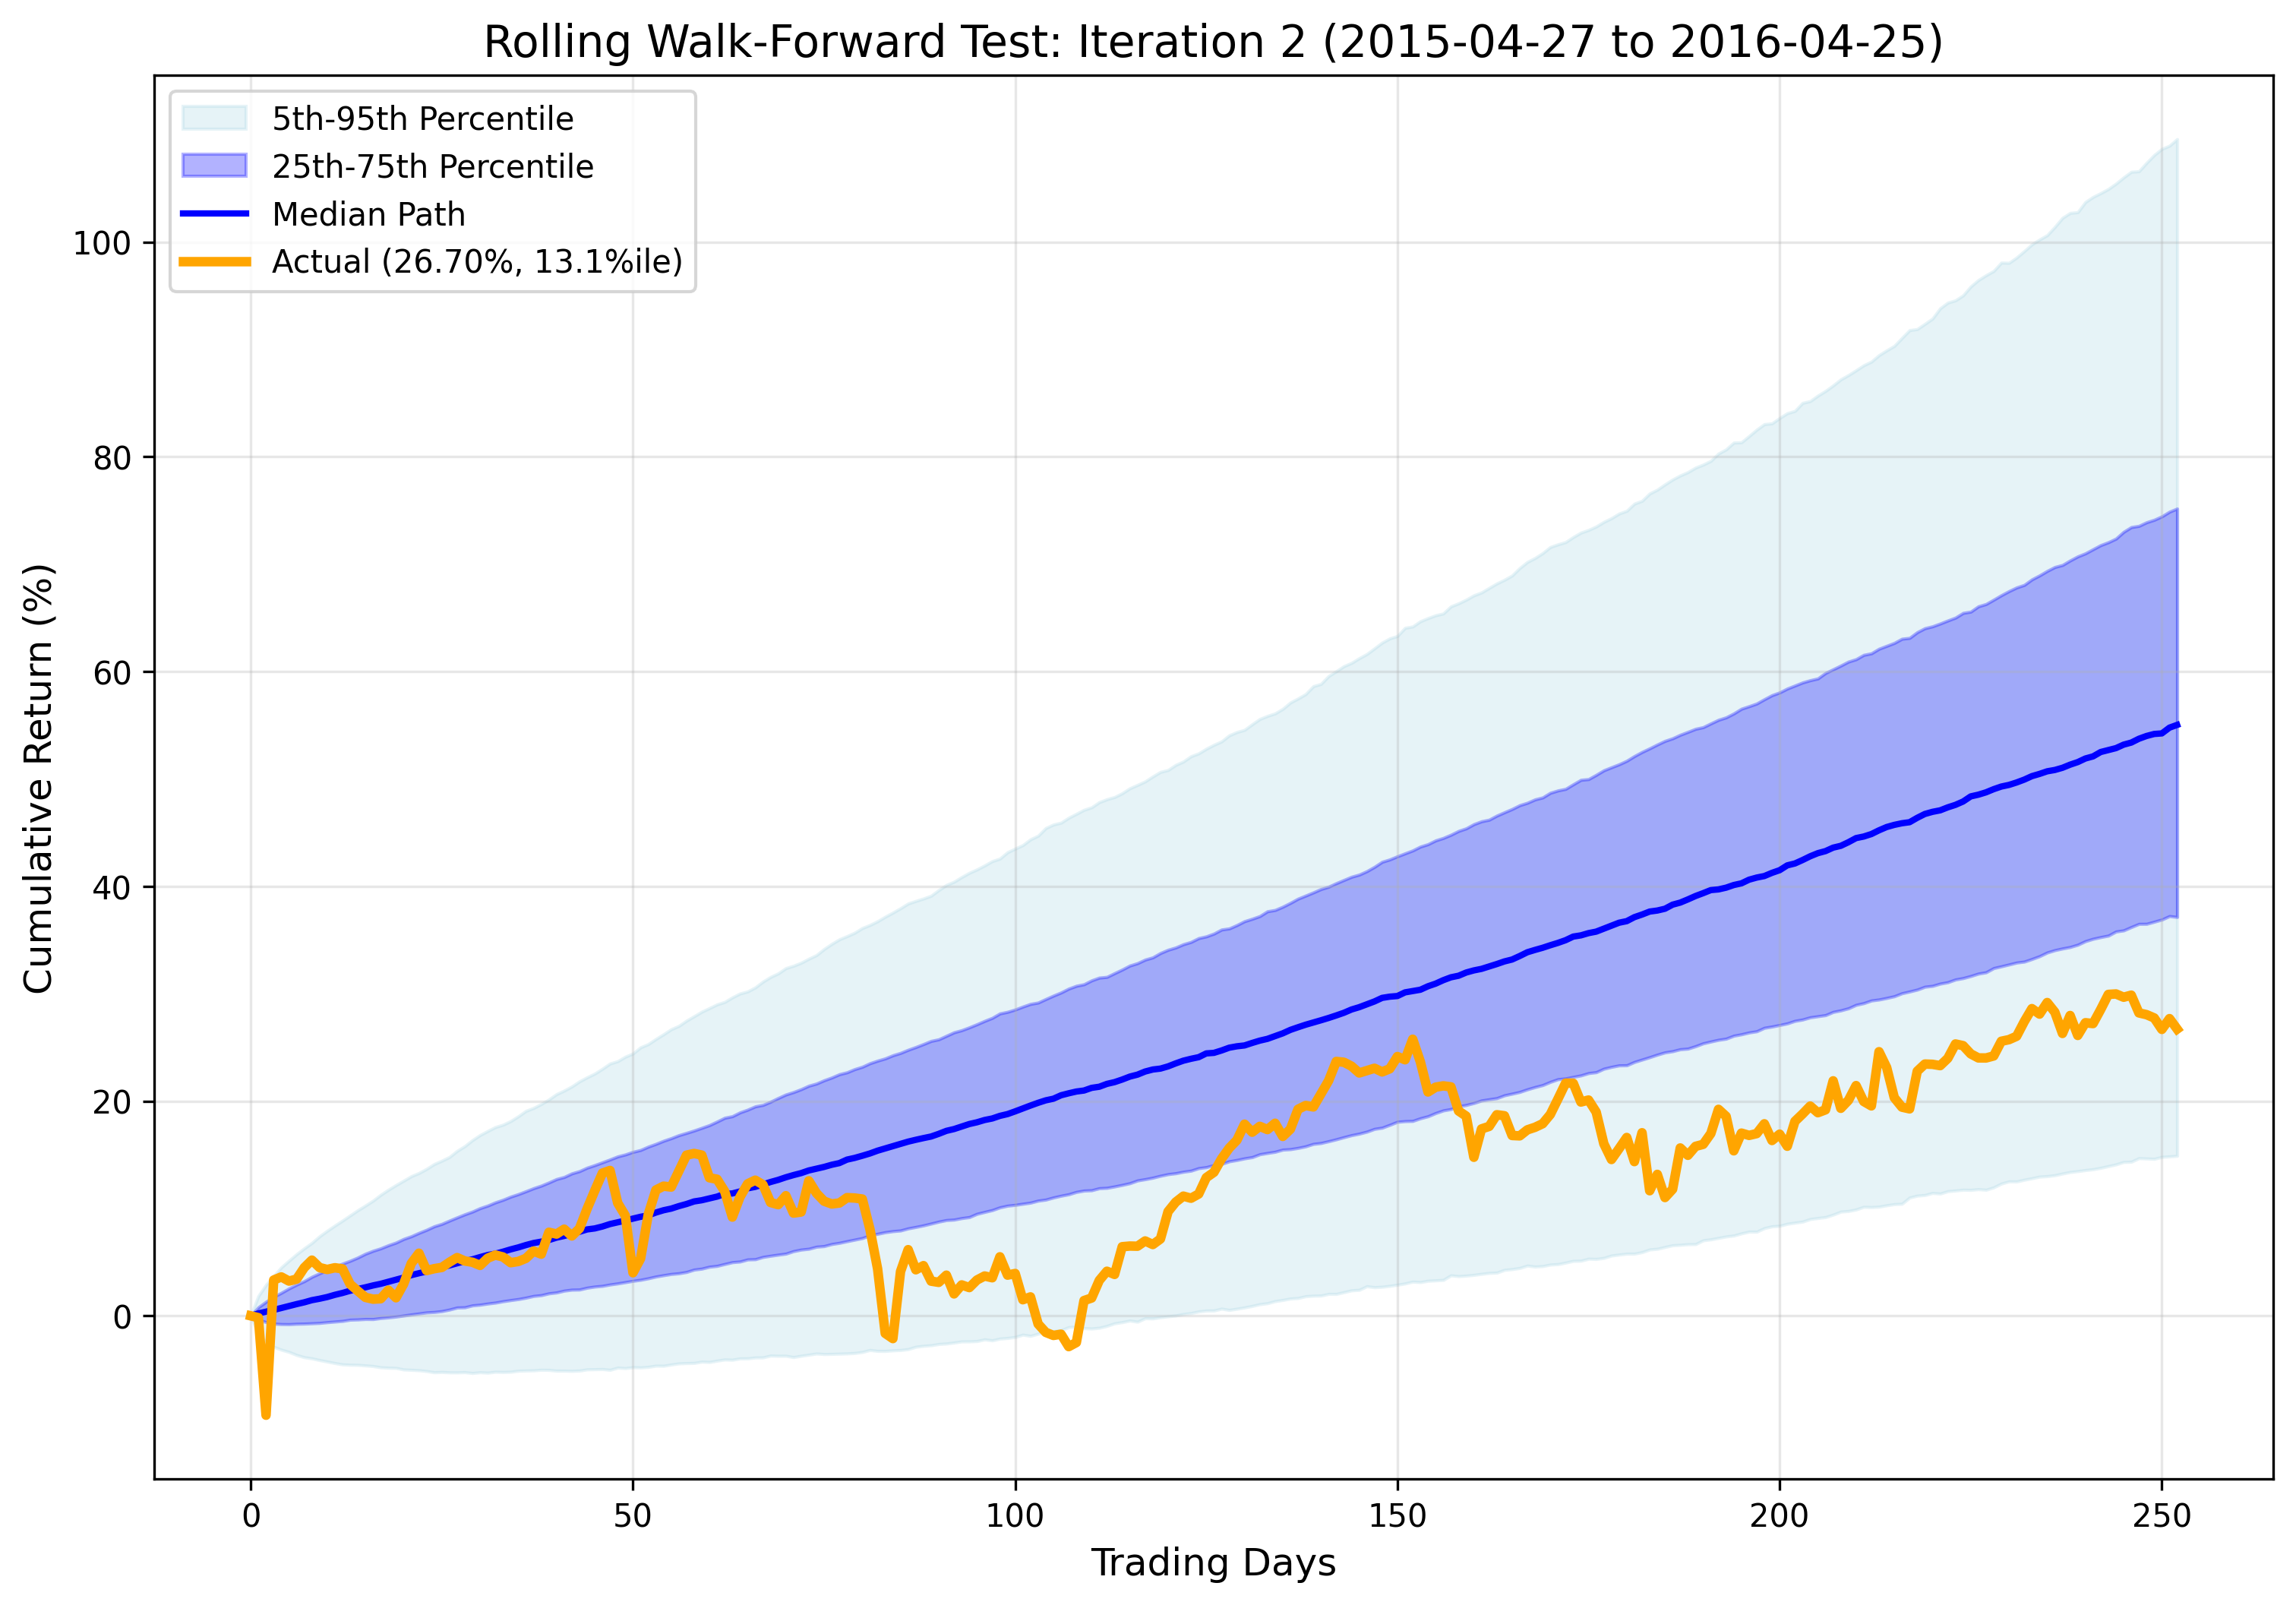
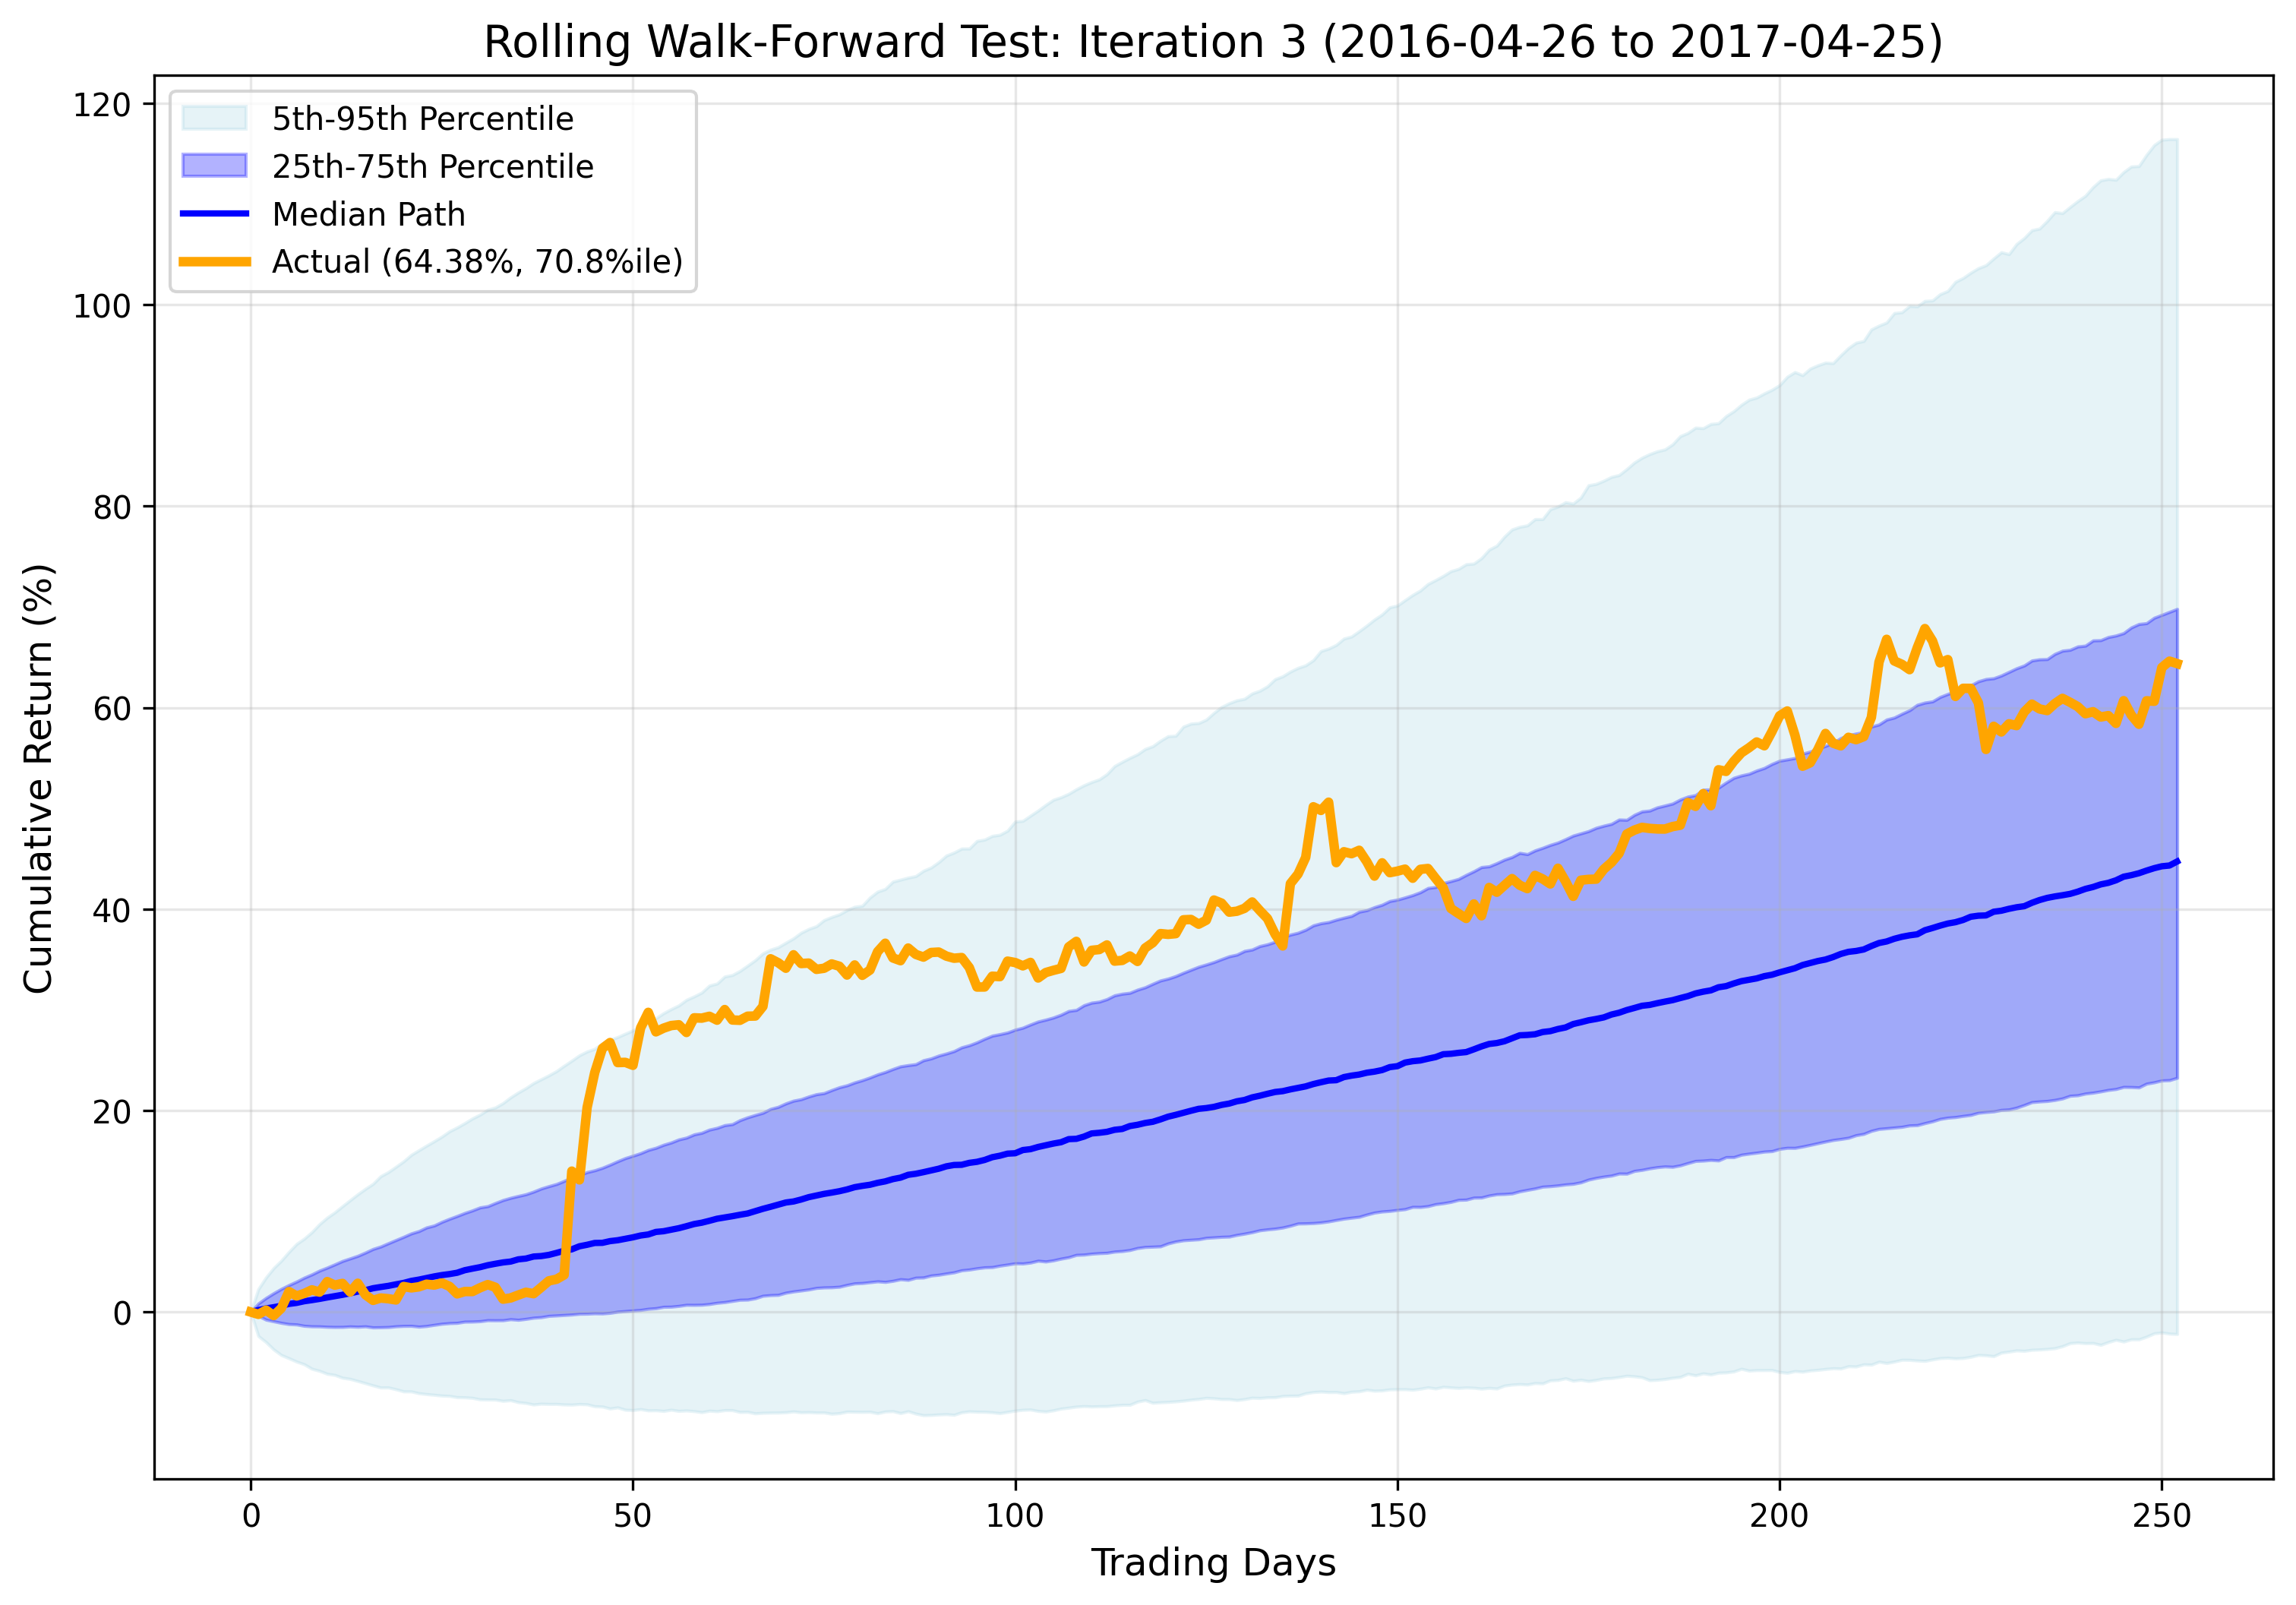
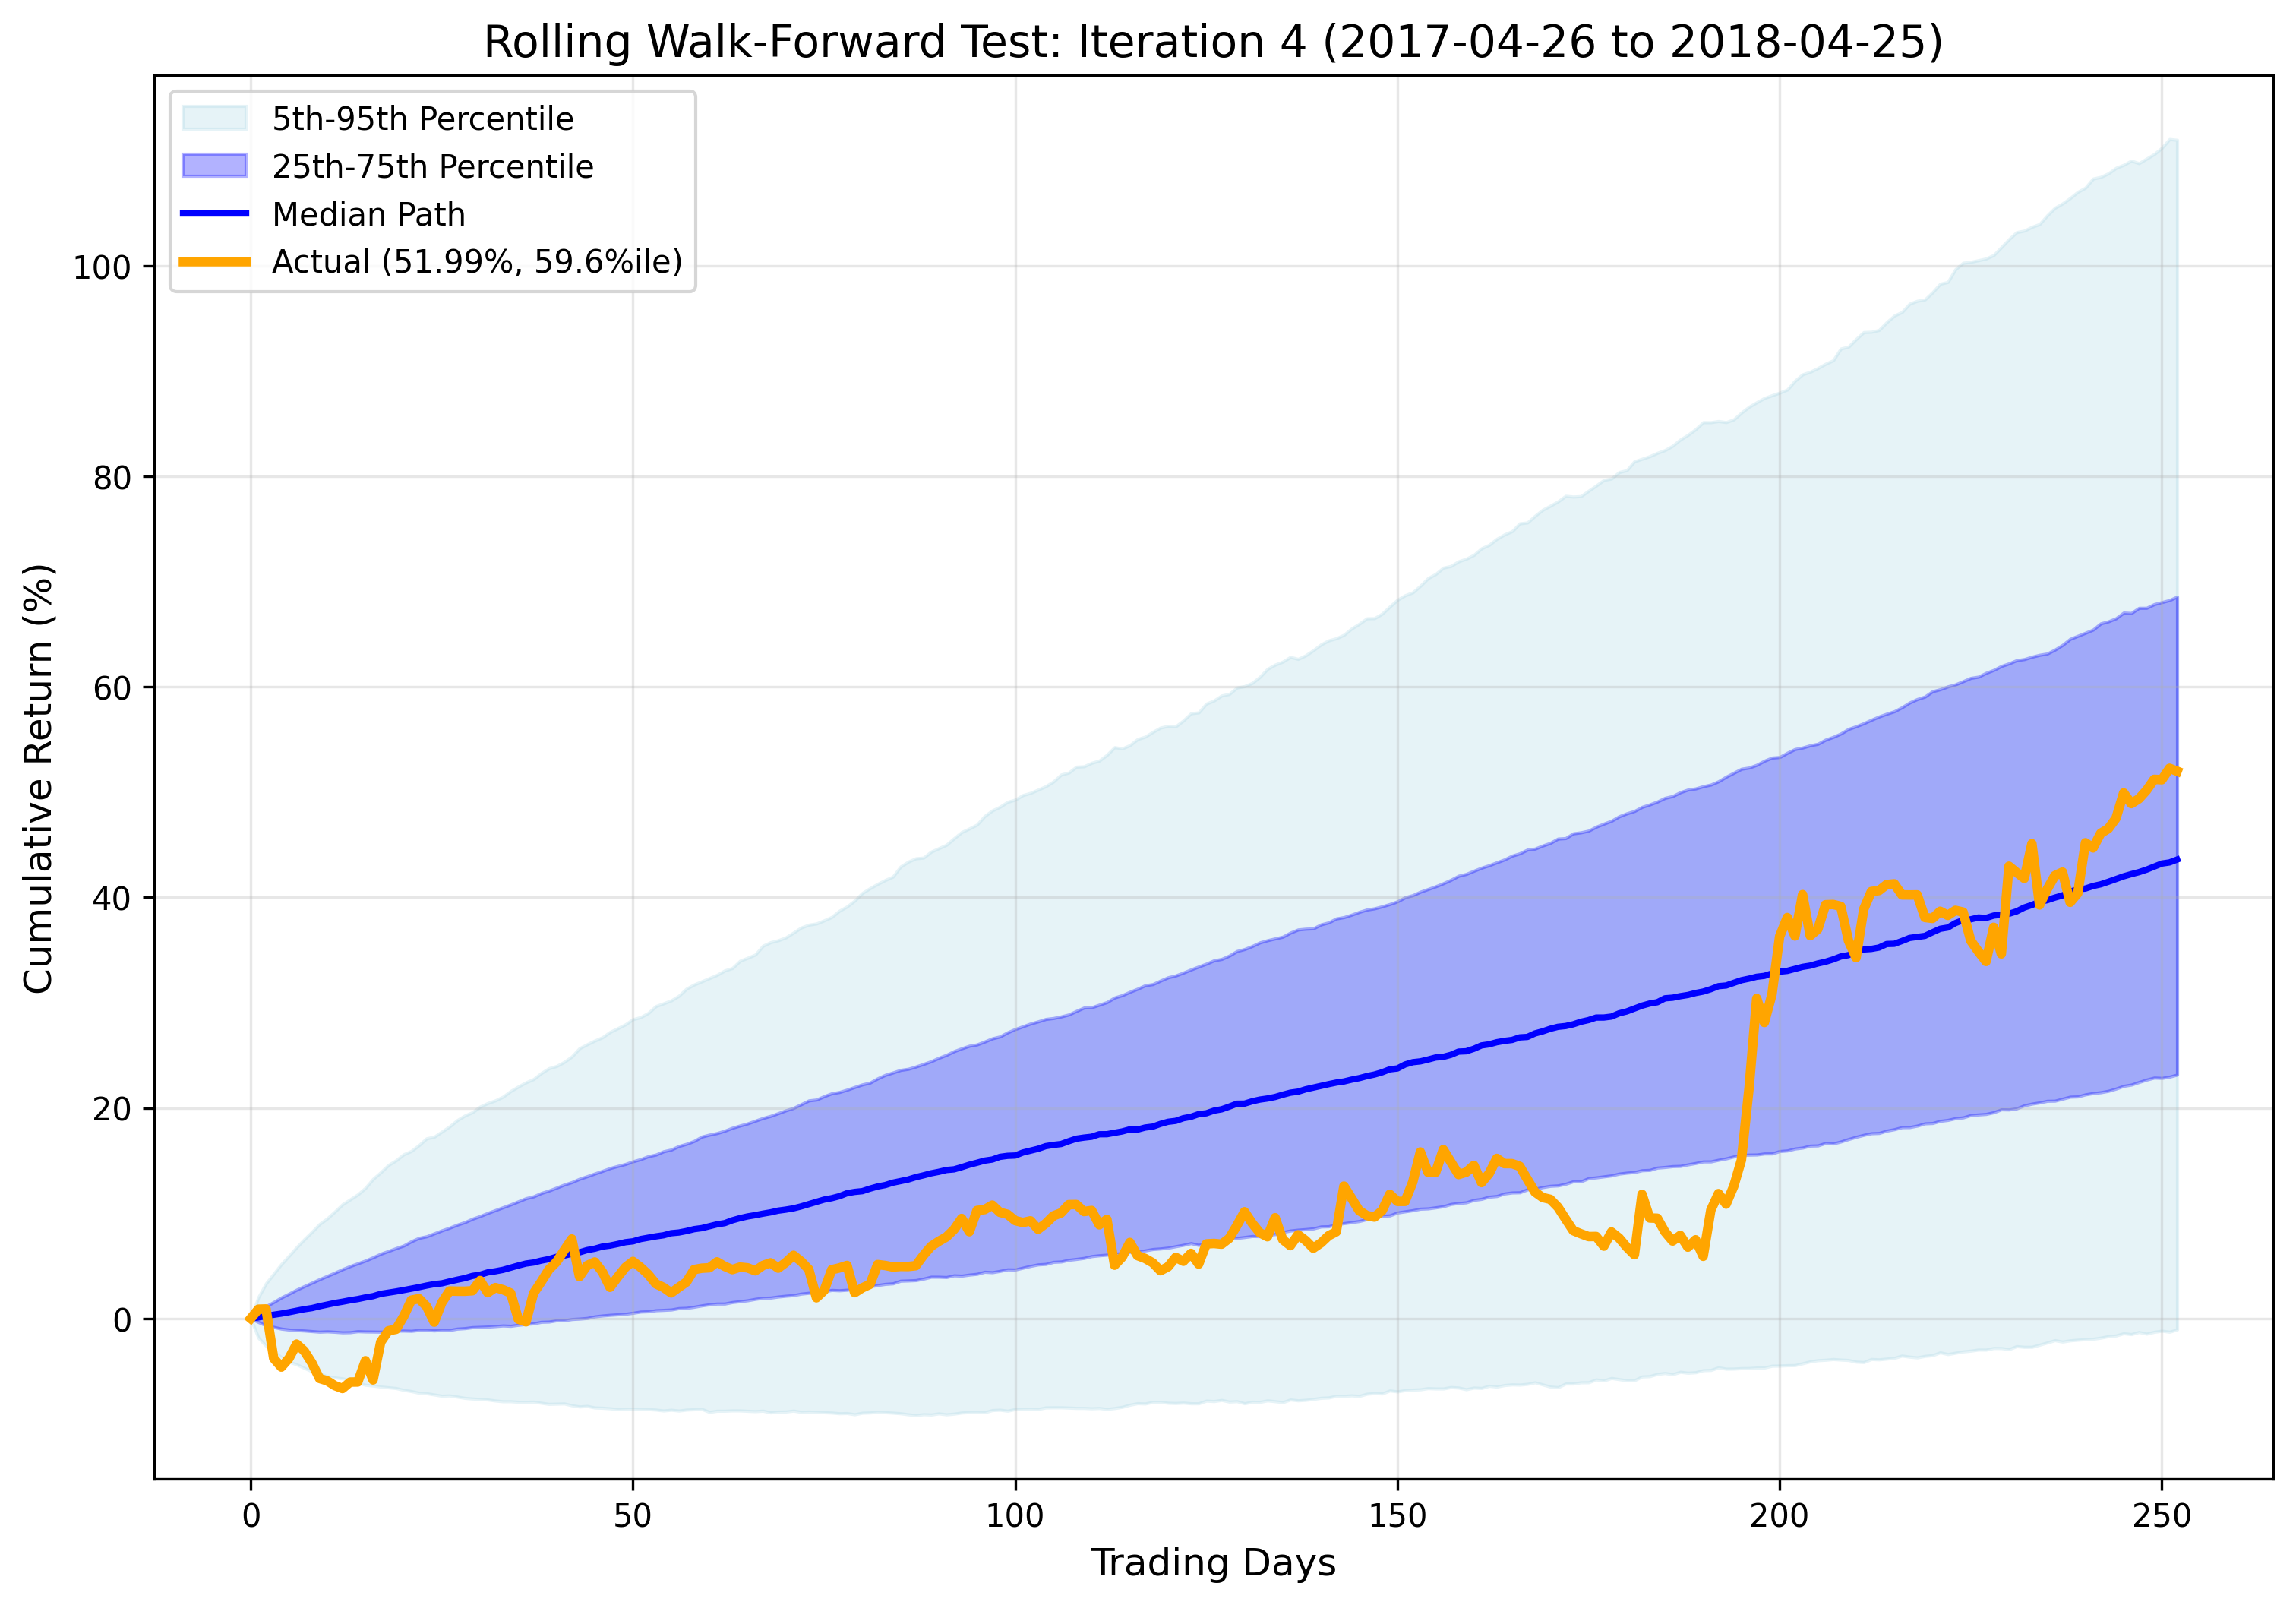
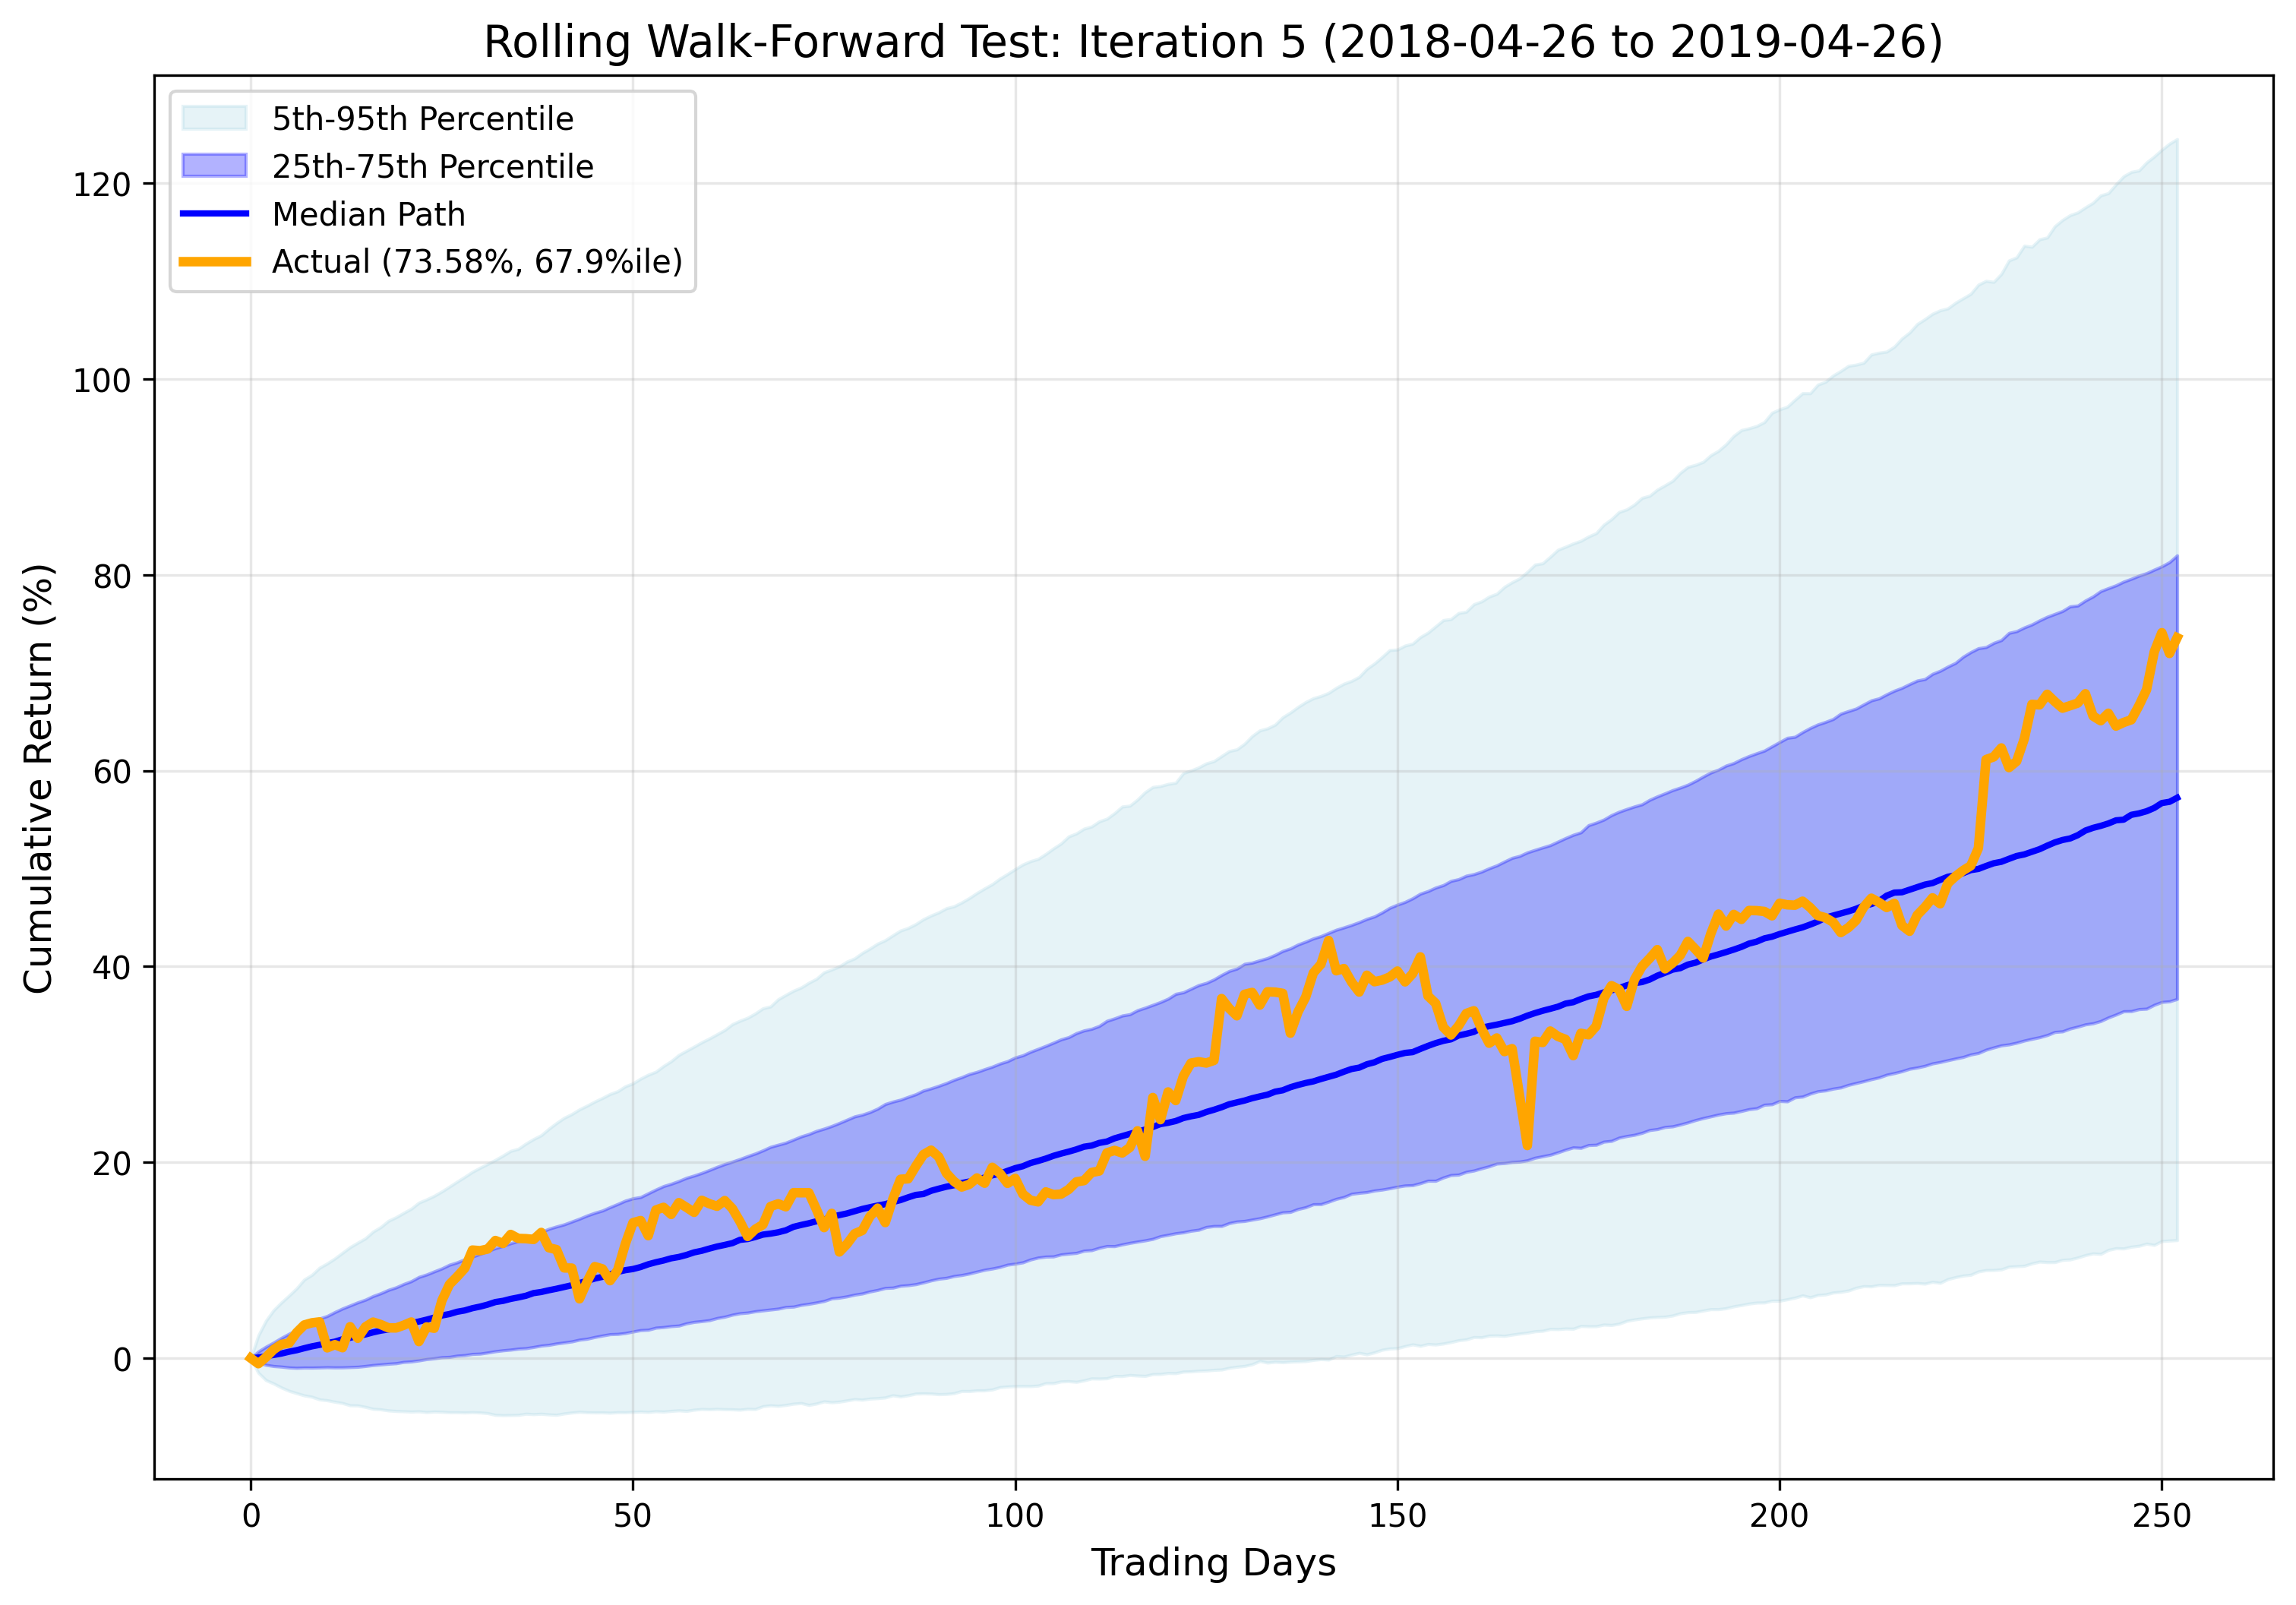
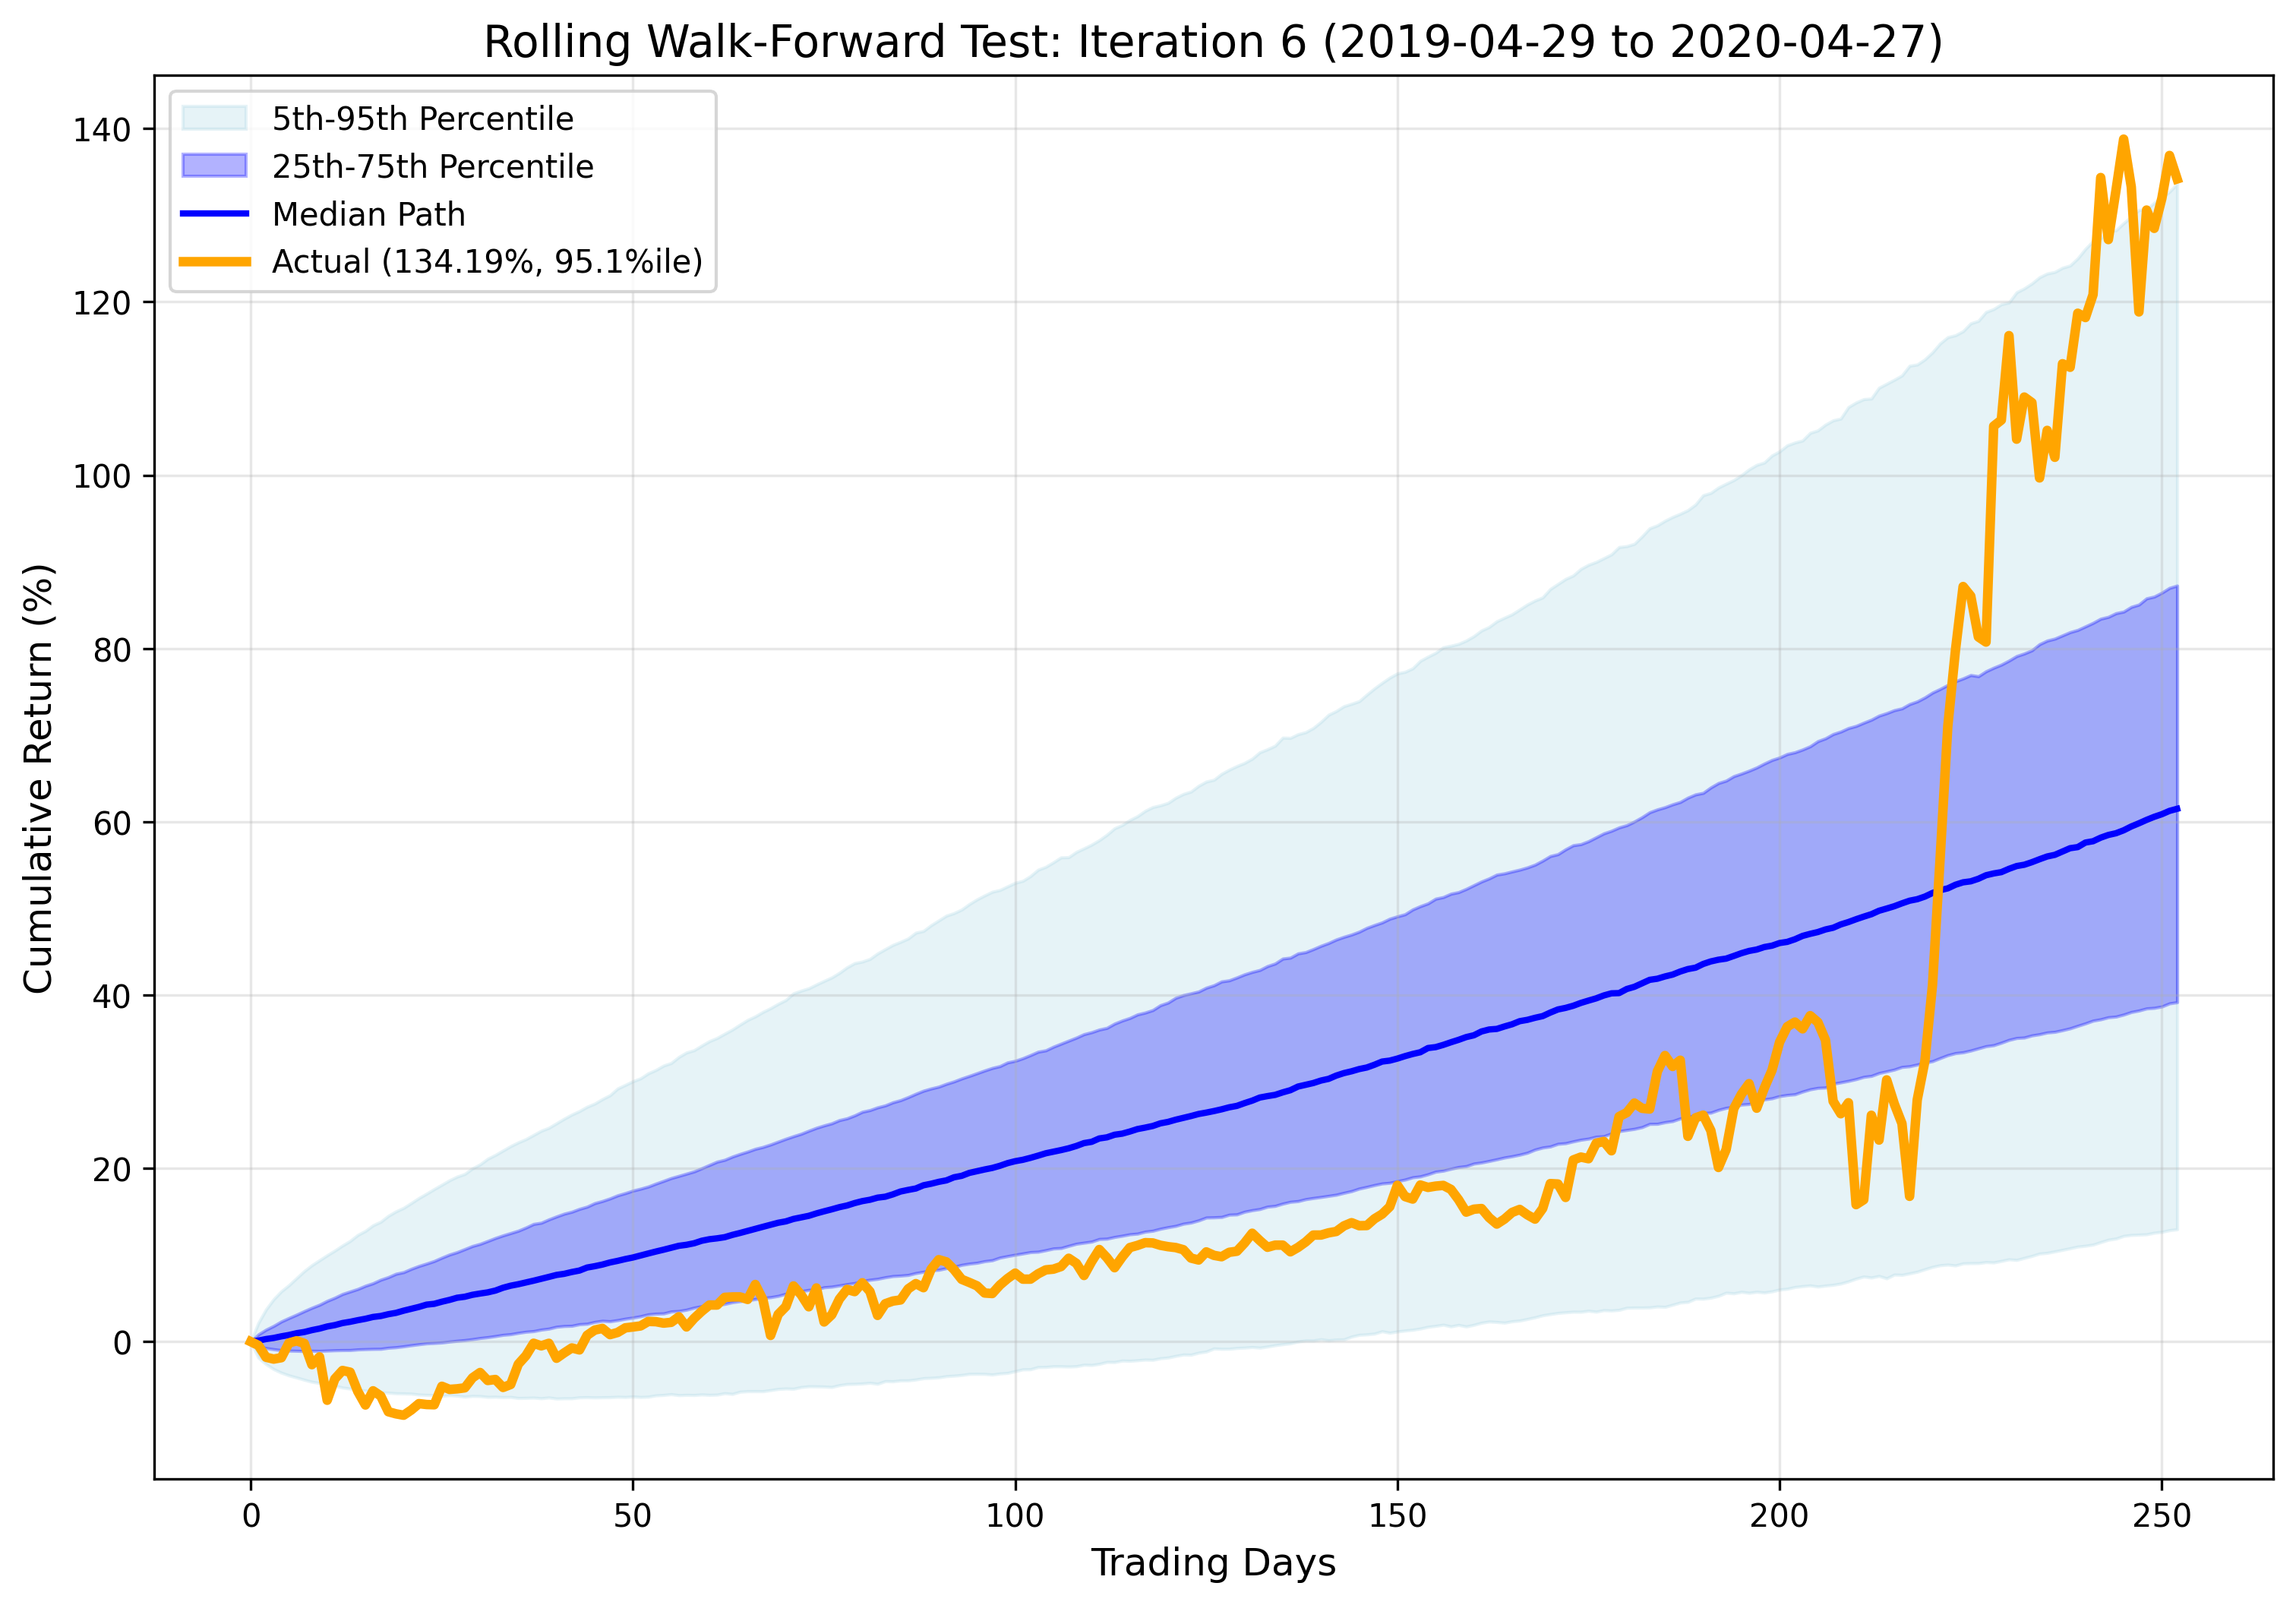
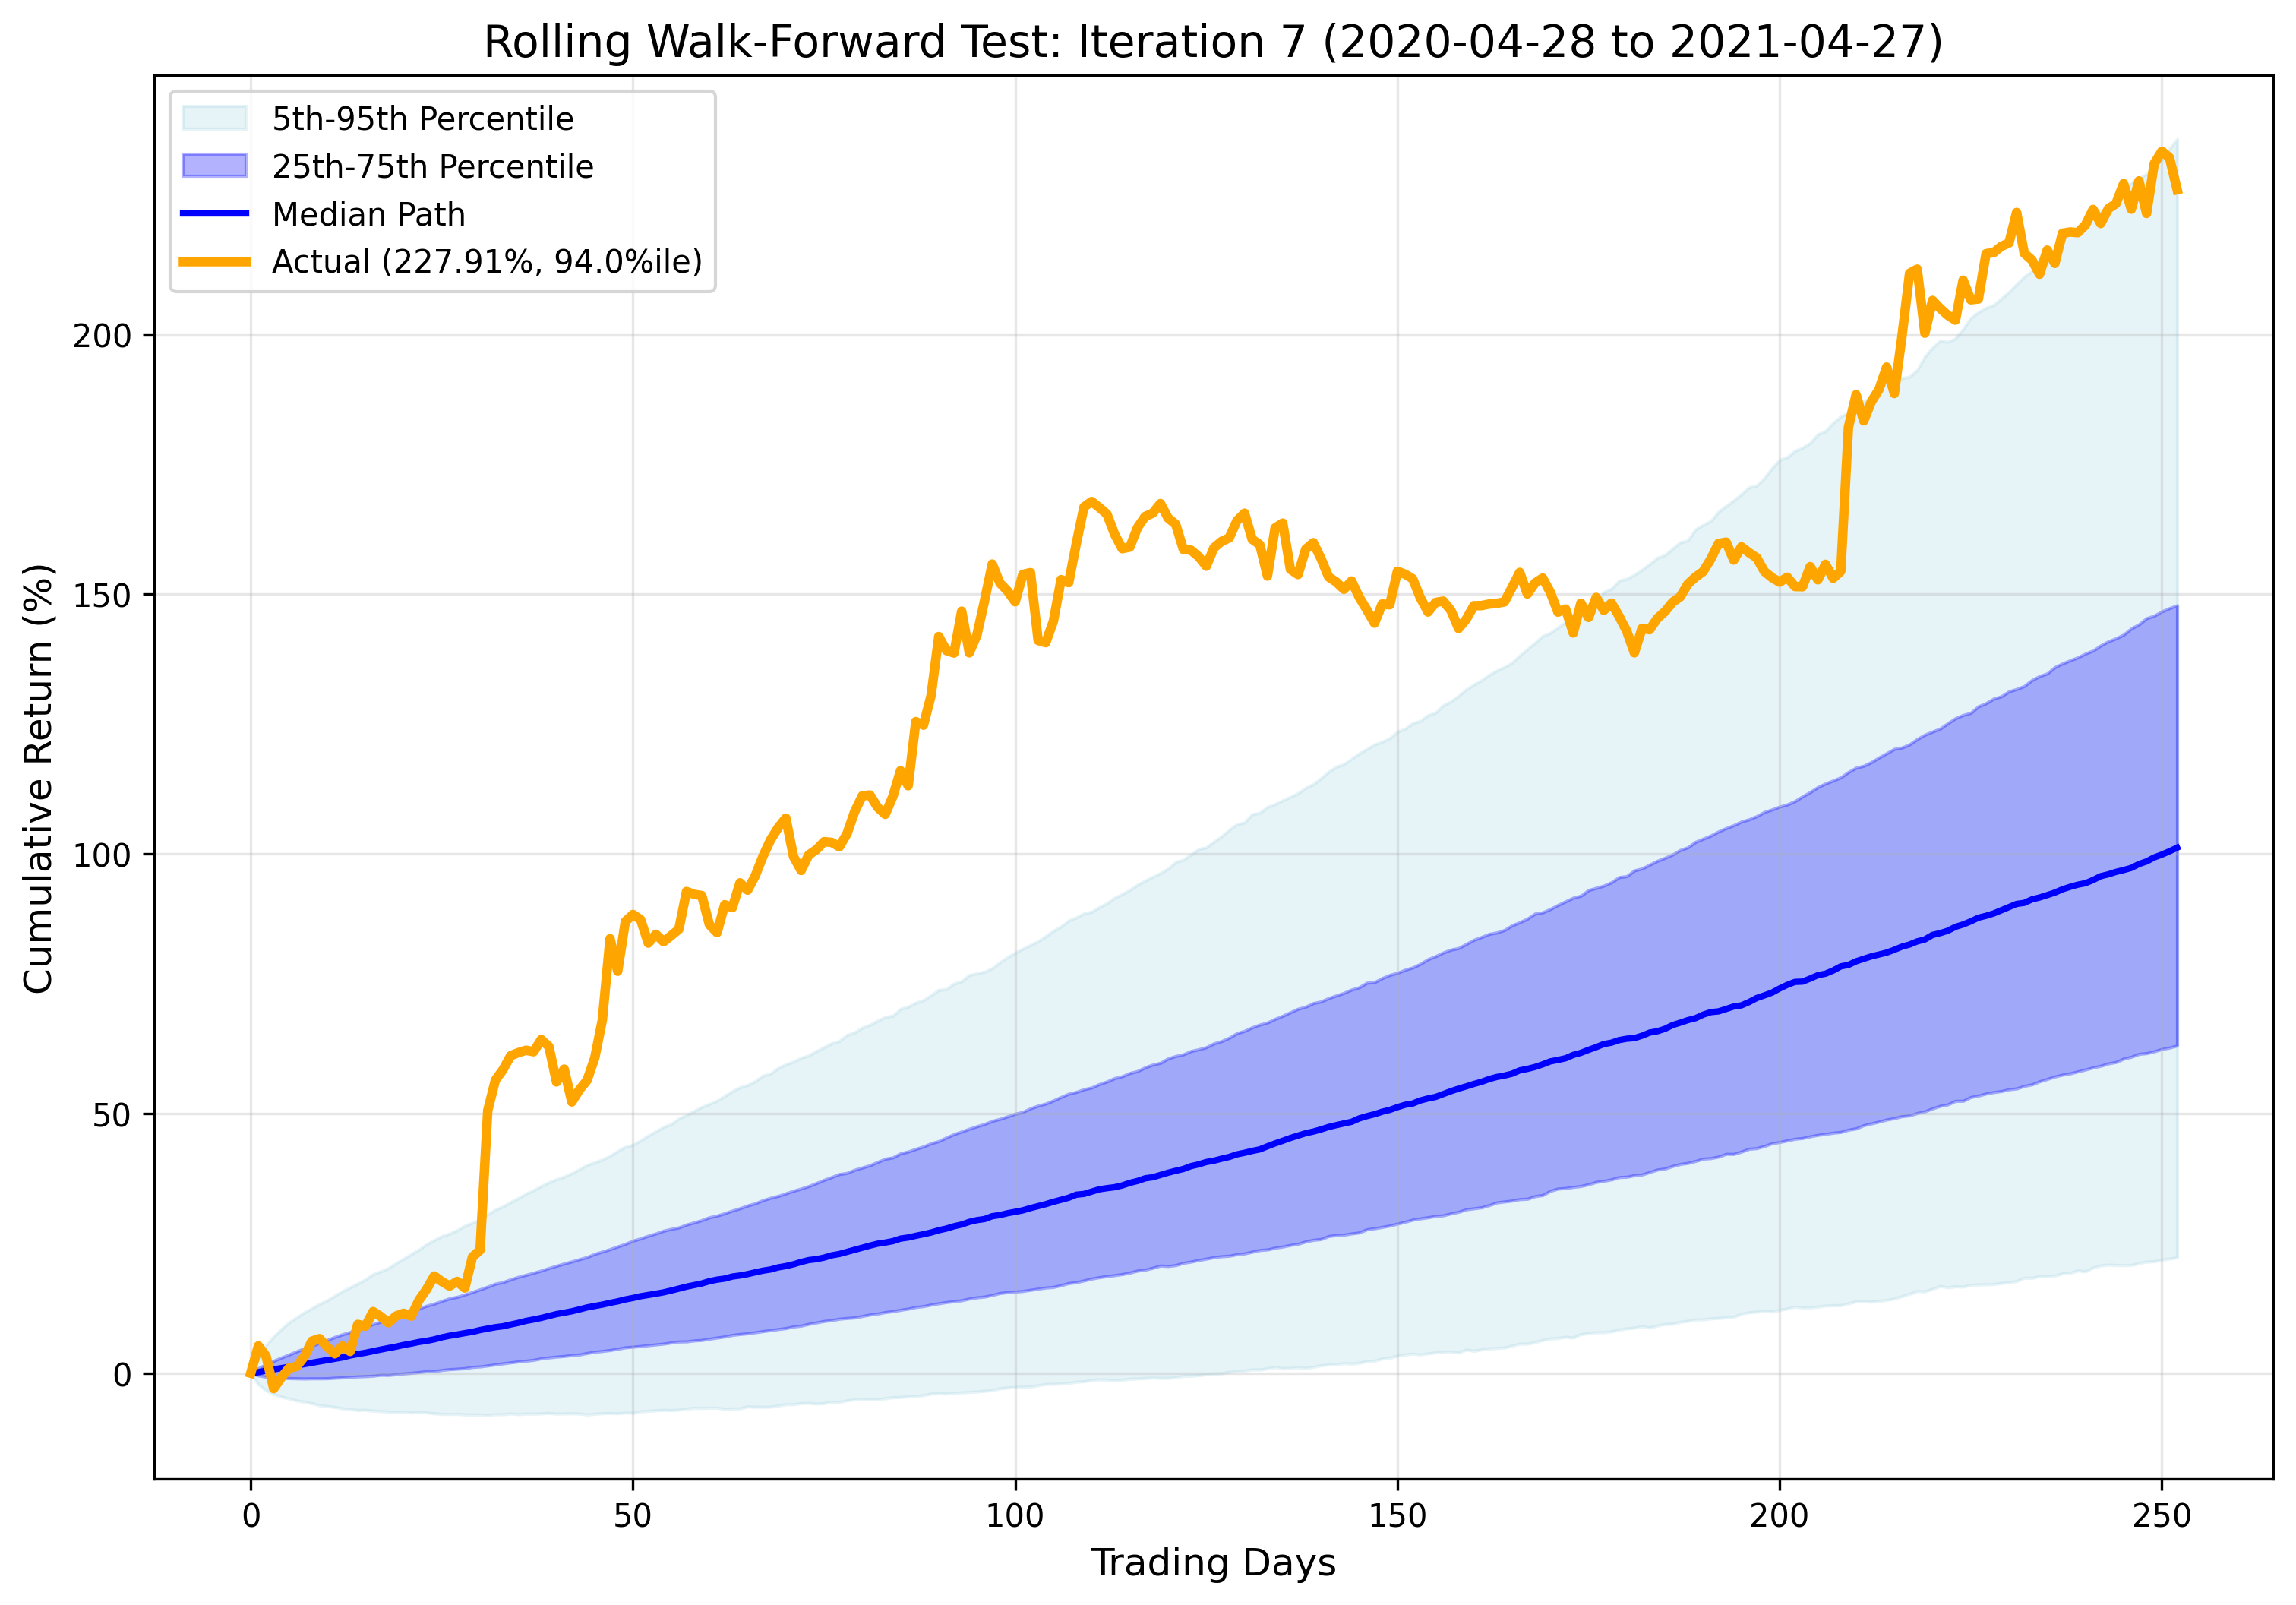
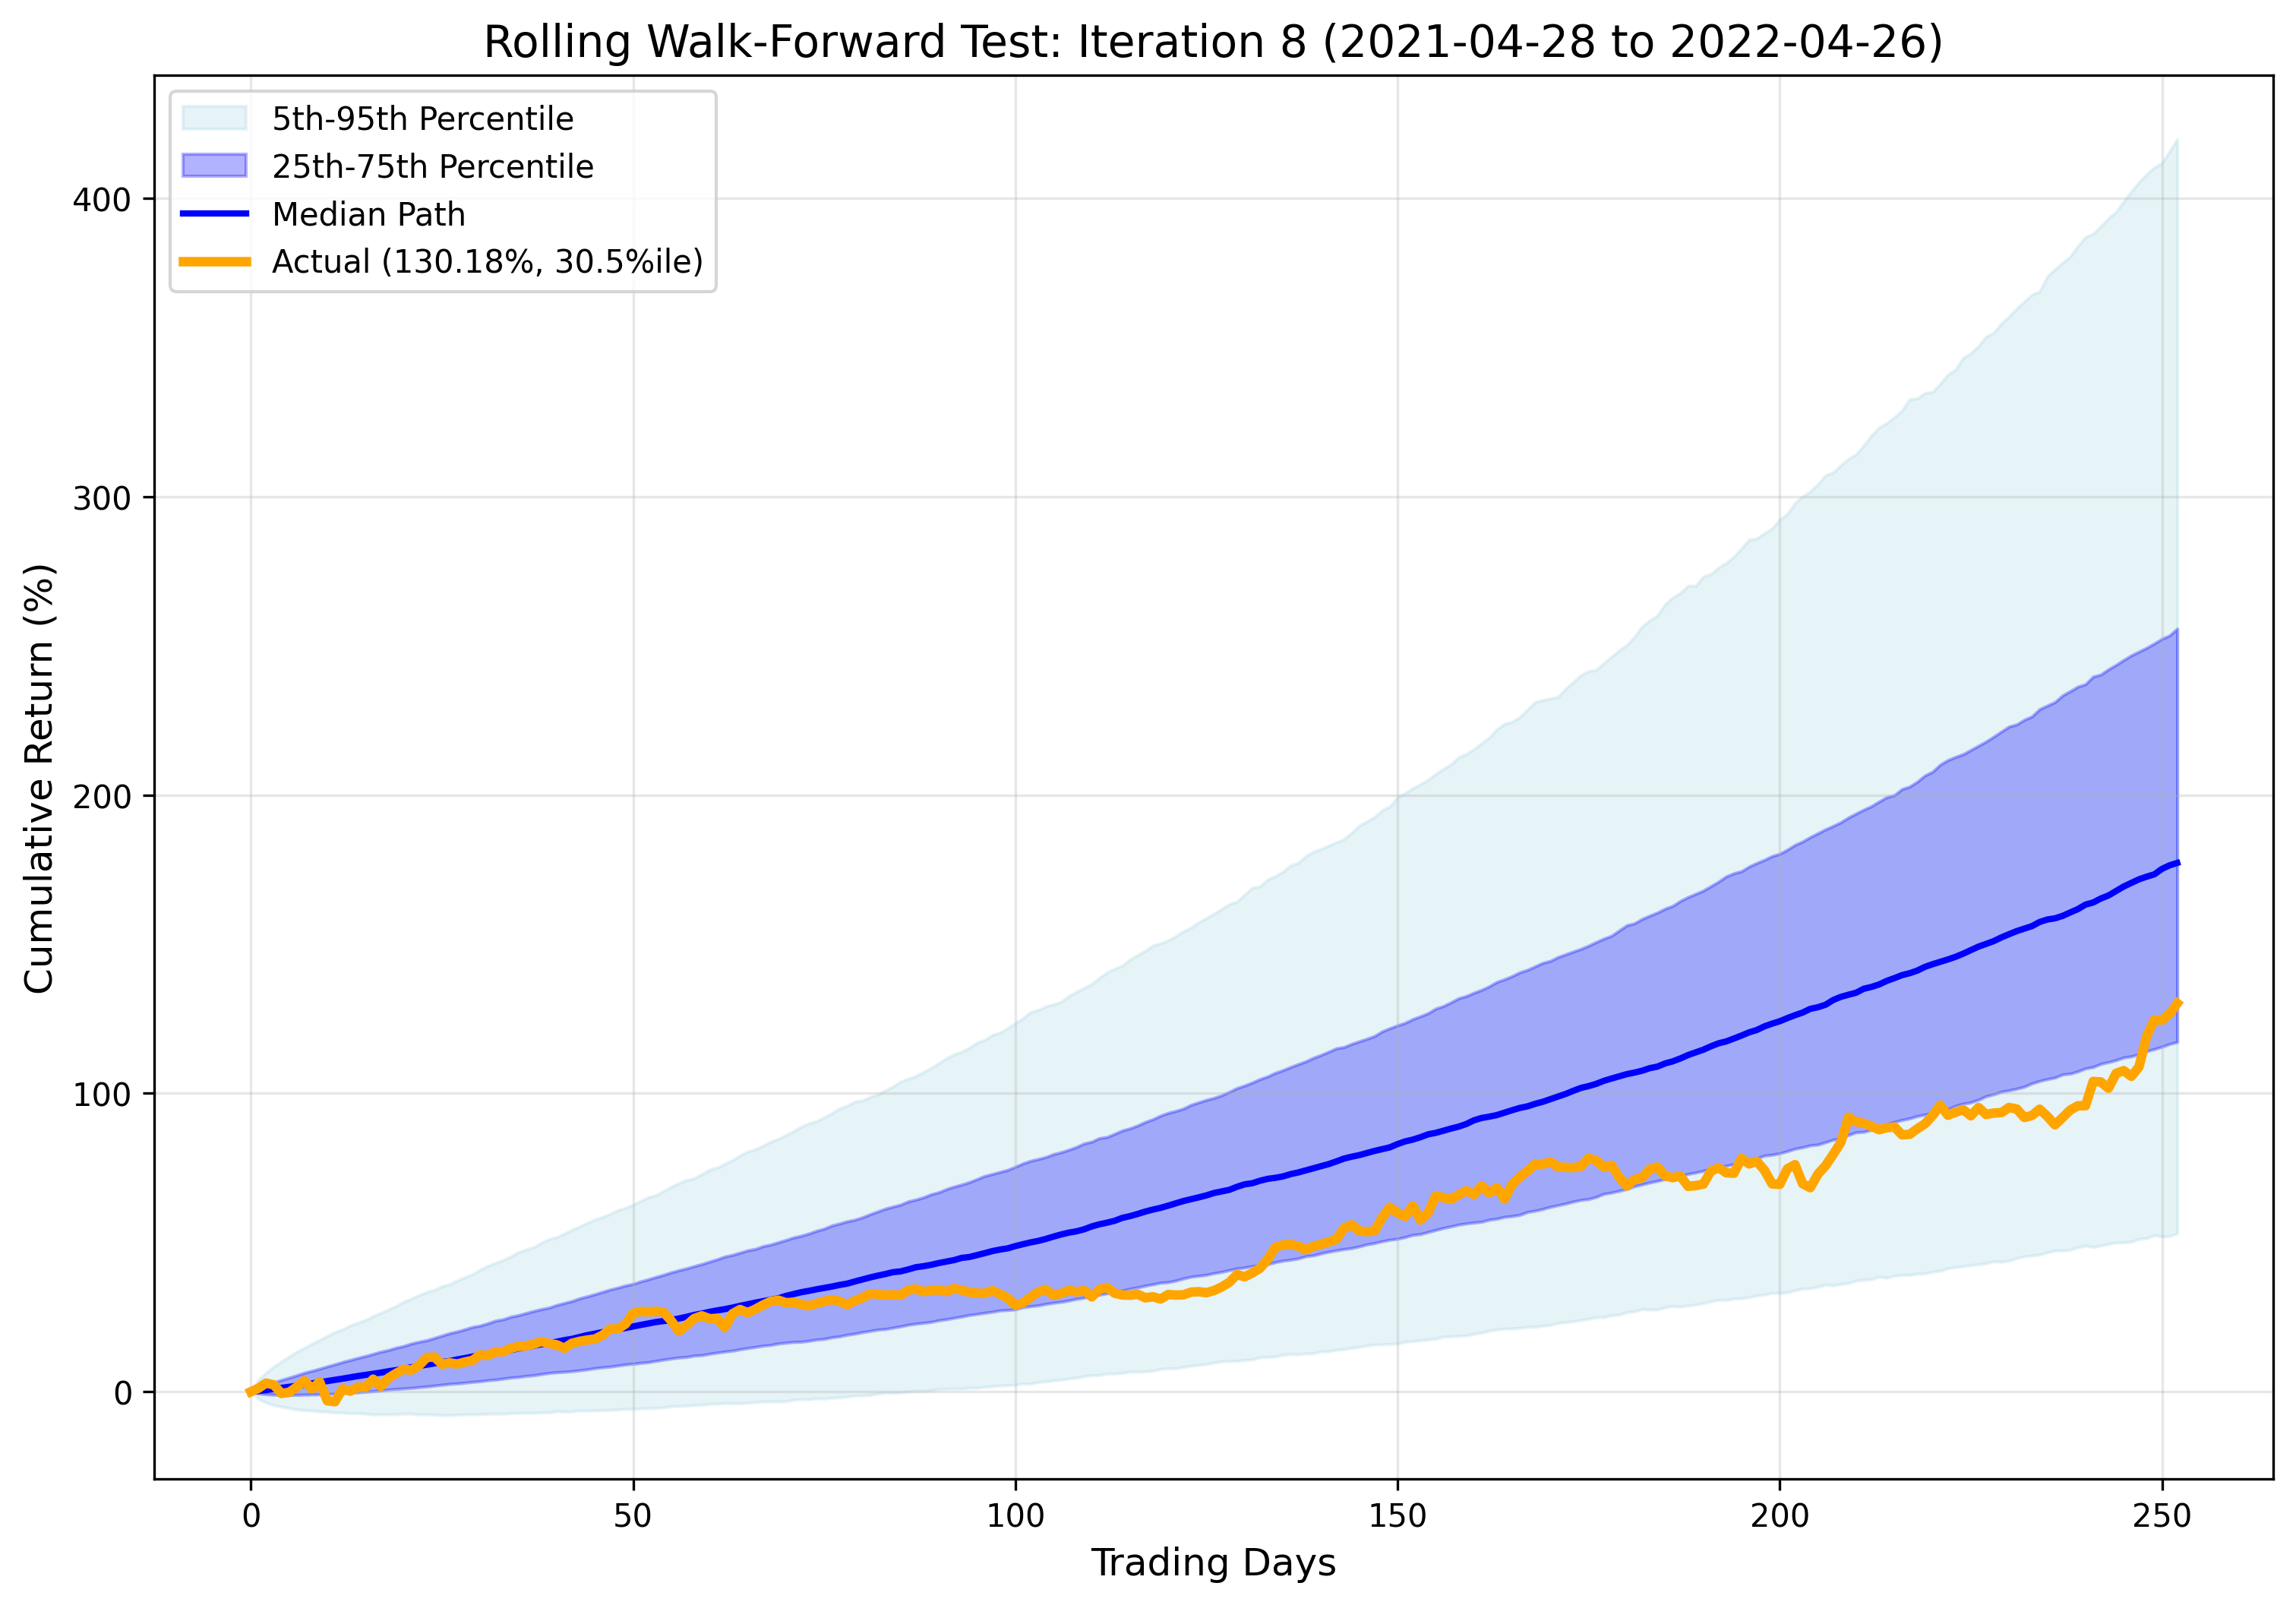
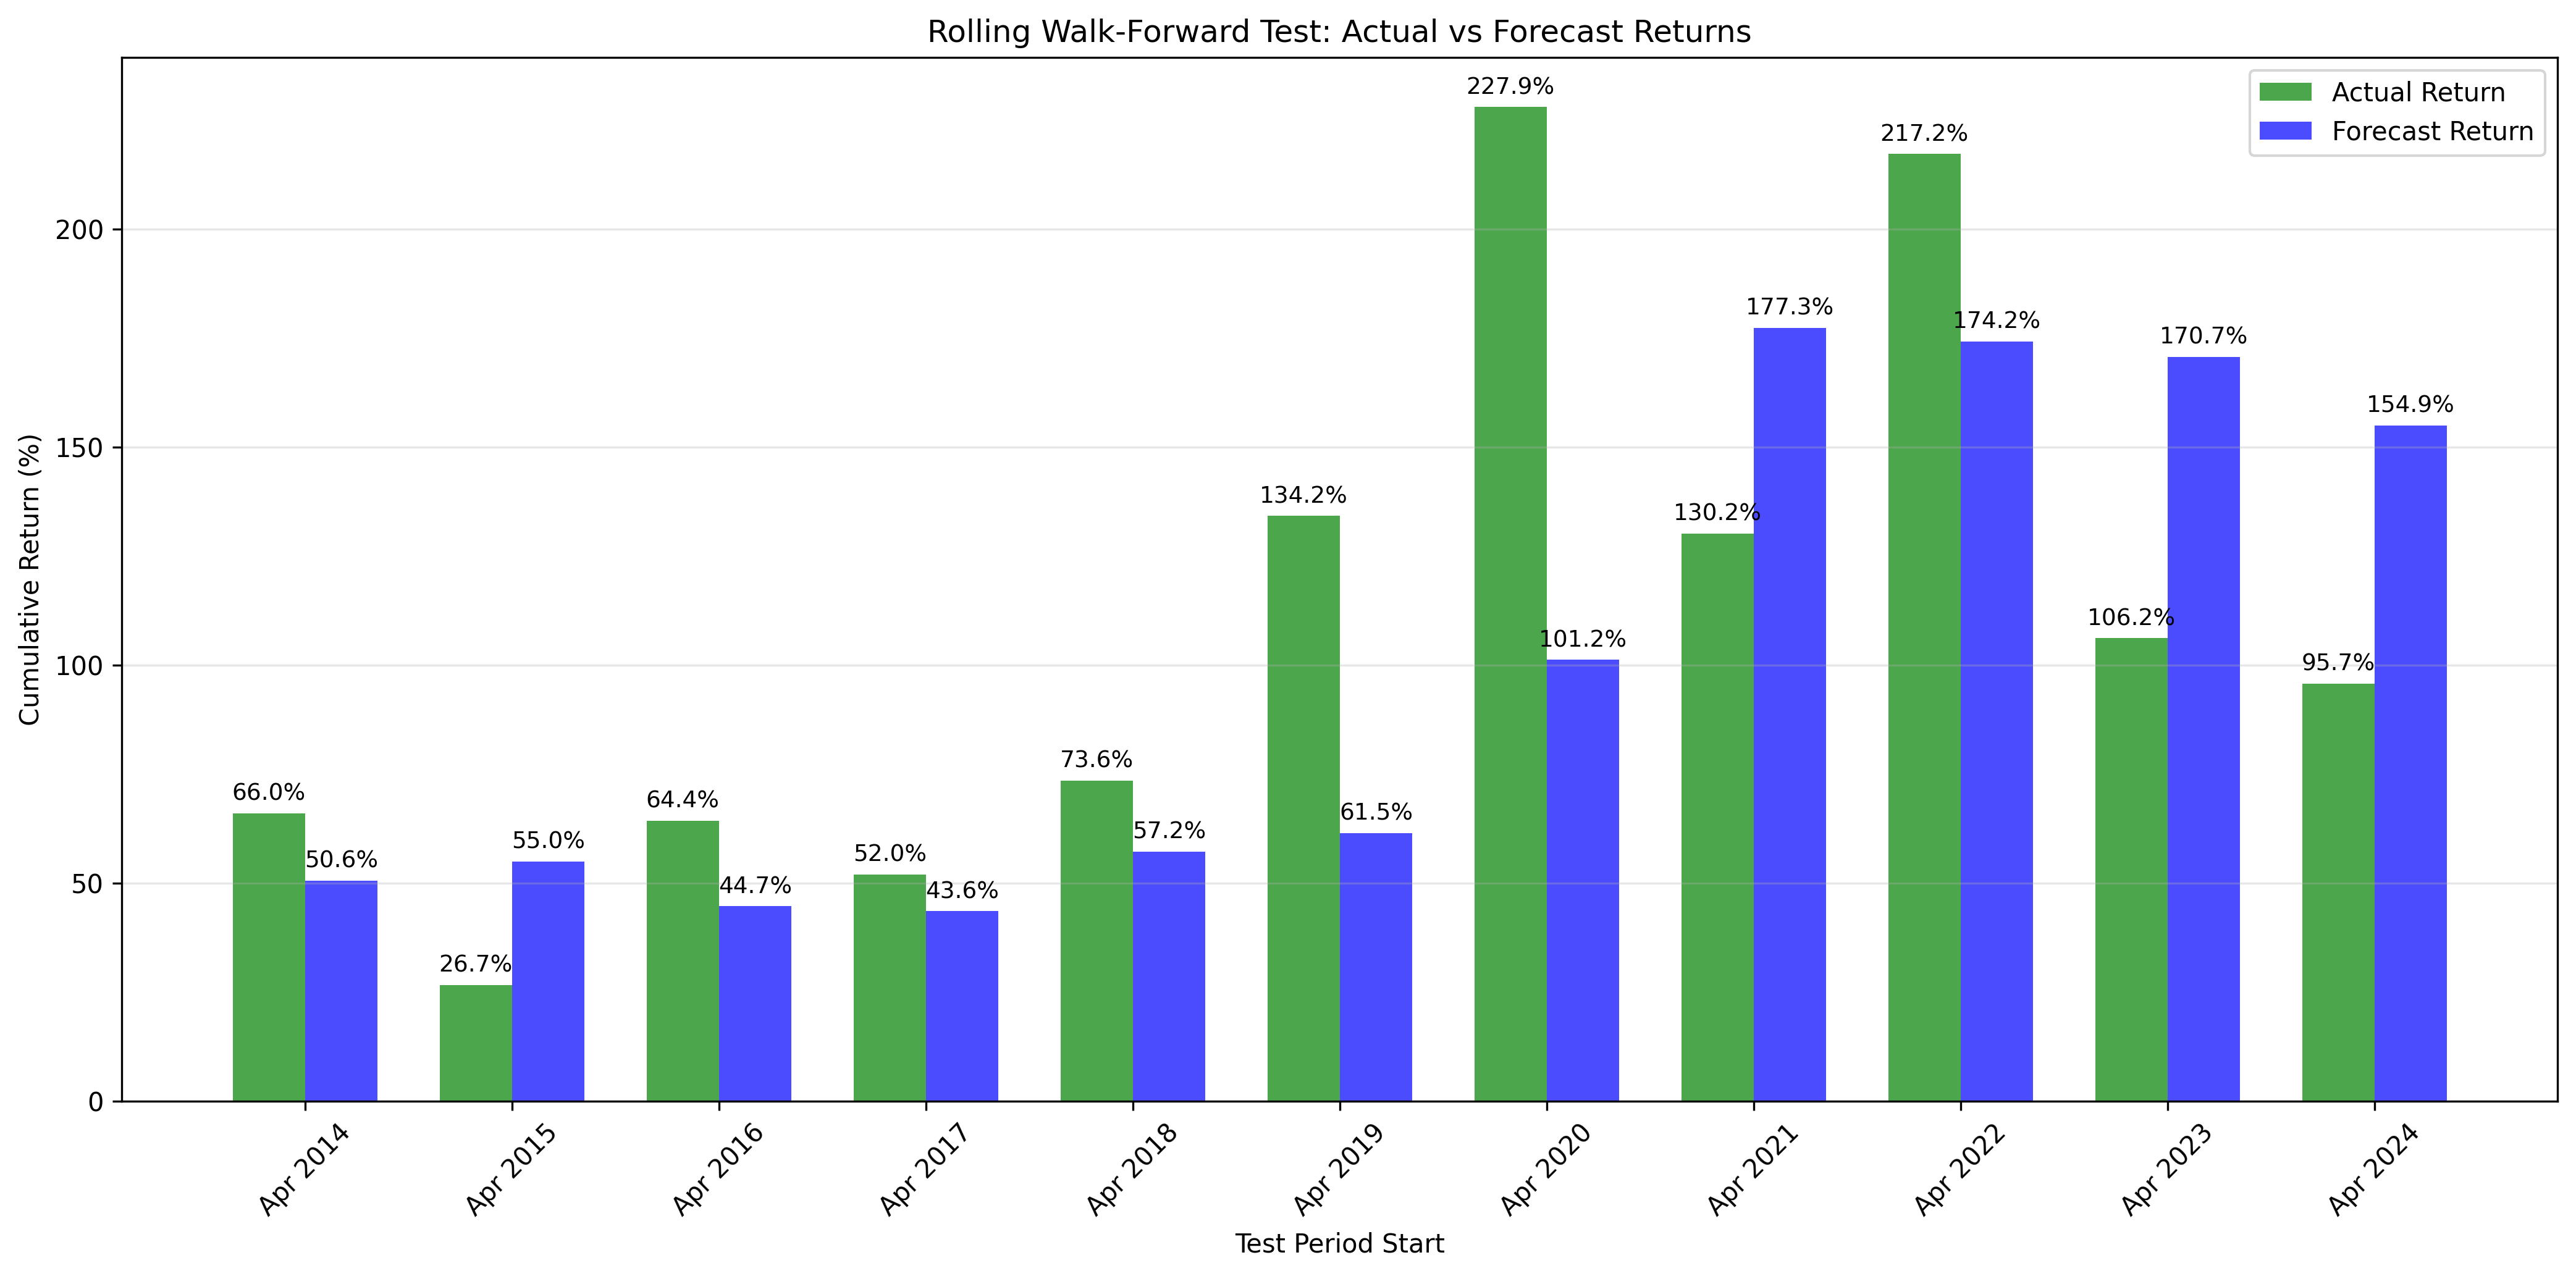
Monte Carlo robustness analysis to evaluate strategy's performance predictability using 10,000 simulations per test period within a rolling walk-forward framework
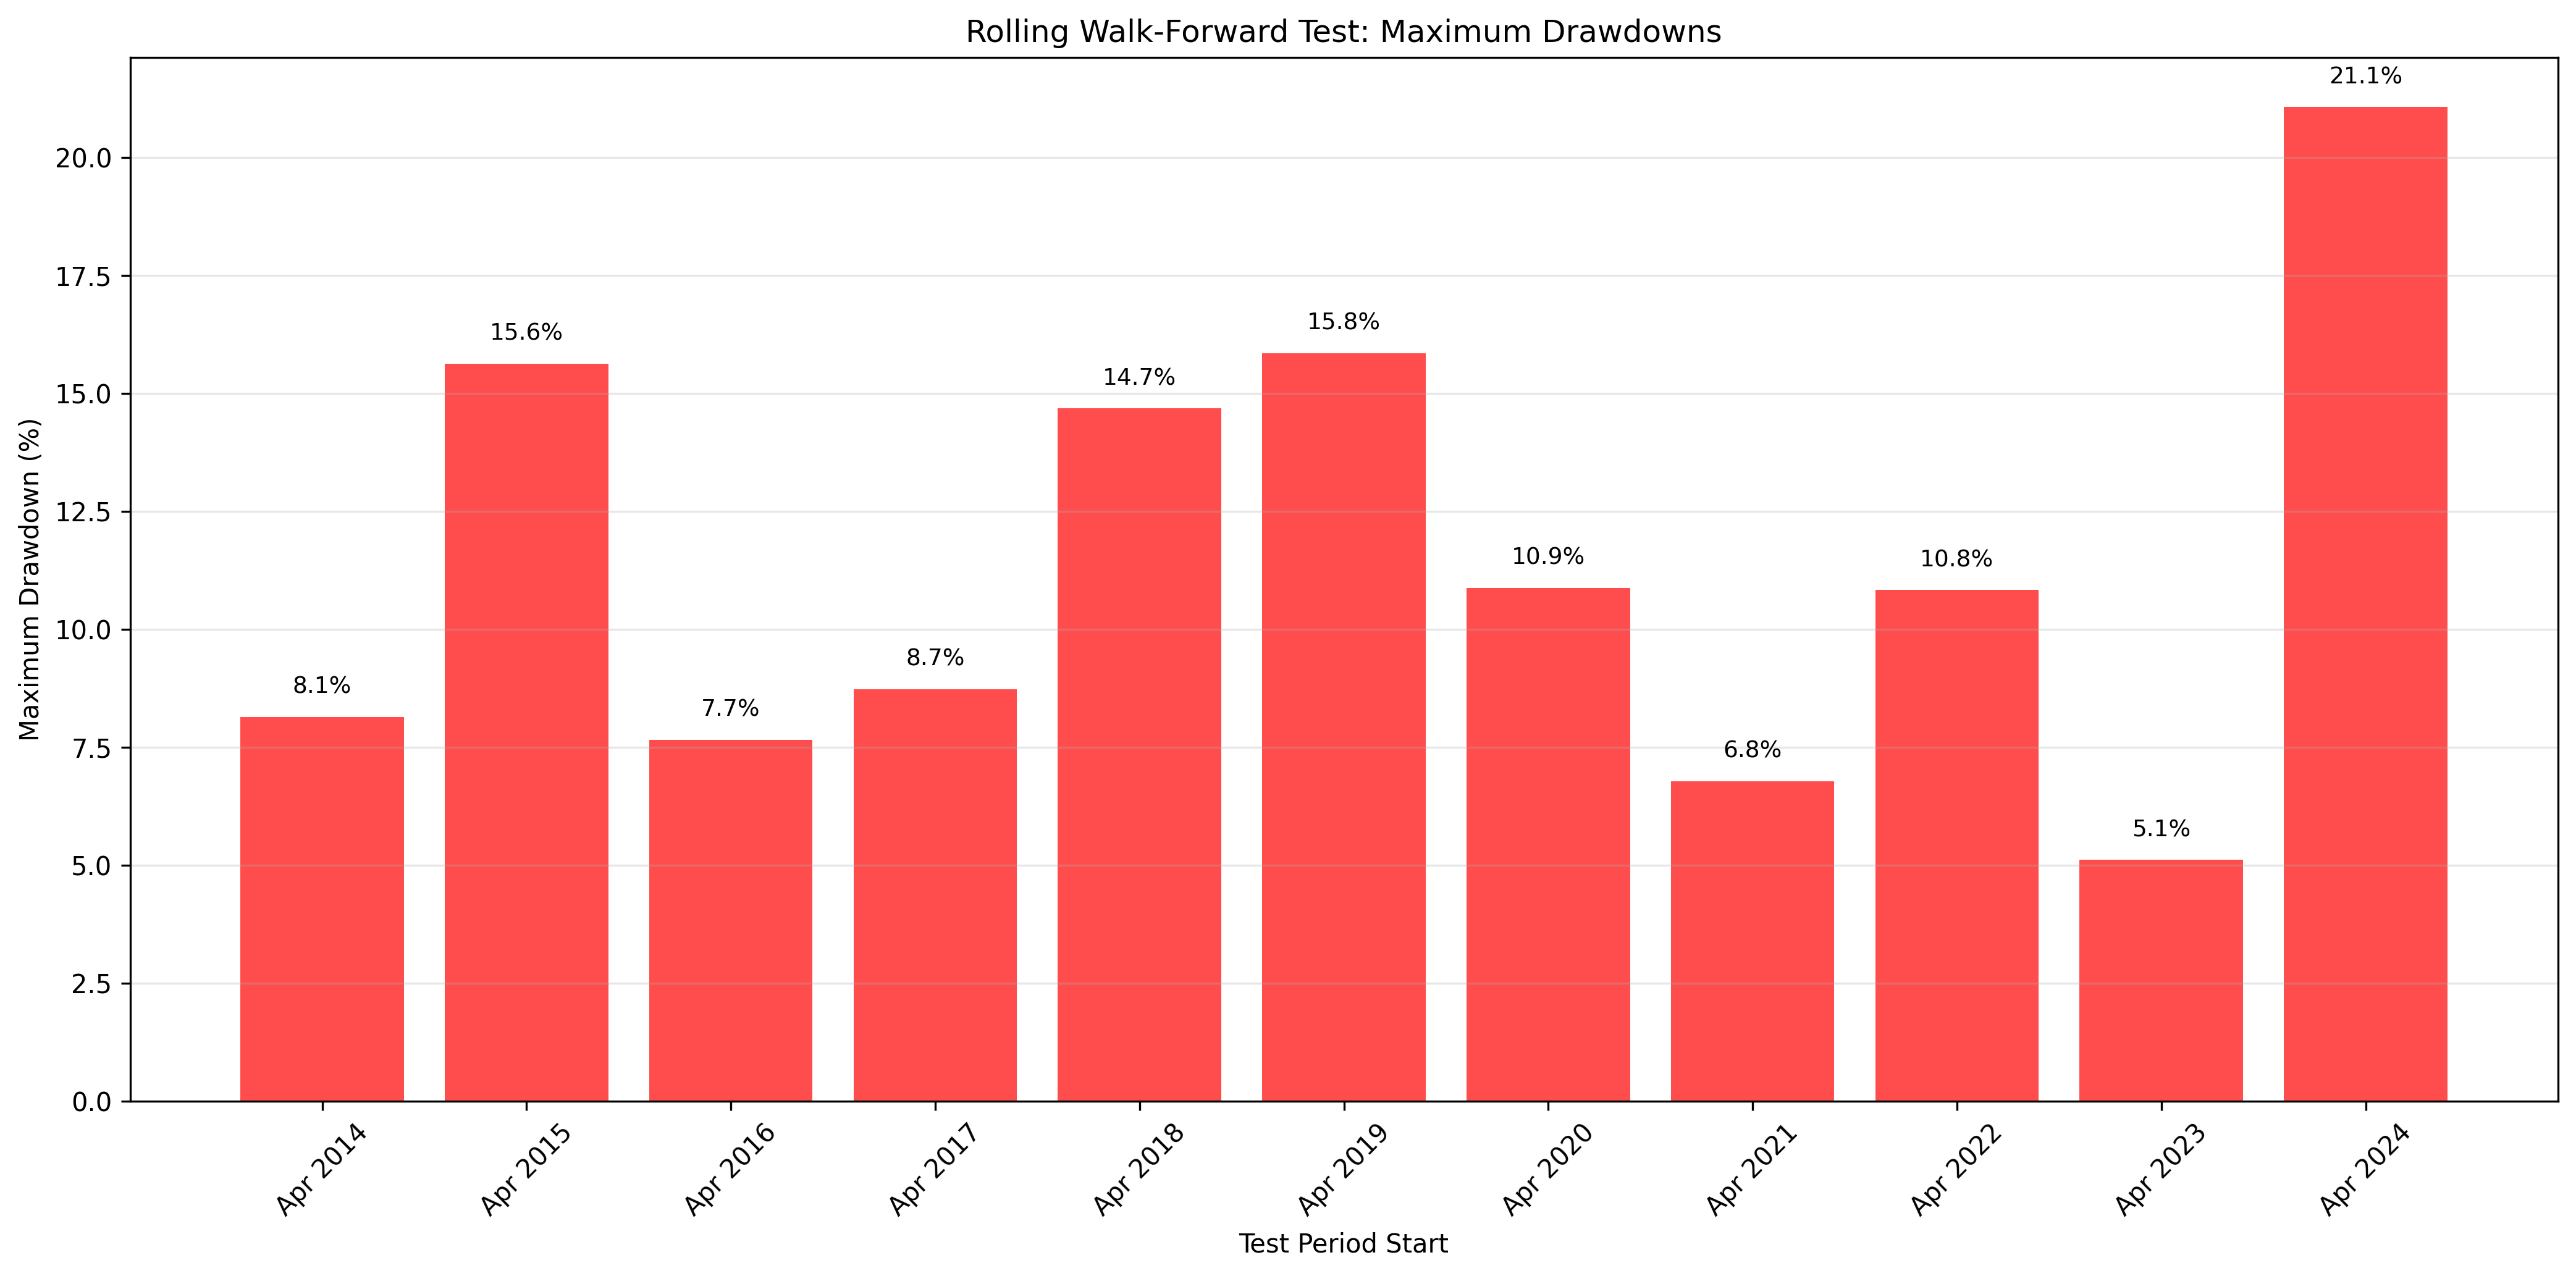
The 11-step rolling walk-forward test confirms that the performance of this strategy is not a product of curve-fitting.
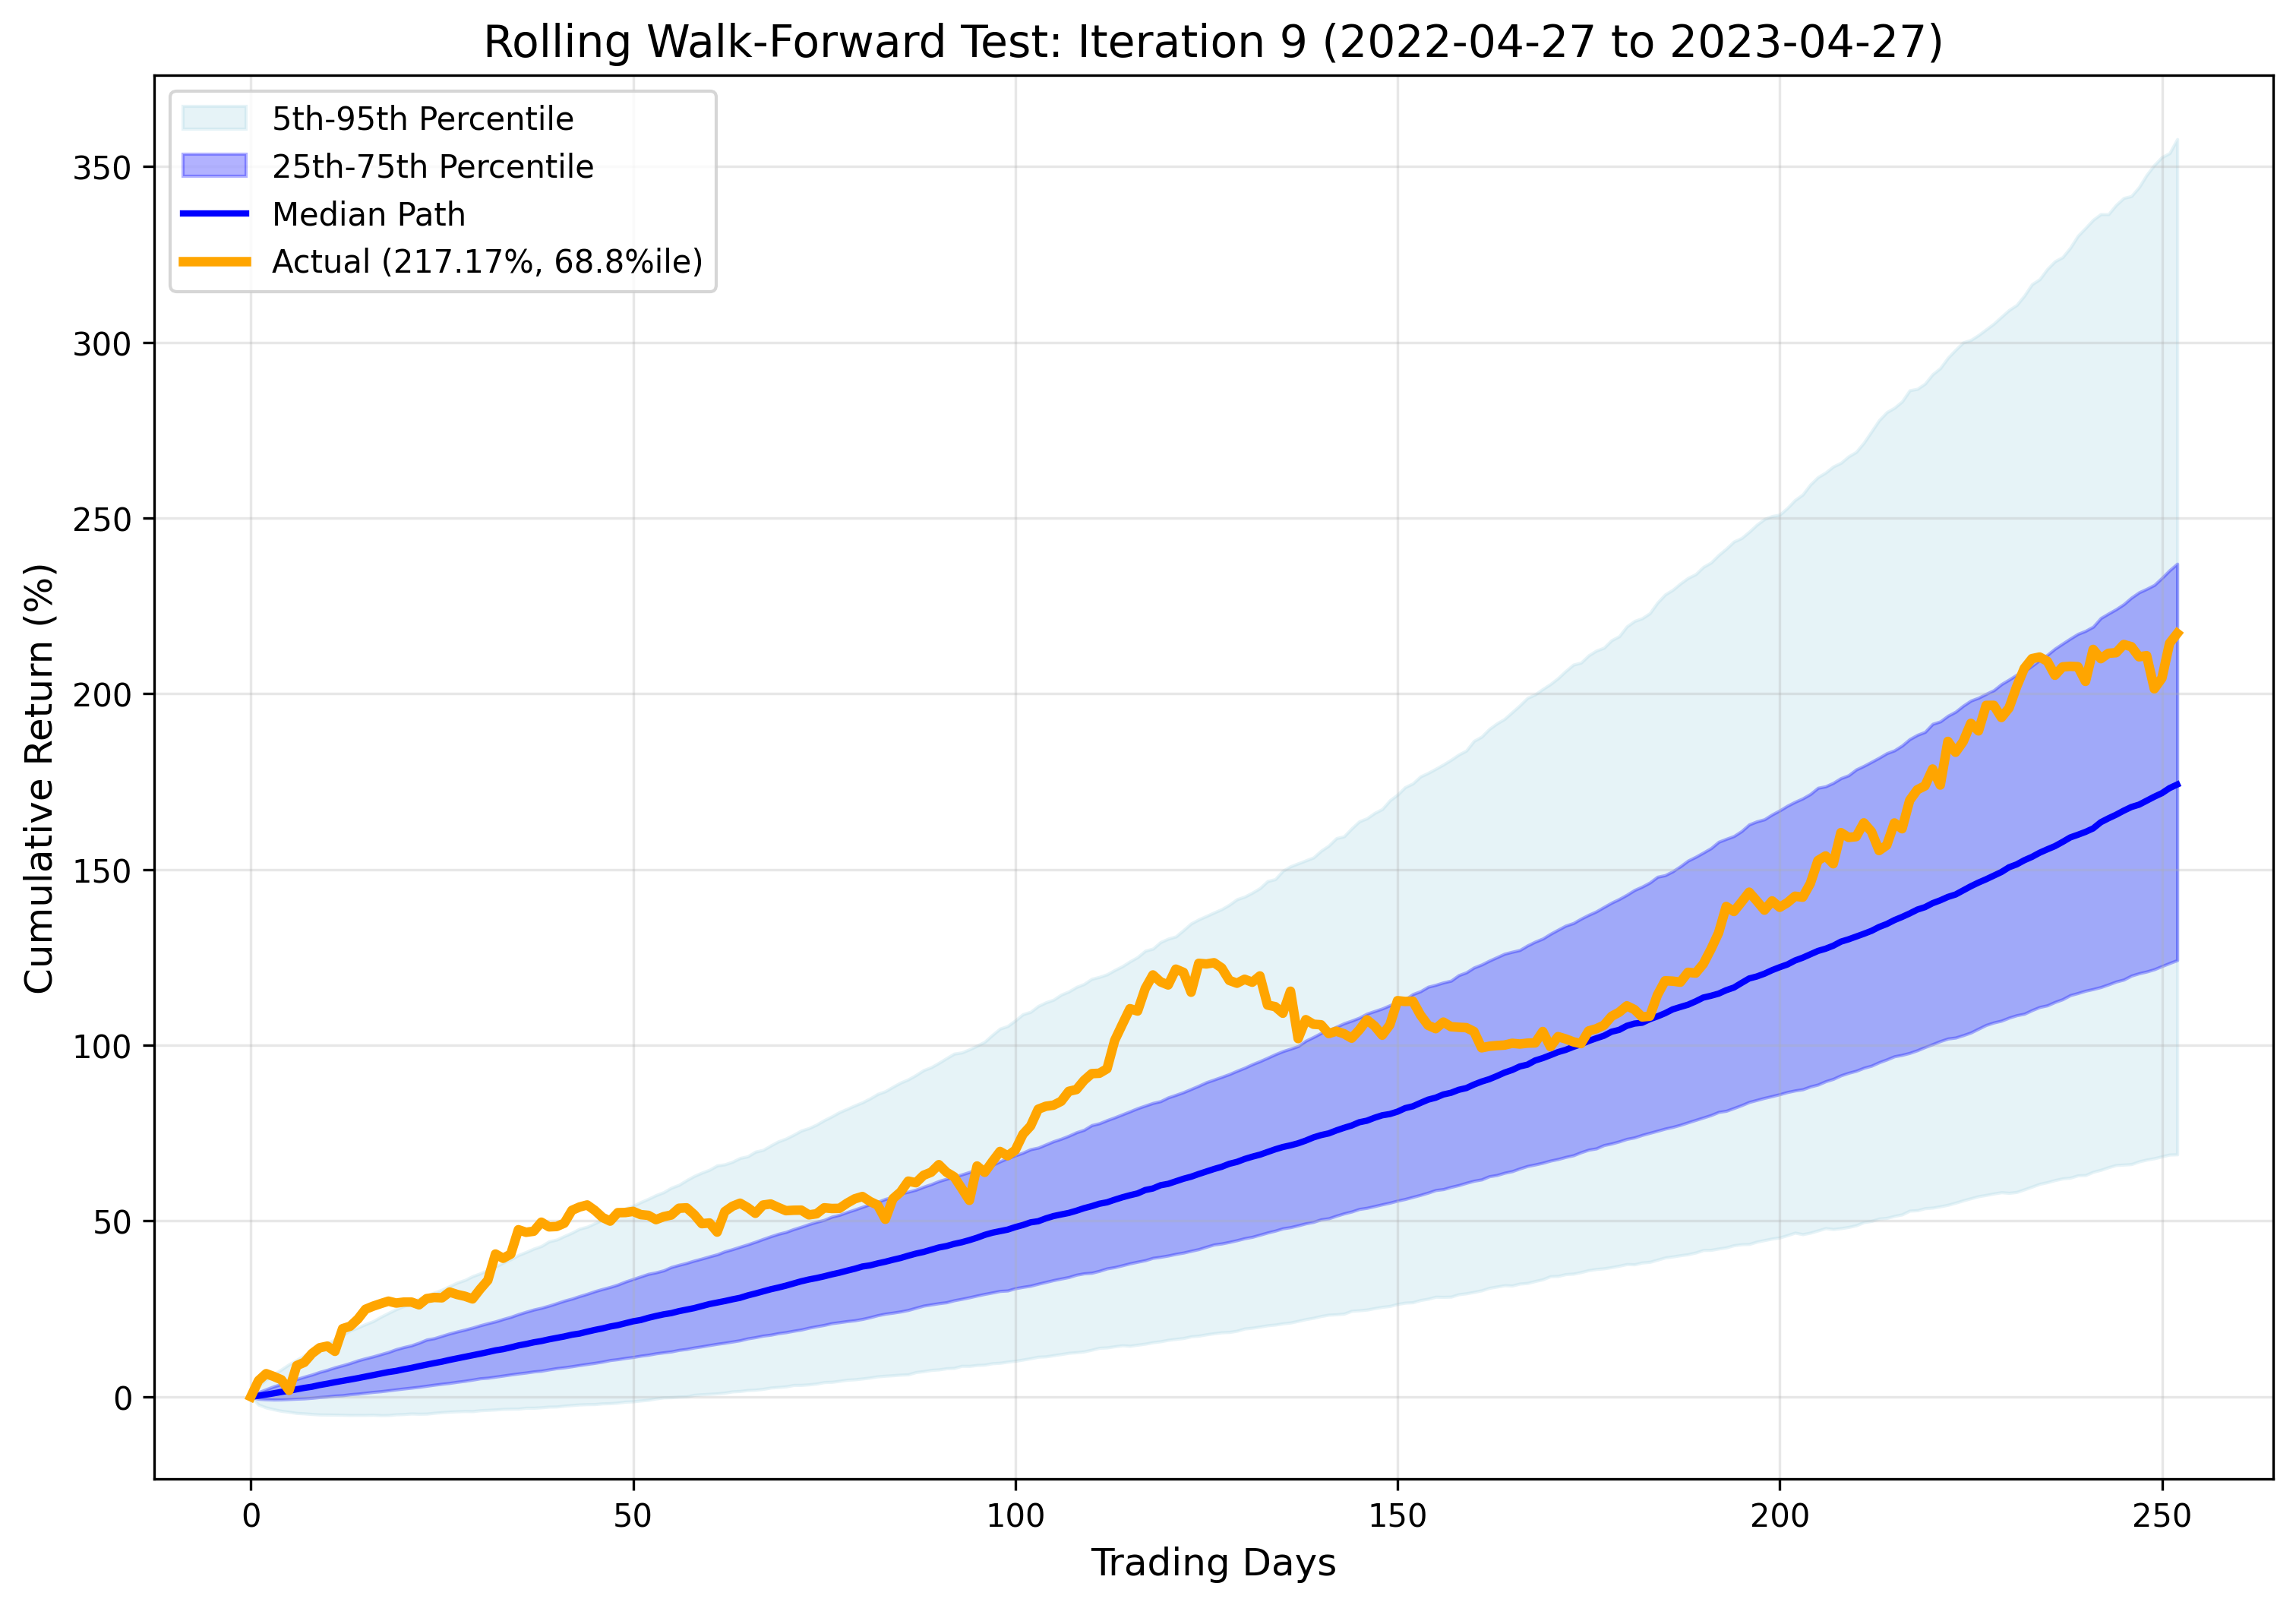
The strategy remained profitable during the 2015 chop (Iteration 2), the 2018 volatility implosion (Iteration 5), the COVID crash (Iteration 6), and the 2022 inflation bear market (Iteration 9). The weakest walk-forward iteration (Iteration 2) still produced a positive return with a reasonable drawdown.
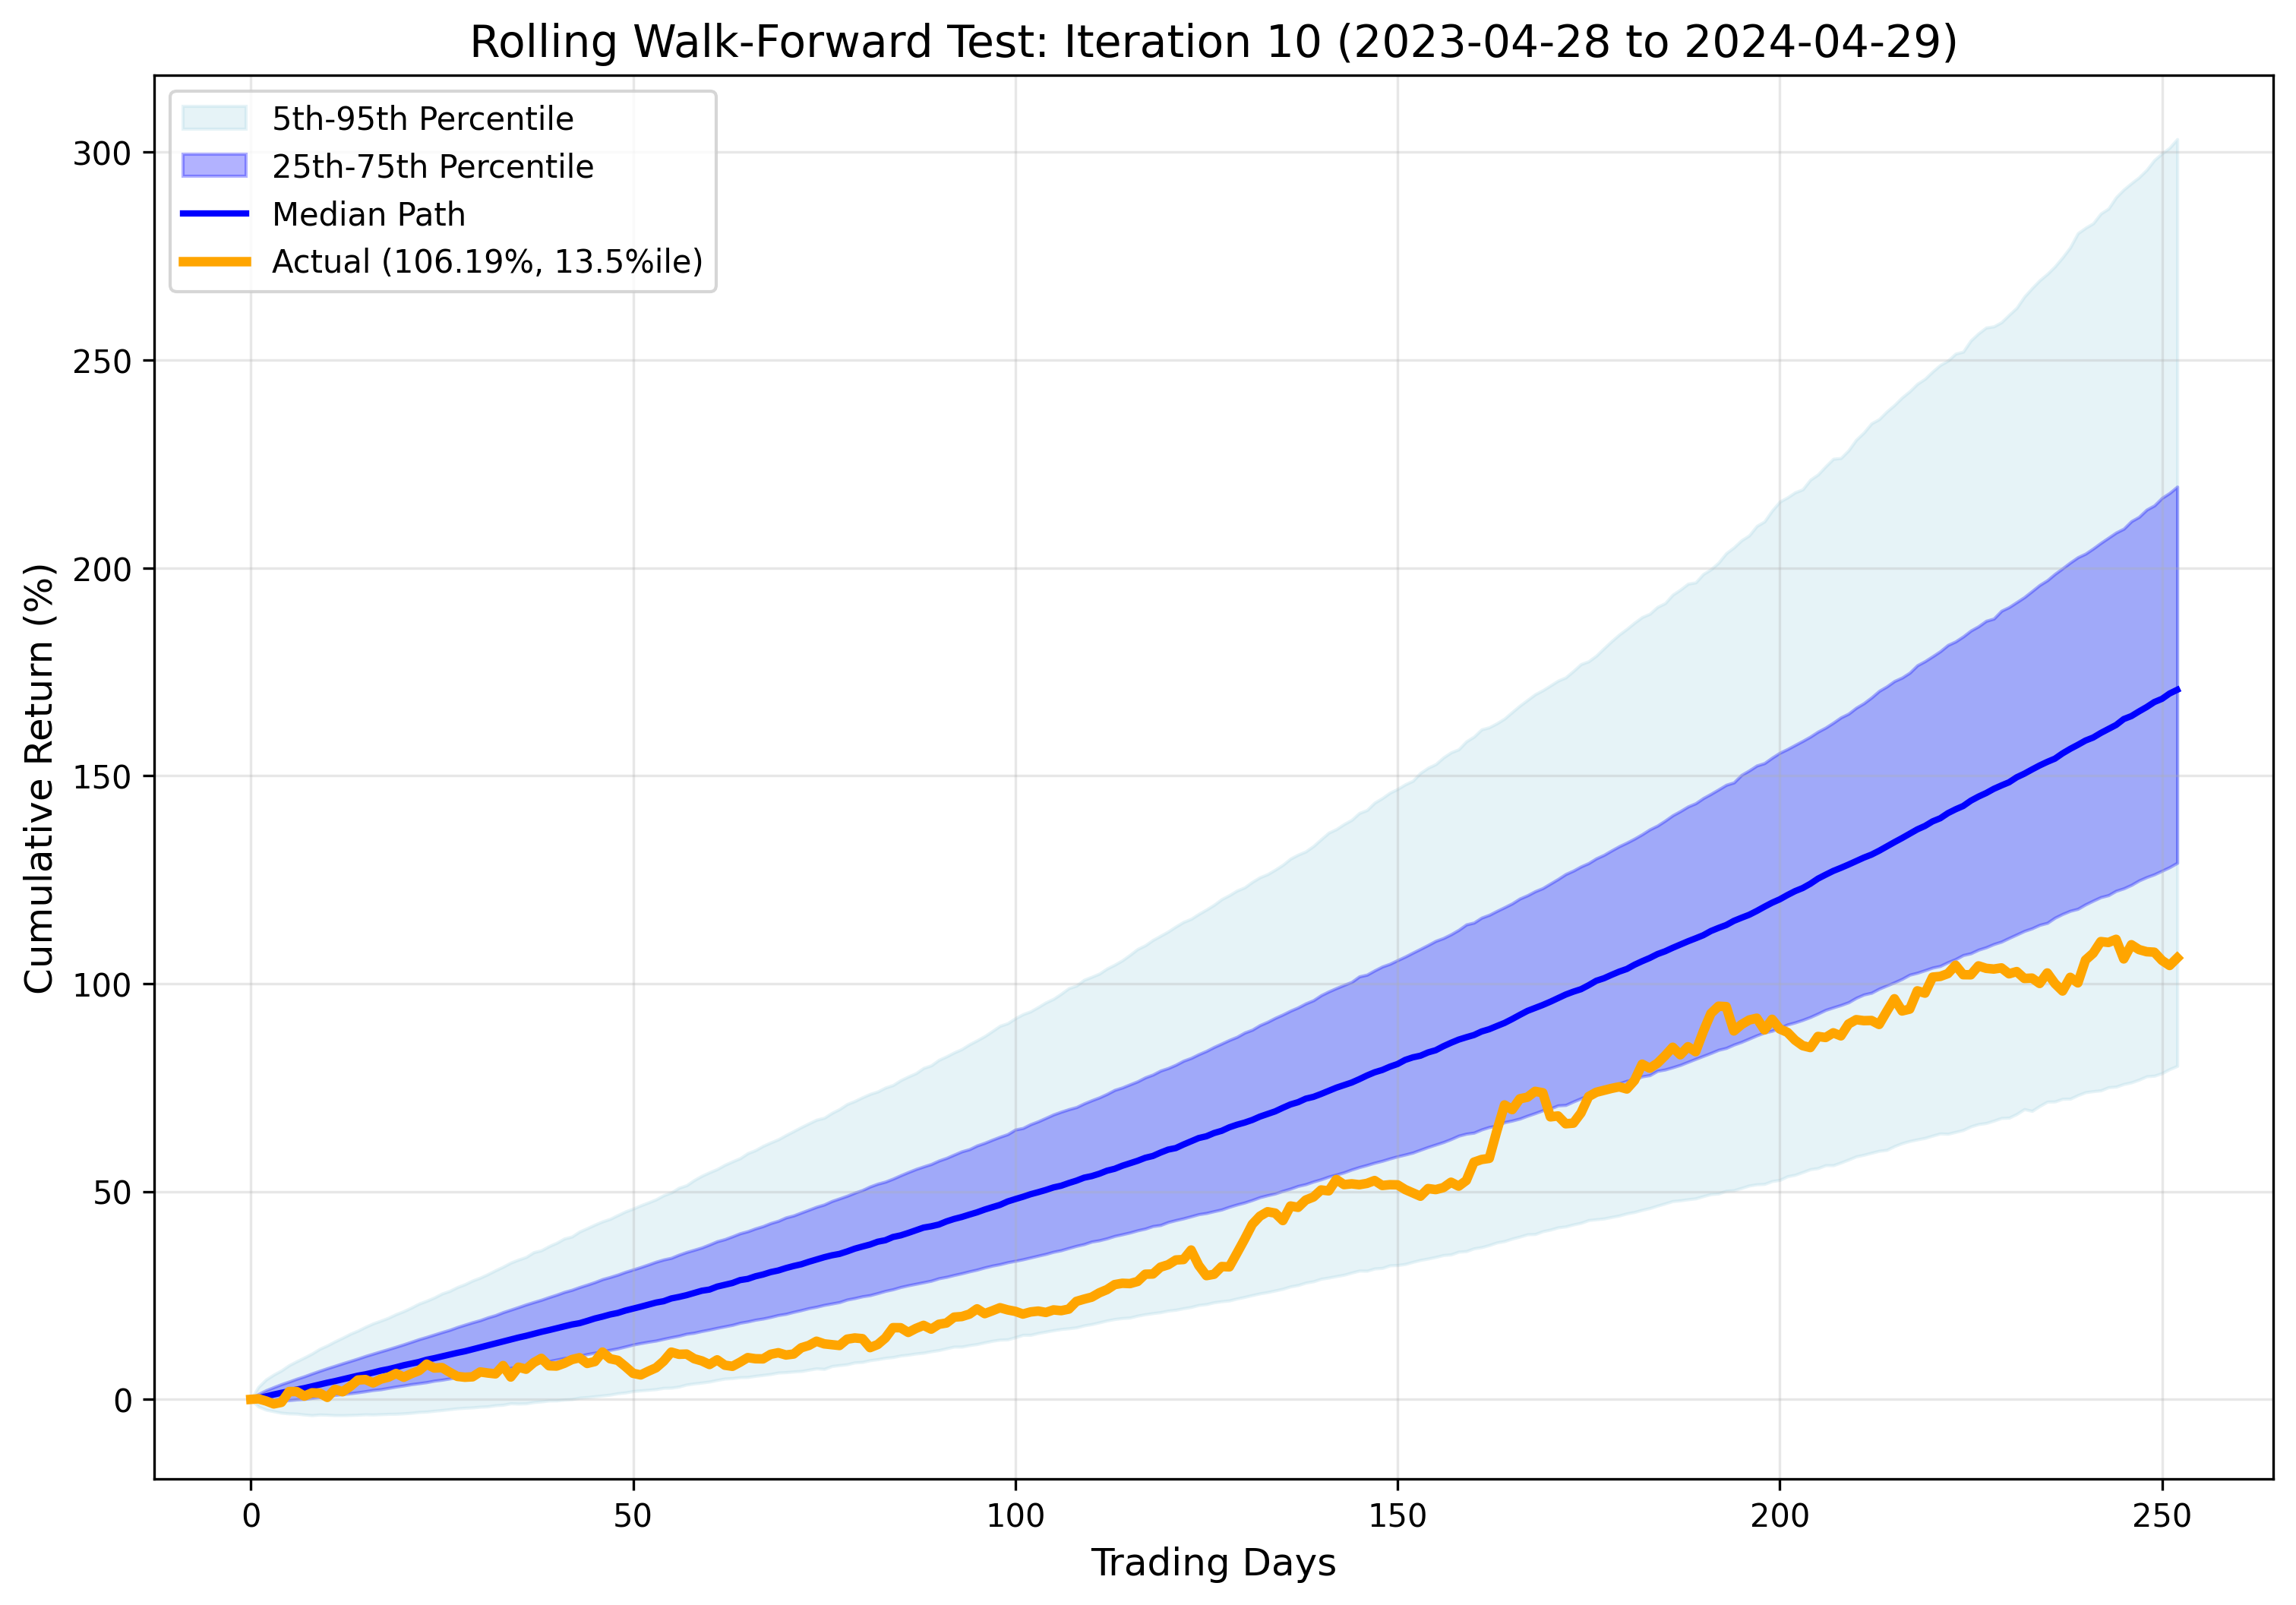
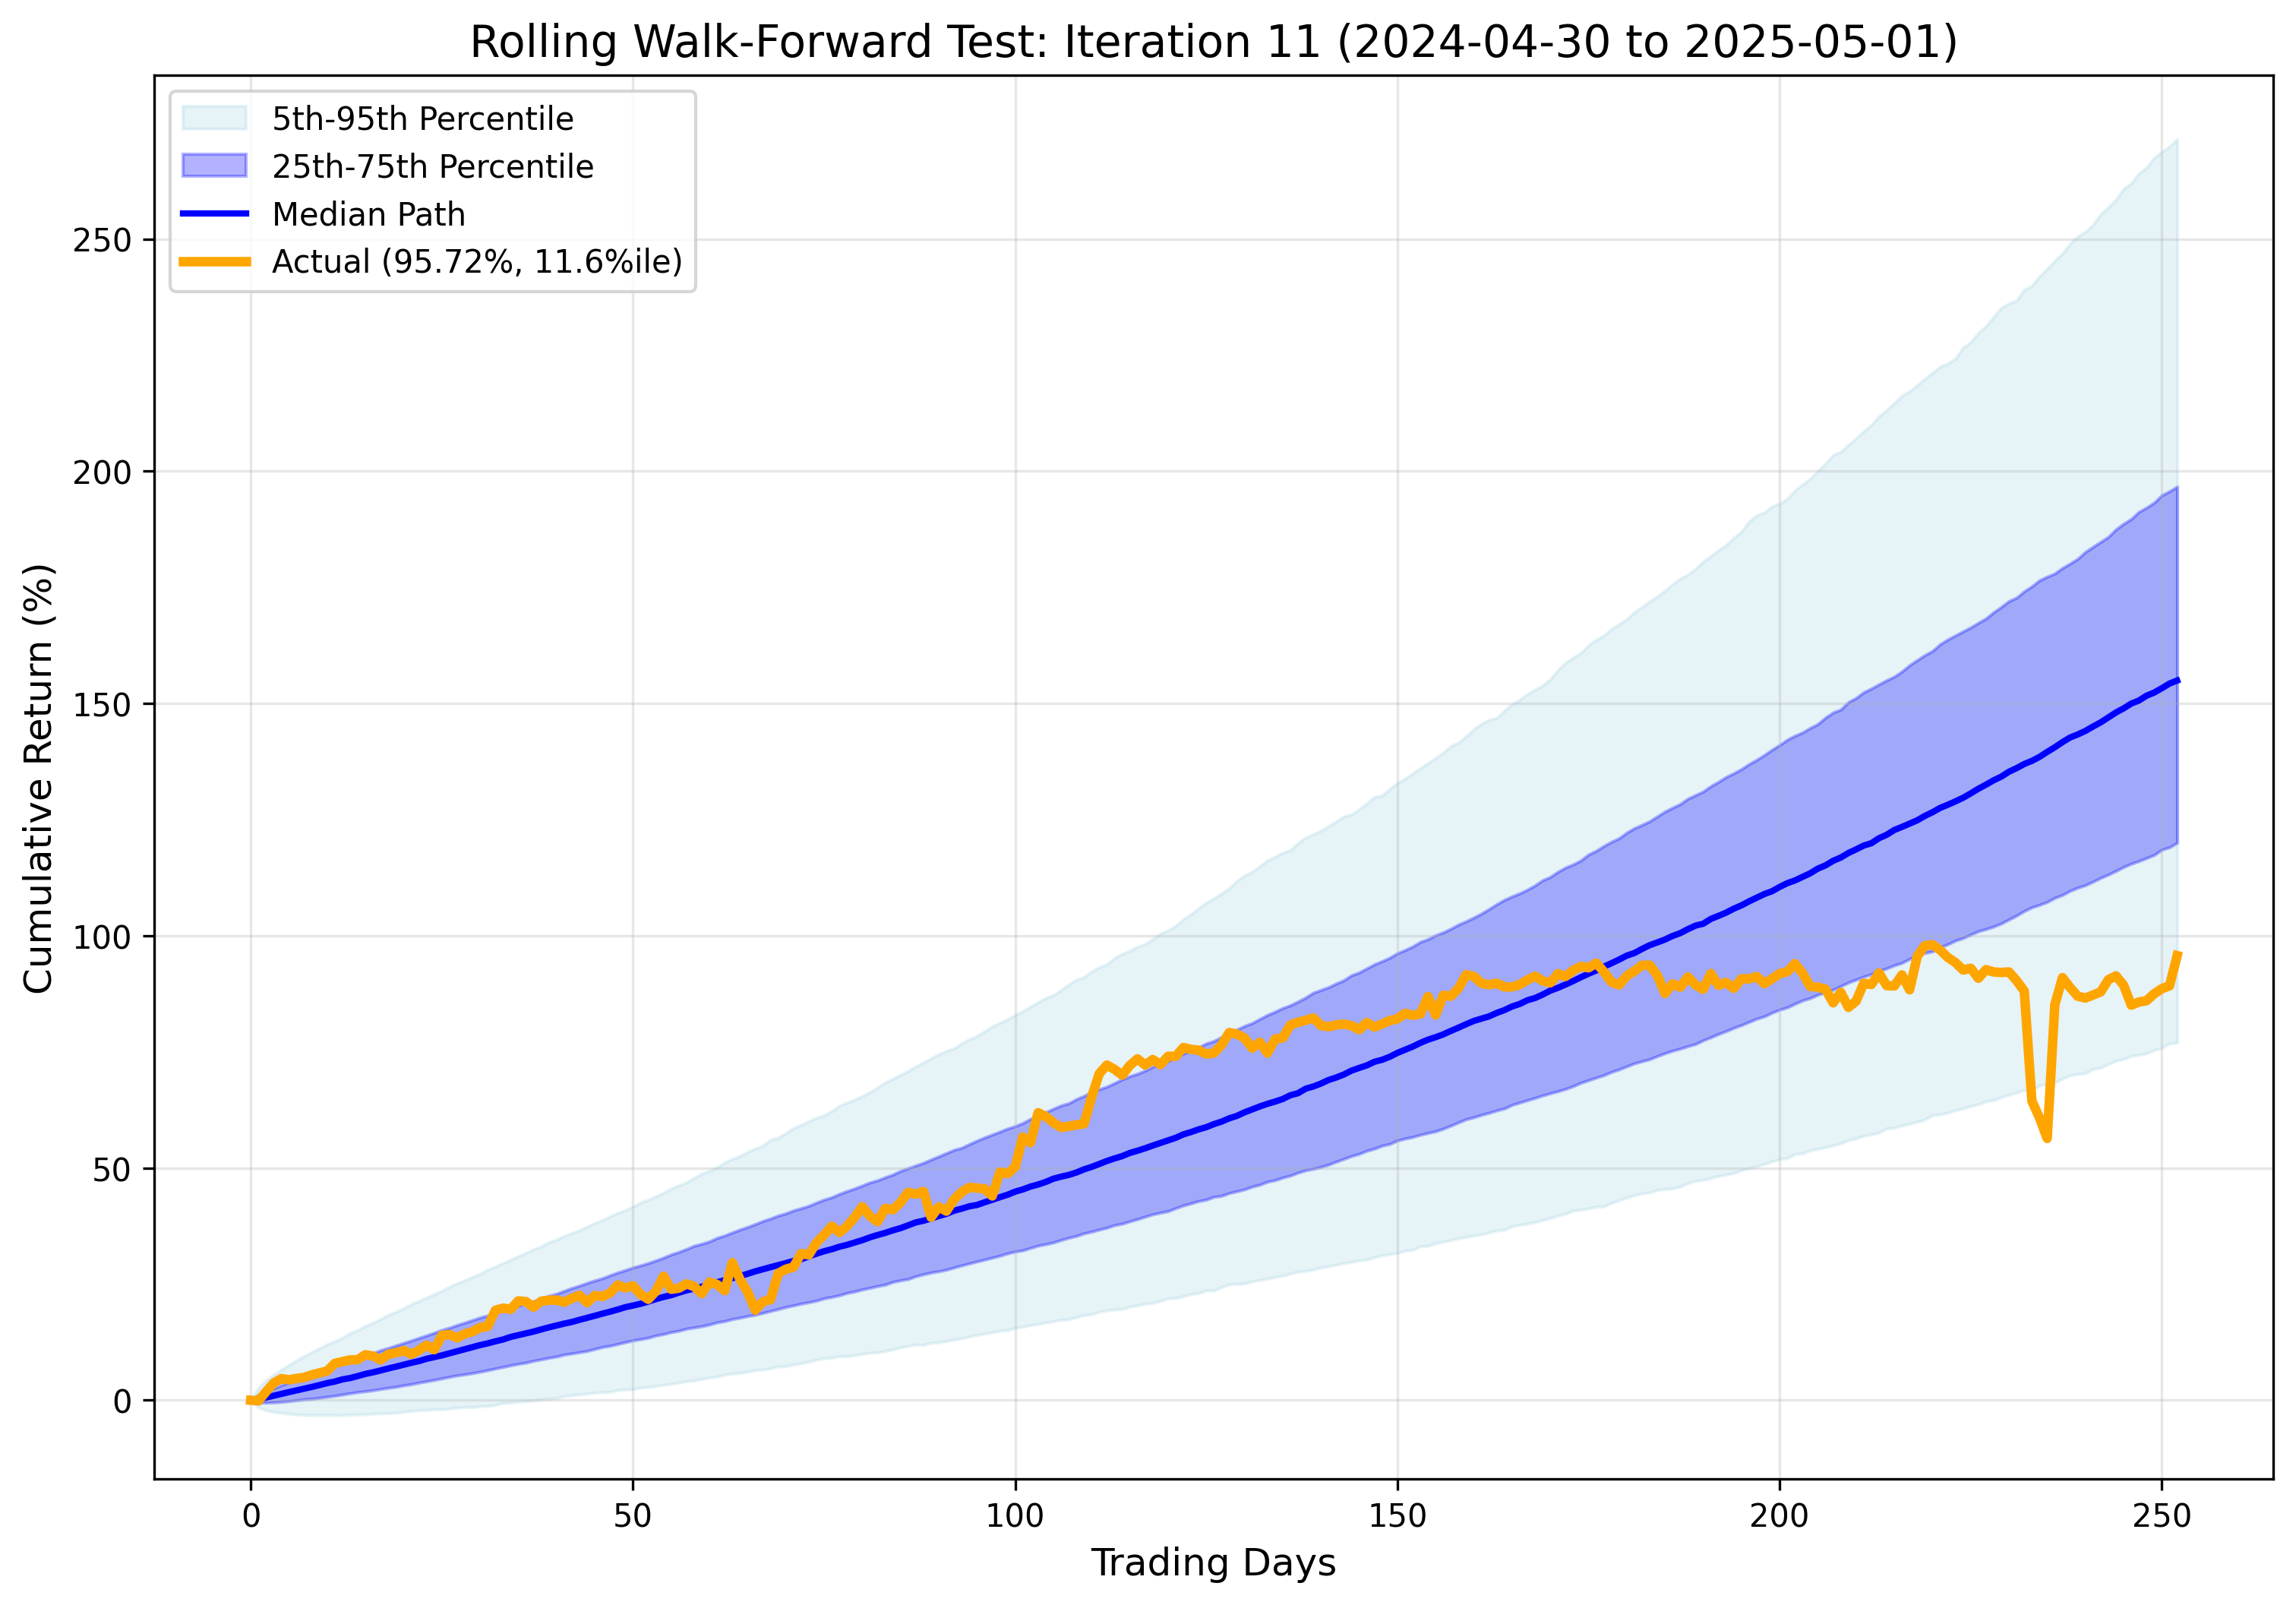
NOTE: This strategy is intentionally designed to capture outlier returns during specific market conditions. Following the periods of exceptional performance, Monte Carlo forecasts may appear overly optimistic in subsequent iterations, consequently making the strategy appear to underperform during those iterations. This is expected behavior as the simulations incorporate recent extreme returns into their probability distributions.
| Rank | Trading Days | Calendar Days | Max Drawdown | Start Date | End Date |
|---|---|---|---|---|---|
| 1 | 19 | 27 | 8.15% | 2014-10-08 | 2014-11-04 |
| 2 | 14 | 22 | 7.22% | 2014-12-29 | 2015-01-20 |
| 3 | 14 | 21 | 5.66% | 2014-06-30 | 2014-07-21 |
| Rank | Trading Days | Calendar Days | Max Drawdown | Start Date | End Date |
|---|---|---|---|---|---|
| 1 | 69 | 98 | 15.66% | 2015-07-20 | 2015-10-26 |
| 2 | 78 | 114 | 11.69% | 2015-12-01 | 2016-03-24 |
| Rank | Trading Days | Calendar Days | Max Drawdown | Start Date | End Date |
|---|---|---|---|---|---|
| 1 | 48 | 72 | 7.49% | 2016-11-14 | 2017-01-25 |
| 2 | 33 | 47 | 7.05% | 2017-03-09 | 2017-04-25 |
| 3 | 35 | 50 | 3.23% | 2016-08-23 | 2016-10-12 |
| 4 | 28 | 41 | 1.82% | 2016-05-10 | 2016-06-20 |
| Rank | Trading Days | Calendar Days | Max Drawdown | Start Date | End Date |
|---|---|---|---|---|---|
| 1 | 39 | 58 | 8.77% | 2017-12-06 | 2018-02-02 |
| 2 | 18 | 26 | 7.53% | 2017-04-28 | 2017-05-24 |
| 3 | 34 | 48 | 5.69% | 2017-09-28 | 2017-11-15 |
| 4 | 48 | 67 | 5.13% | 2017-06-26 | 2017-09-01 |
| Rank | Trading Days | Calendar Days | Max Drawdown | Start Date | End Date |
|---|---|---|---|---|---|
| 1 | 49 | 76 | 14.70% | 2018-11-14 | 2019-01-29 |
| 2 | 23 | 34 | 4.34% | 2018-08-31 | 2018-10-04 |
| 3 | 15 | 22 | 2.56% | 2018-05-09 | 2018-05-31 |
| Rank | Trading Days | Calendar Days | Max Drawdown | Start Date | End Date |
|---|---|---|---|---|---|
| 1 | 15 | 21 | 15.85% | 2020-02-19 | 2020-03-11 |
| 2 | 37 | 52 | 8.58% | 2019-05-07 | 2019-06-28 |
| 3 | 16 | 23 | 3.80% | 2019-12-04 | 2019-12-27 |
| 4 | 16 | 22 | 3.57% | 2019-09-05 | 2019-09-27 |
| Rank | Trading Days | Calendar Days | Max Drawdown | Start Date | End Date |
|---|---|---|---|---|---|
| 1 | 98 | 145 | 10.88% | 2020-10-02 | 2021-02-24 |
| Rank | Trading Days | Calendar Days | Max Drawdown | Start Date | End Date |
|---|---|---|---|---|---|
| 1 | 31 | 44 | 5.56% | 2022-01-05 | 2022-02-18 |
| 2 | 19 | 27 | 4.13% | 2021-09-08 | 2021-10-05 |
| 3 | 19 | 25 | 3.37% | 2022-03-14 | 2022-04-08 |
| Rank | Trading Days | Calendar Days | Max Drawdown | Start Date | End Date |
|---|---|---|---|---|---|
| 1 | 64 | 96 | 10.83% | 2022-10-26 | 2023-01-30 |
| 2 | 19 | 28 | 5.00% | 2022-06-30 | 2022-07-28 |
| Rank | Trading Days | Calendar Days | Max Drawdown | Start Date | End Date |
|---|---|---|---|---|---|
| 1 | 22 | 33 | 5.11% | 2024-02-02 | 2024-03-06 |
| 2 | 25 | 35 | 4.94% | 2023-07-06 | 2023-08-10 |
| 3 | 16 | 23 | 3.04% | 2024-03-19 | 2024-04-11 |
| 4 | 17 | 24 | 2.64% | 2023-11-20 | 2023-12-14 |
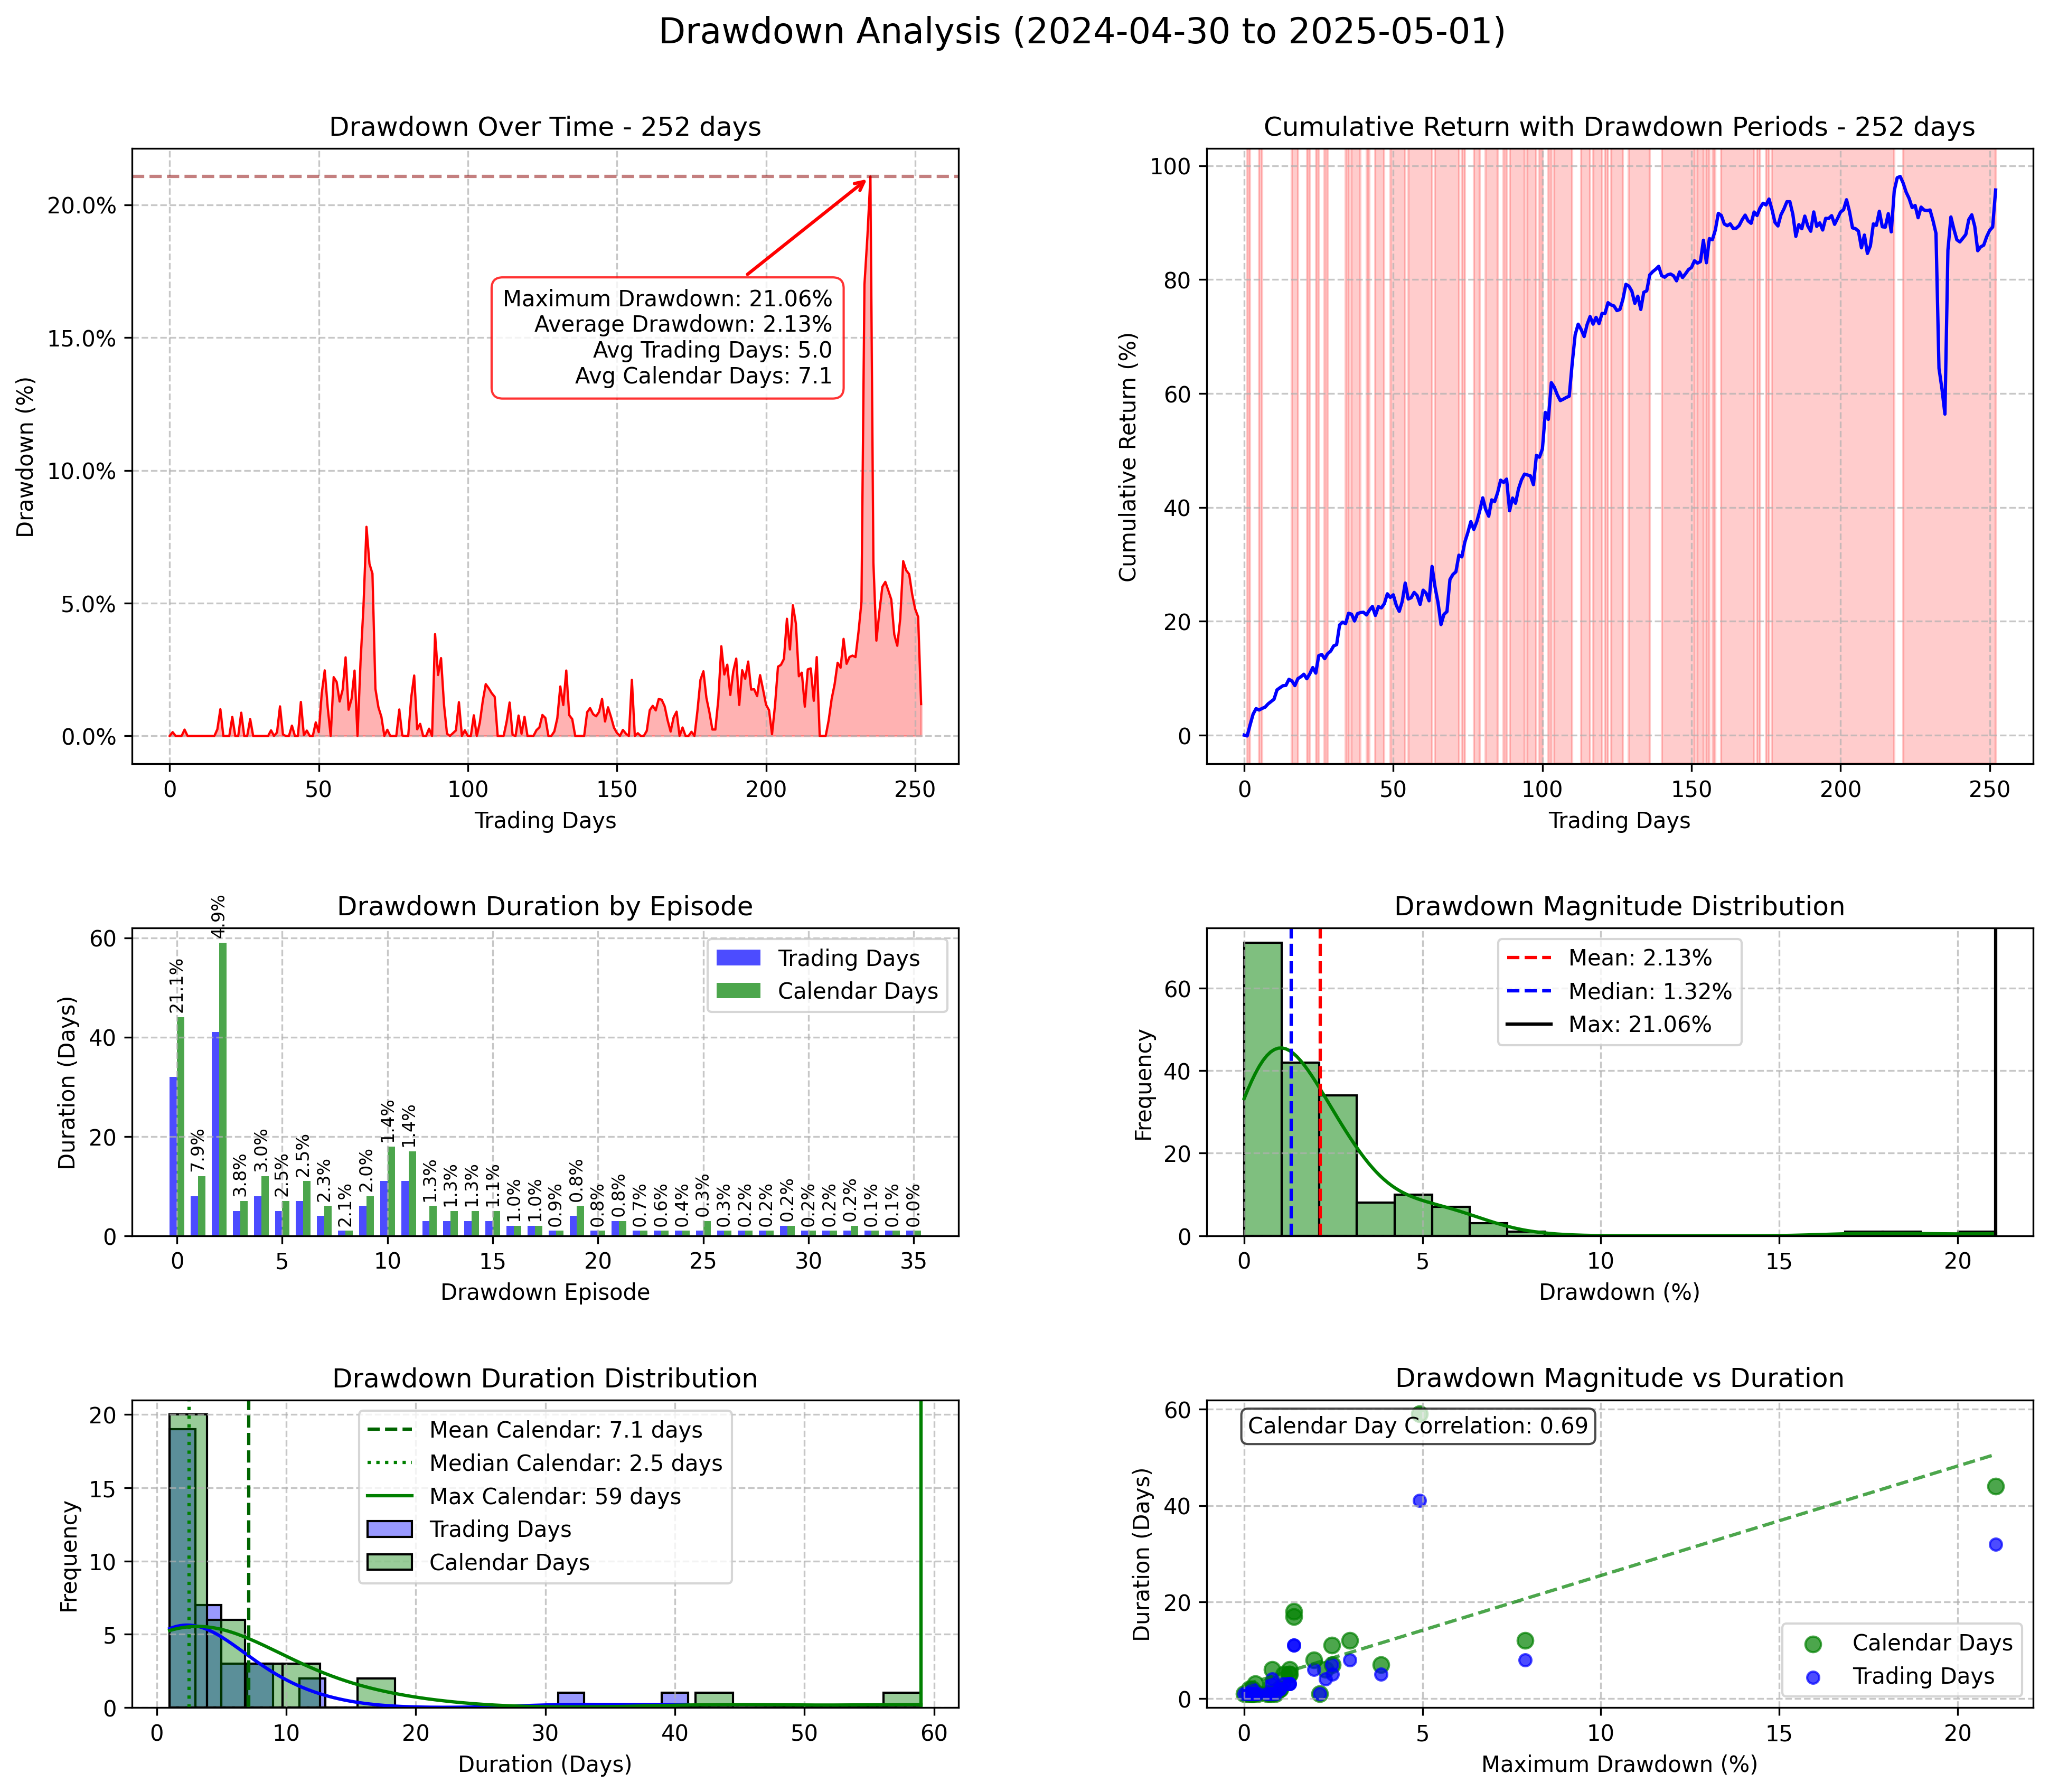
| Rank | Trading Days | Calendar Days | Max Drawdown | Start Date | End Date |
|---|---|---|---|---|---|
| 1 | 32 | 44 | 21.06% | 2025-03-18 | 2025-05-01 |
| 2 | 41 | 59 | 4.92% | 2025-01-13 | 2025-03-13 |
| Metric | Value |
|---|---|
| Average Actual Return | 108.32% |
| Average Forecast Return | 98.67% |
| Average Error | 9.66% |
| Average Percentile | 54.1% |
| Average Max Drawdown | 11.39% |
| Average Actual CAGR | 108.32% |
| Average Forecast CAGR | 98.67% |
Please wait while we get Zehnvisor on the line for you...