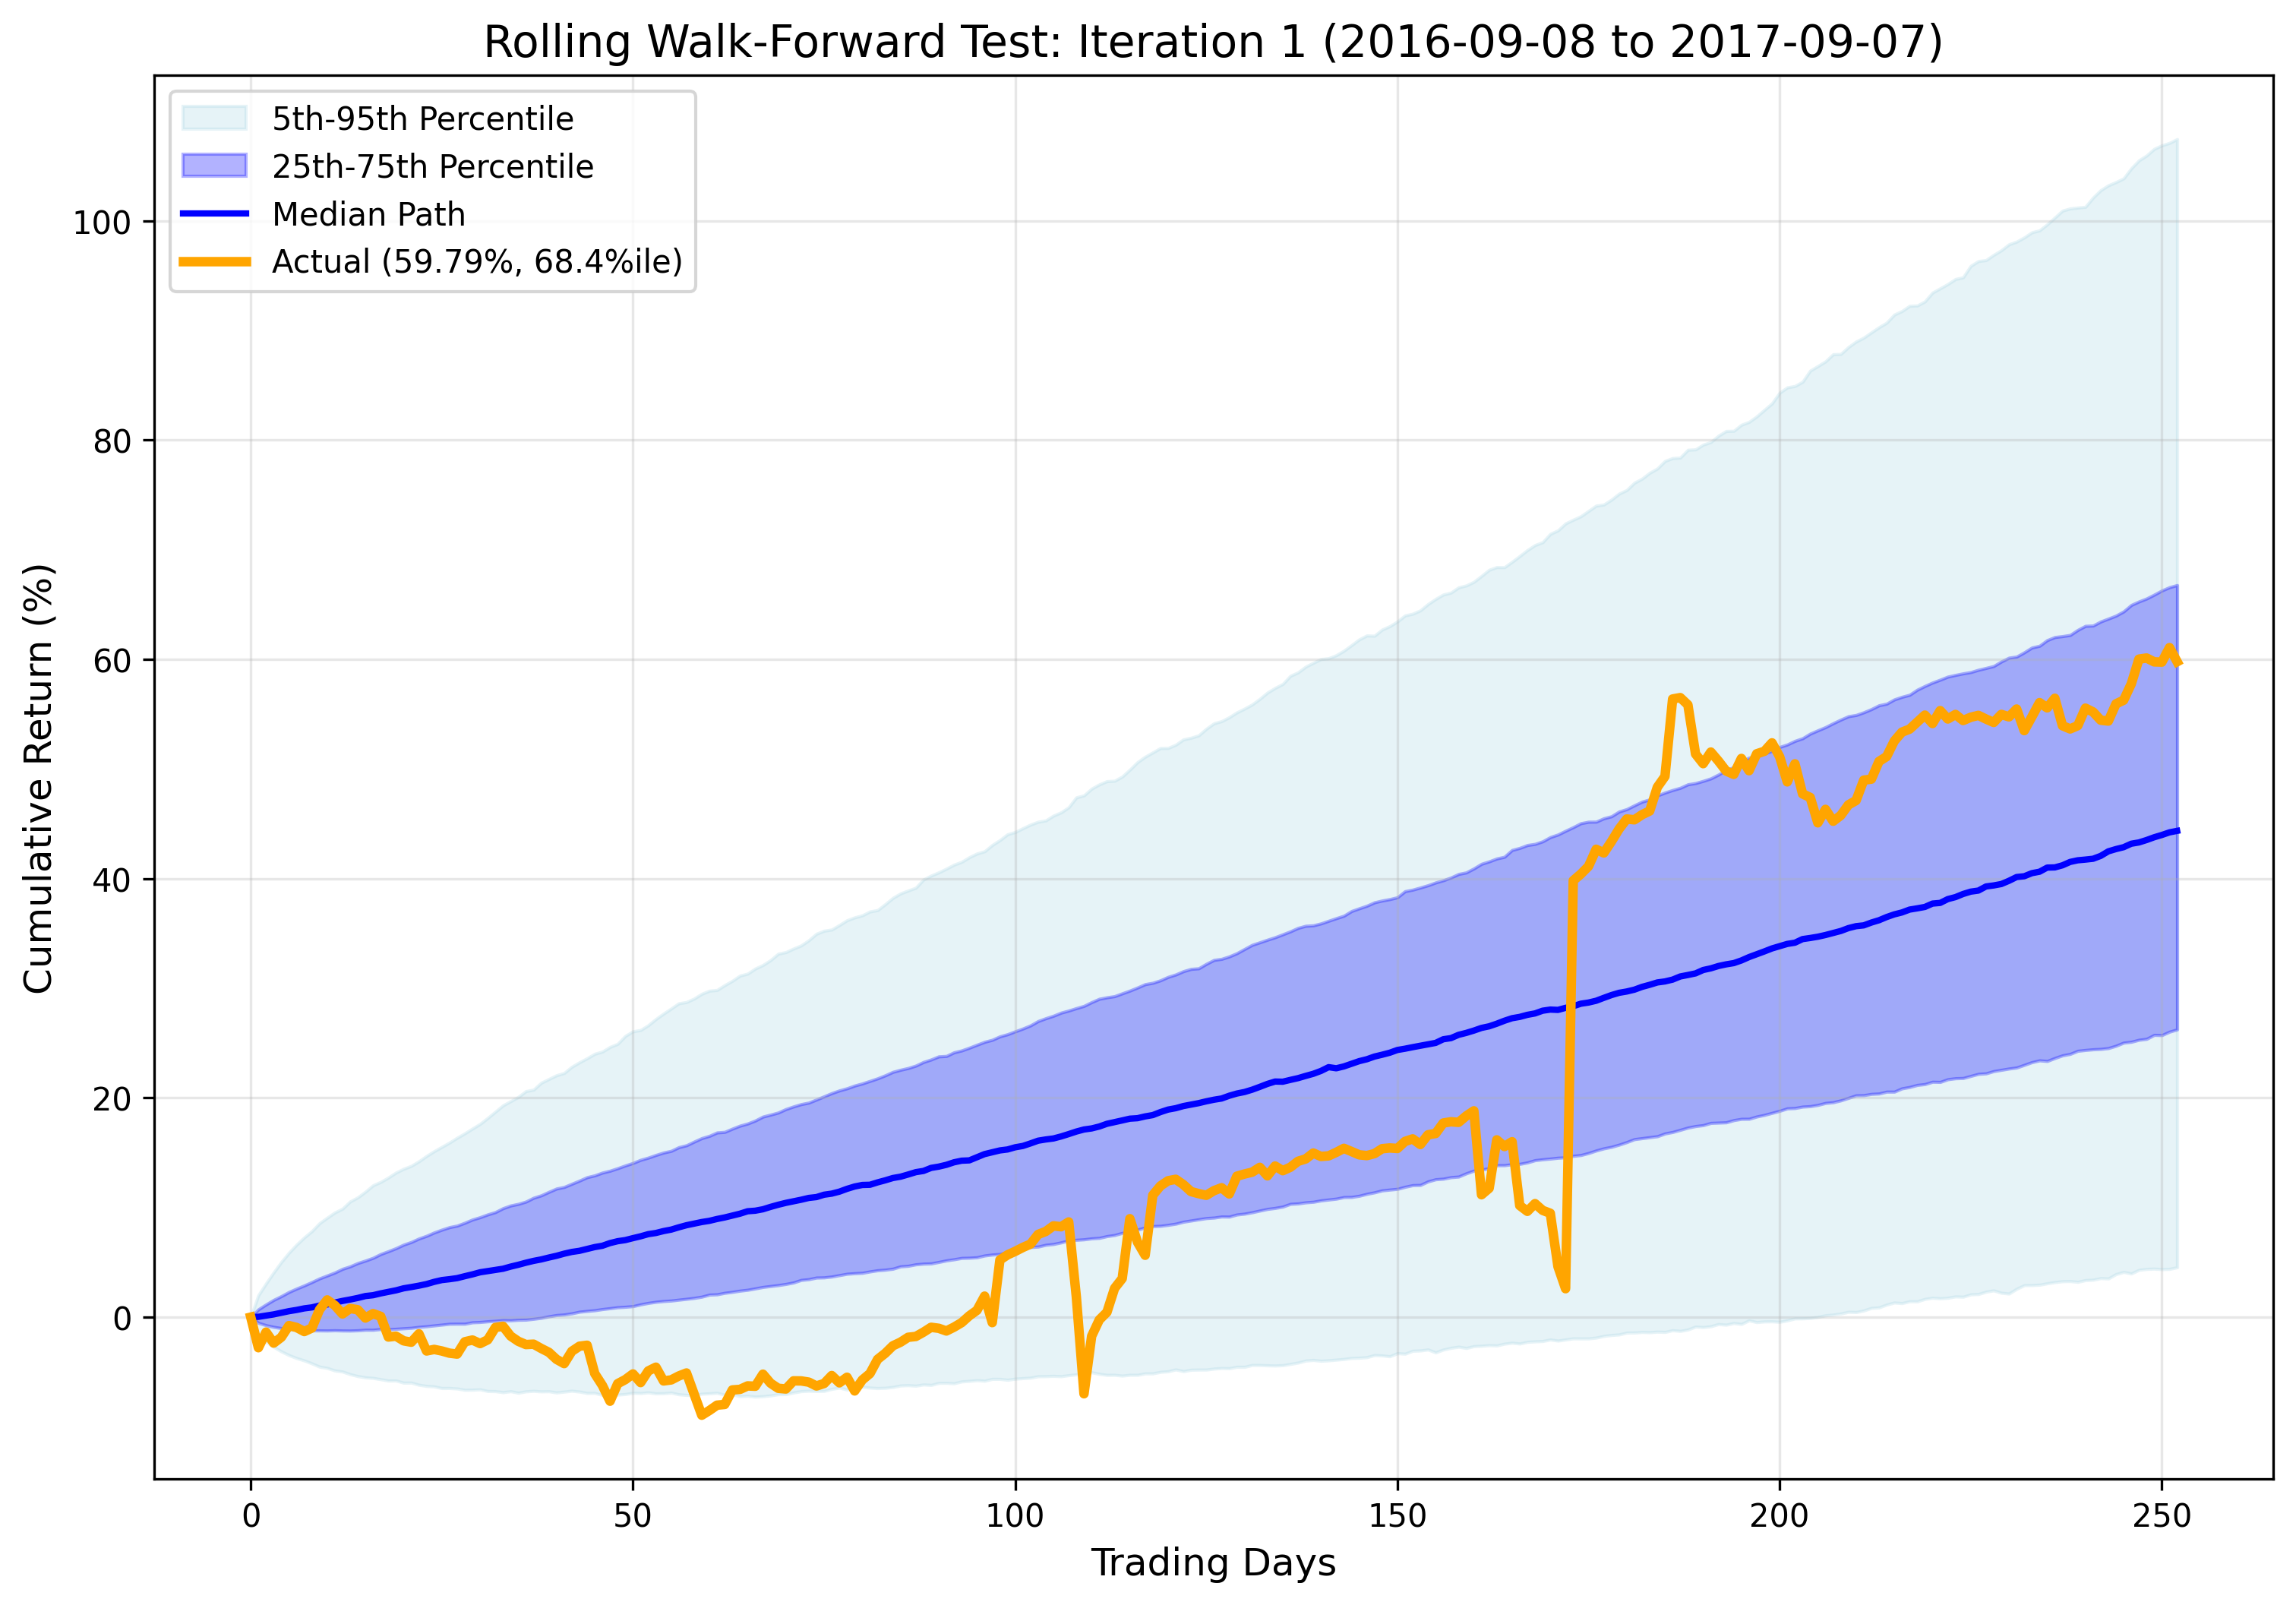
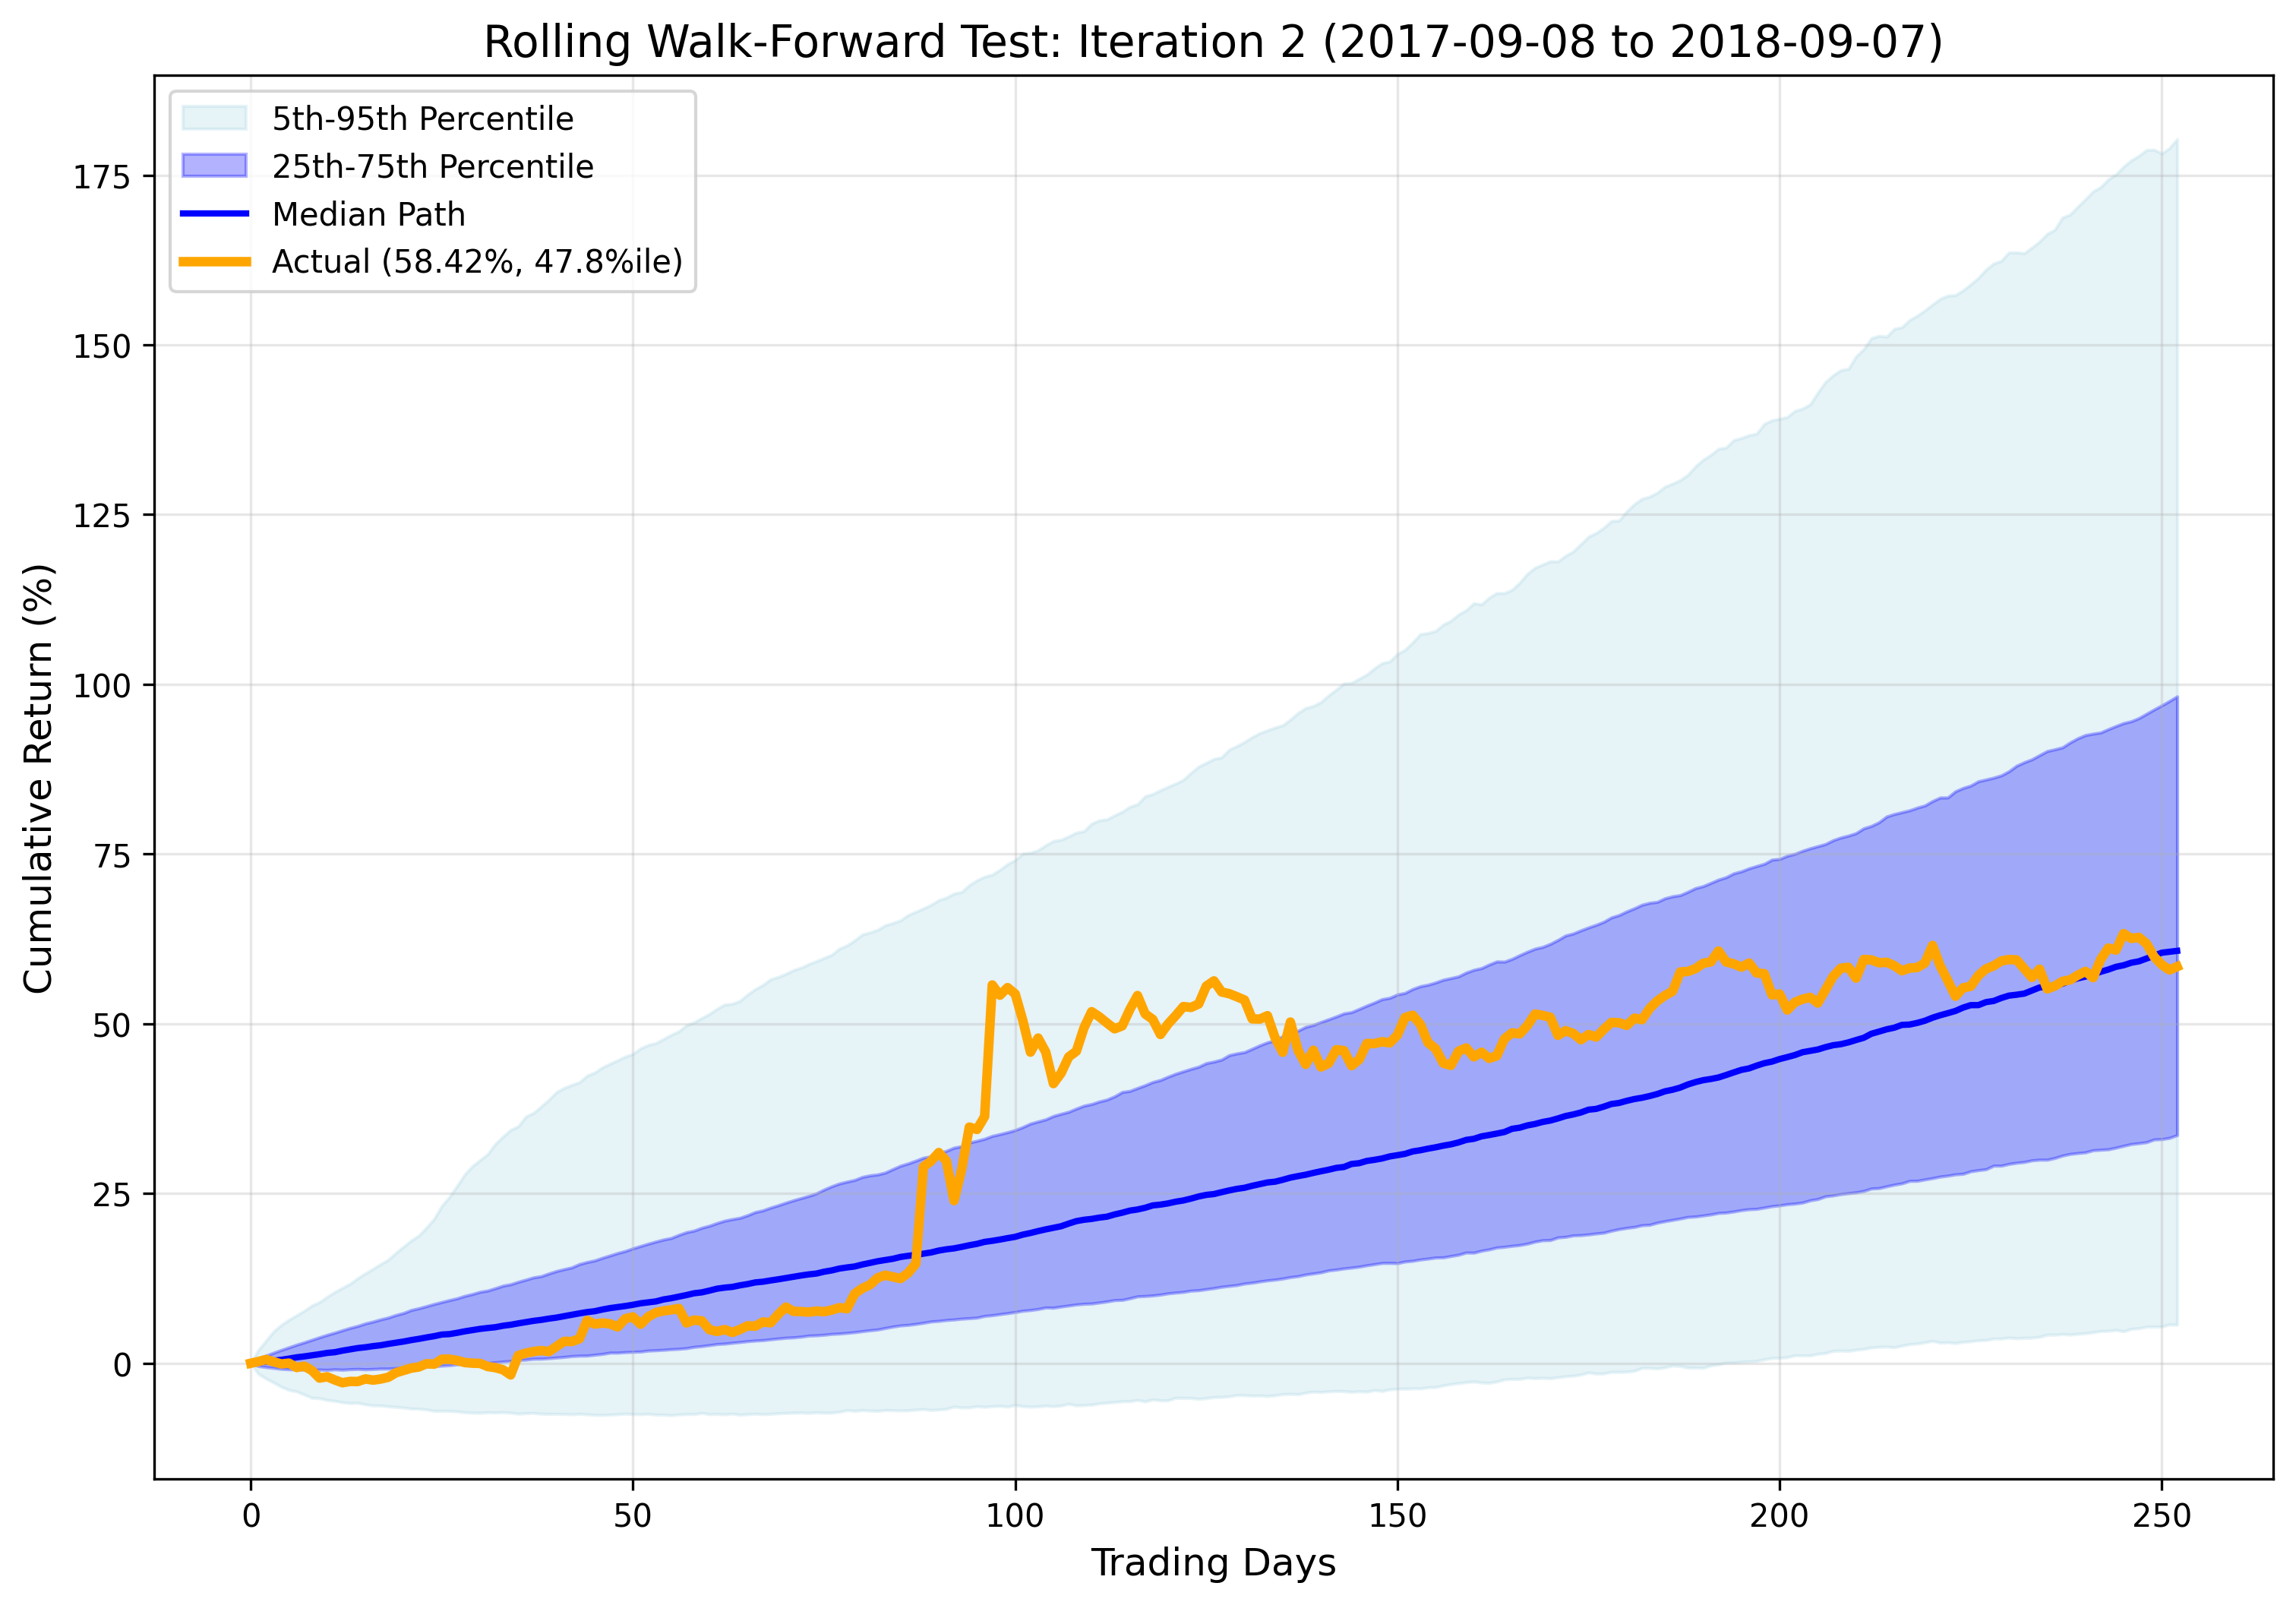
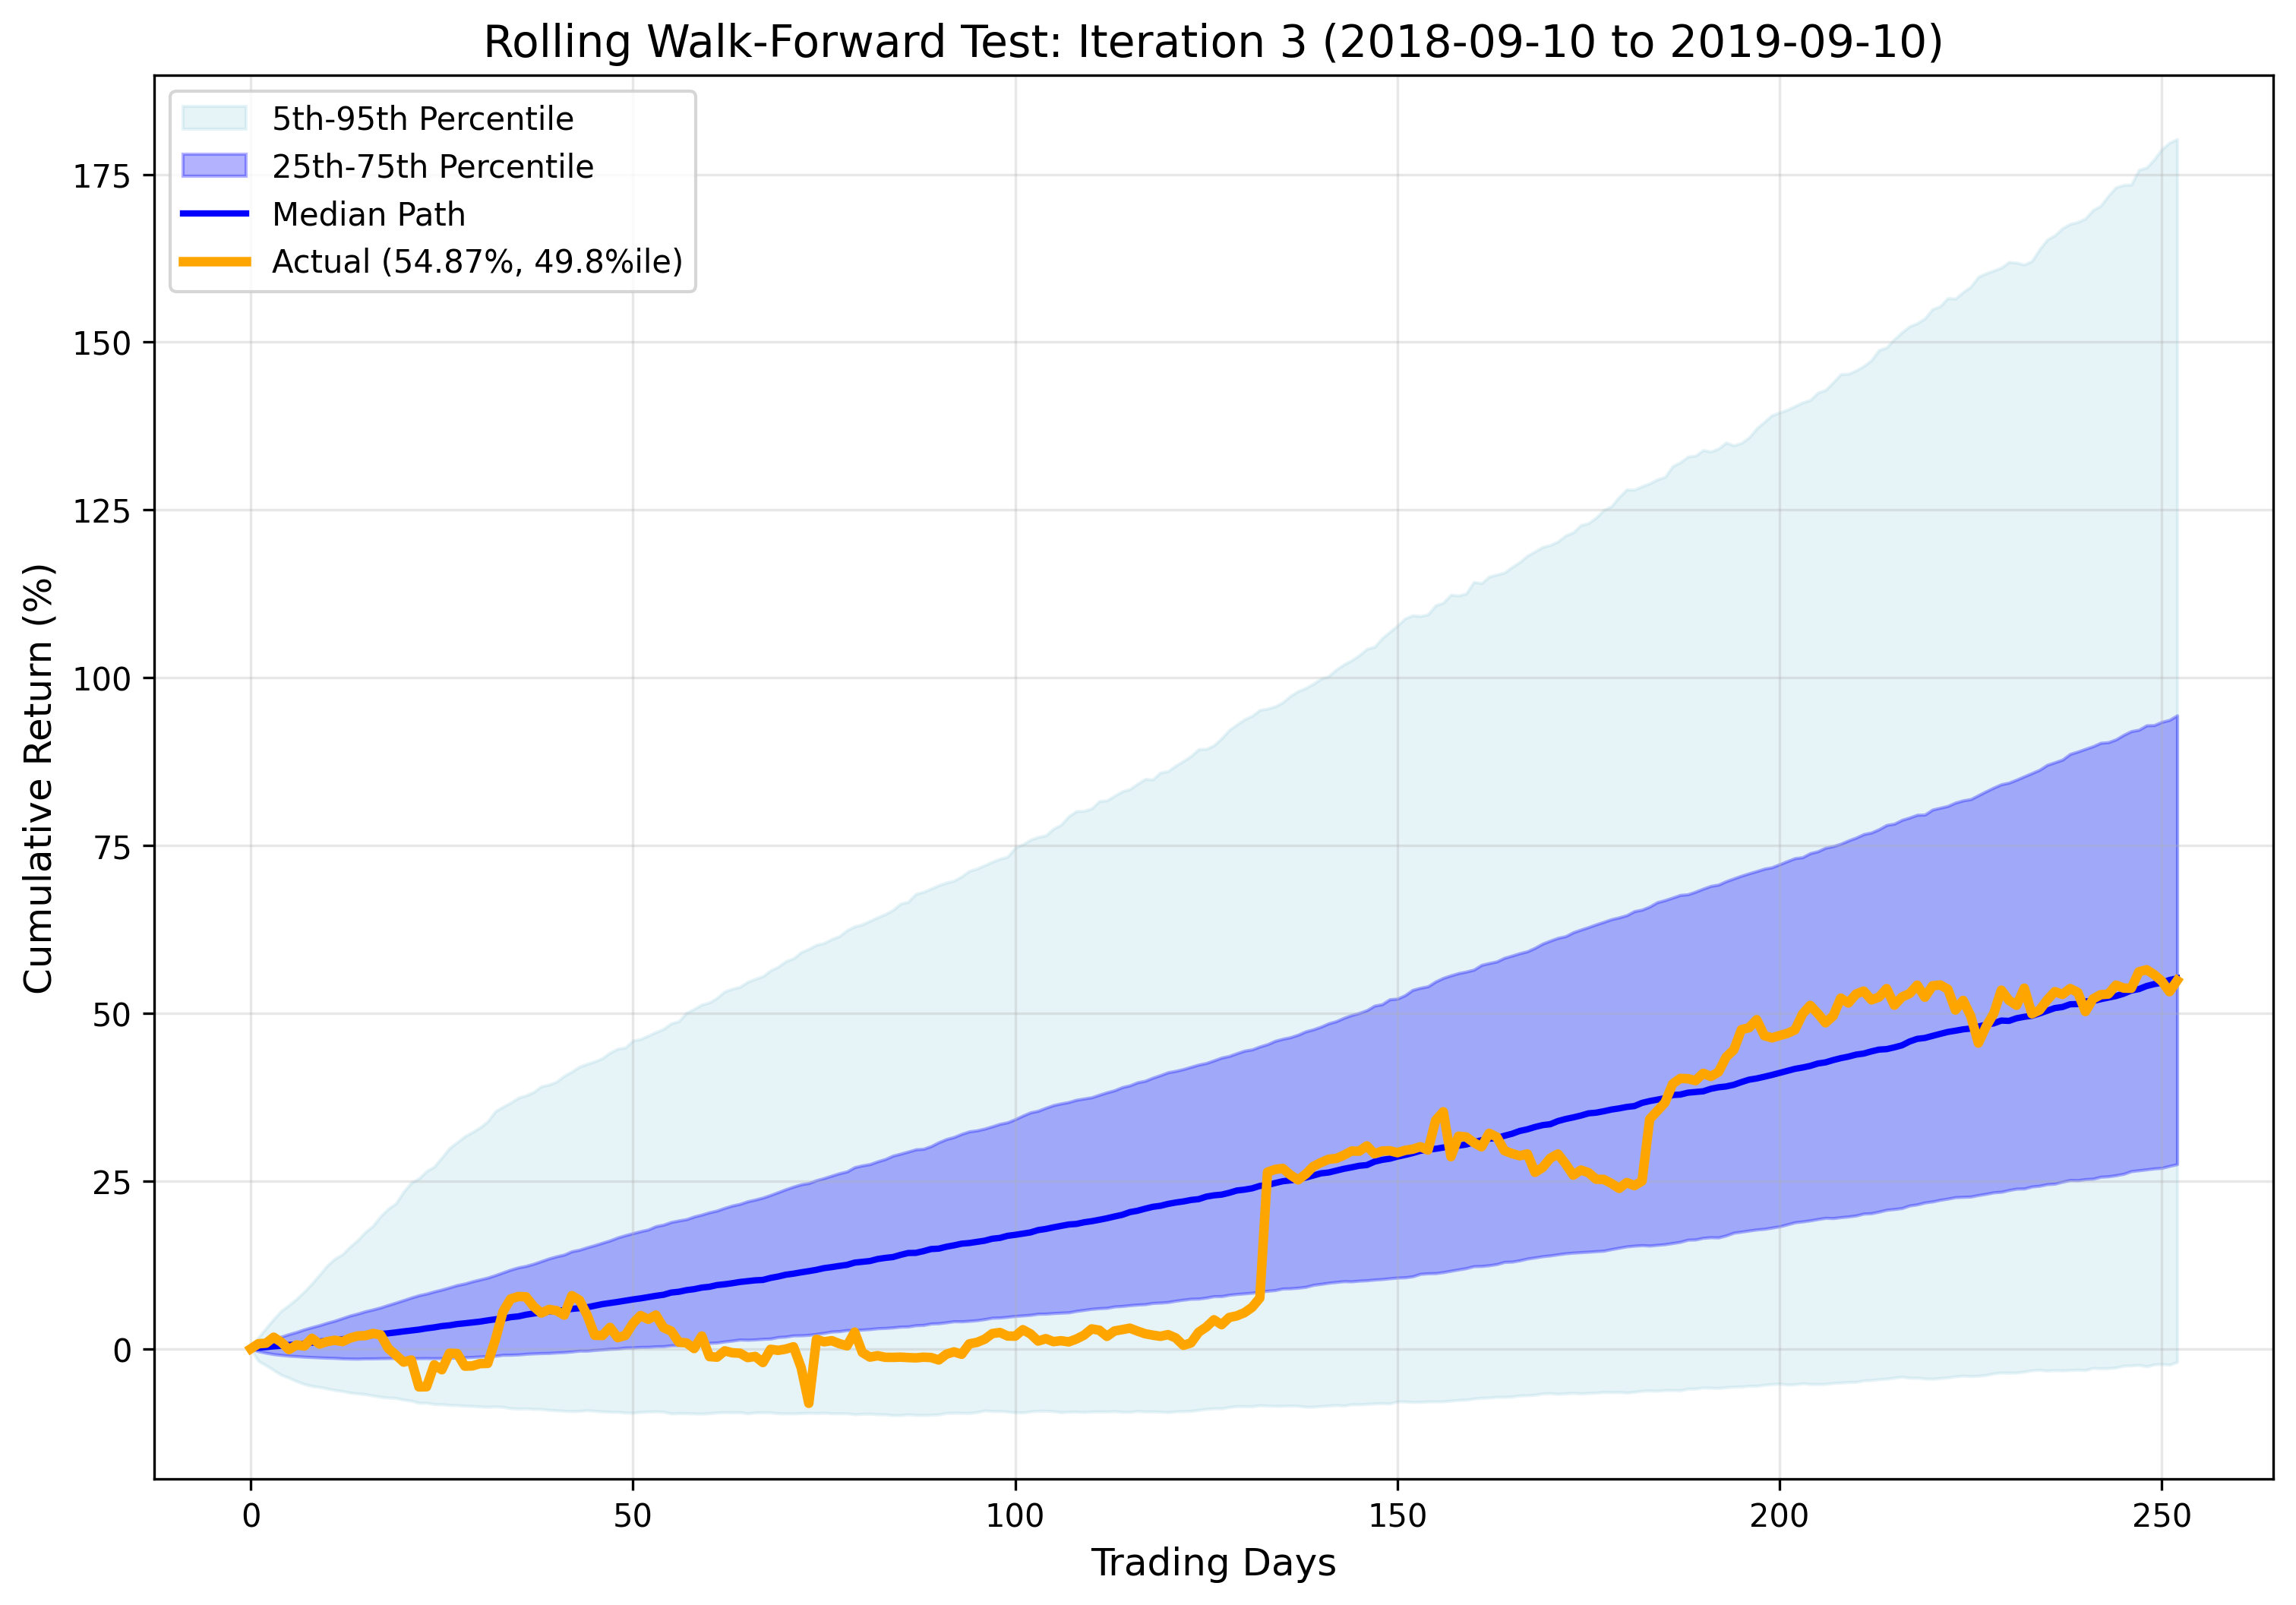
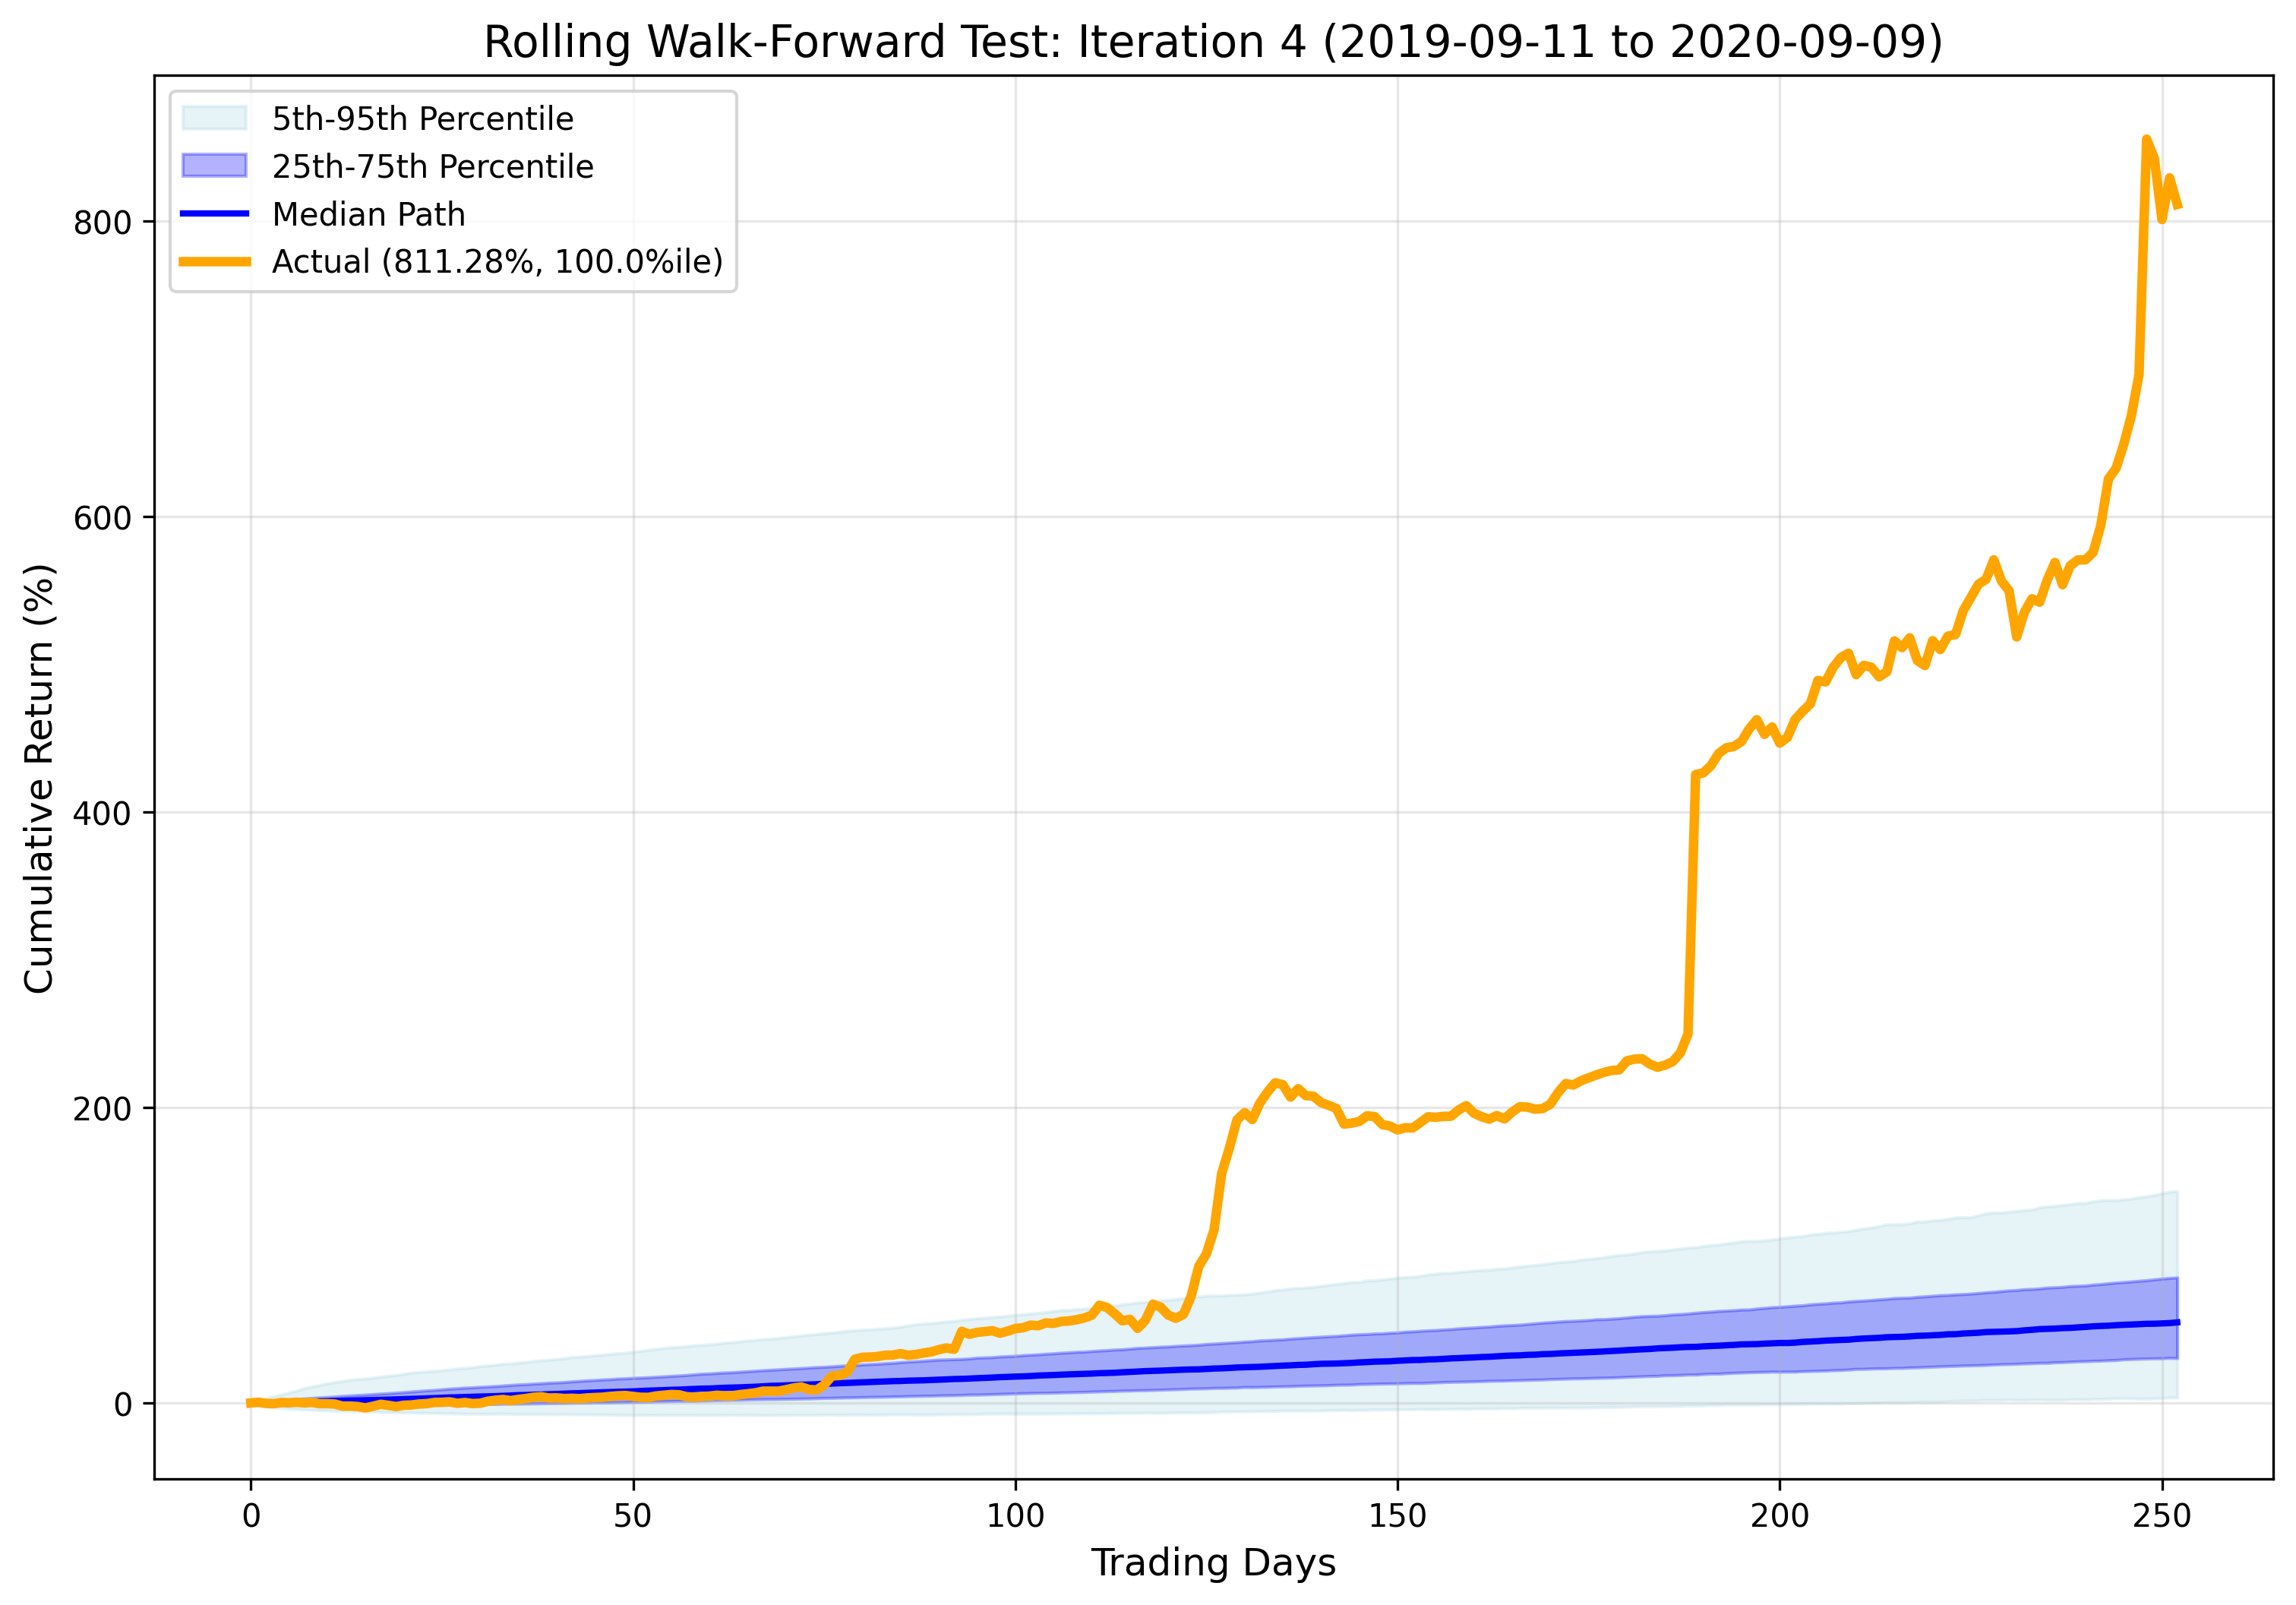
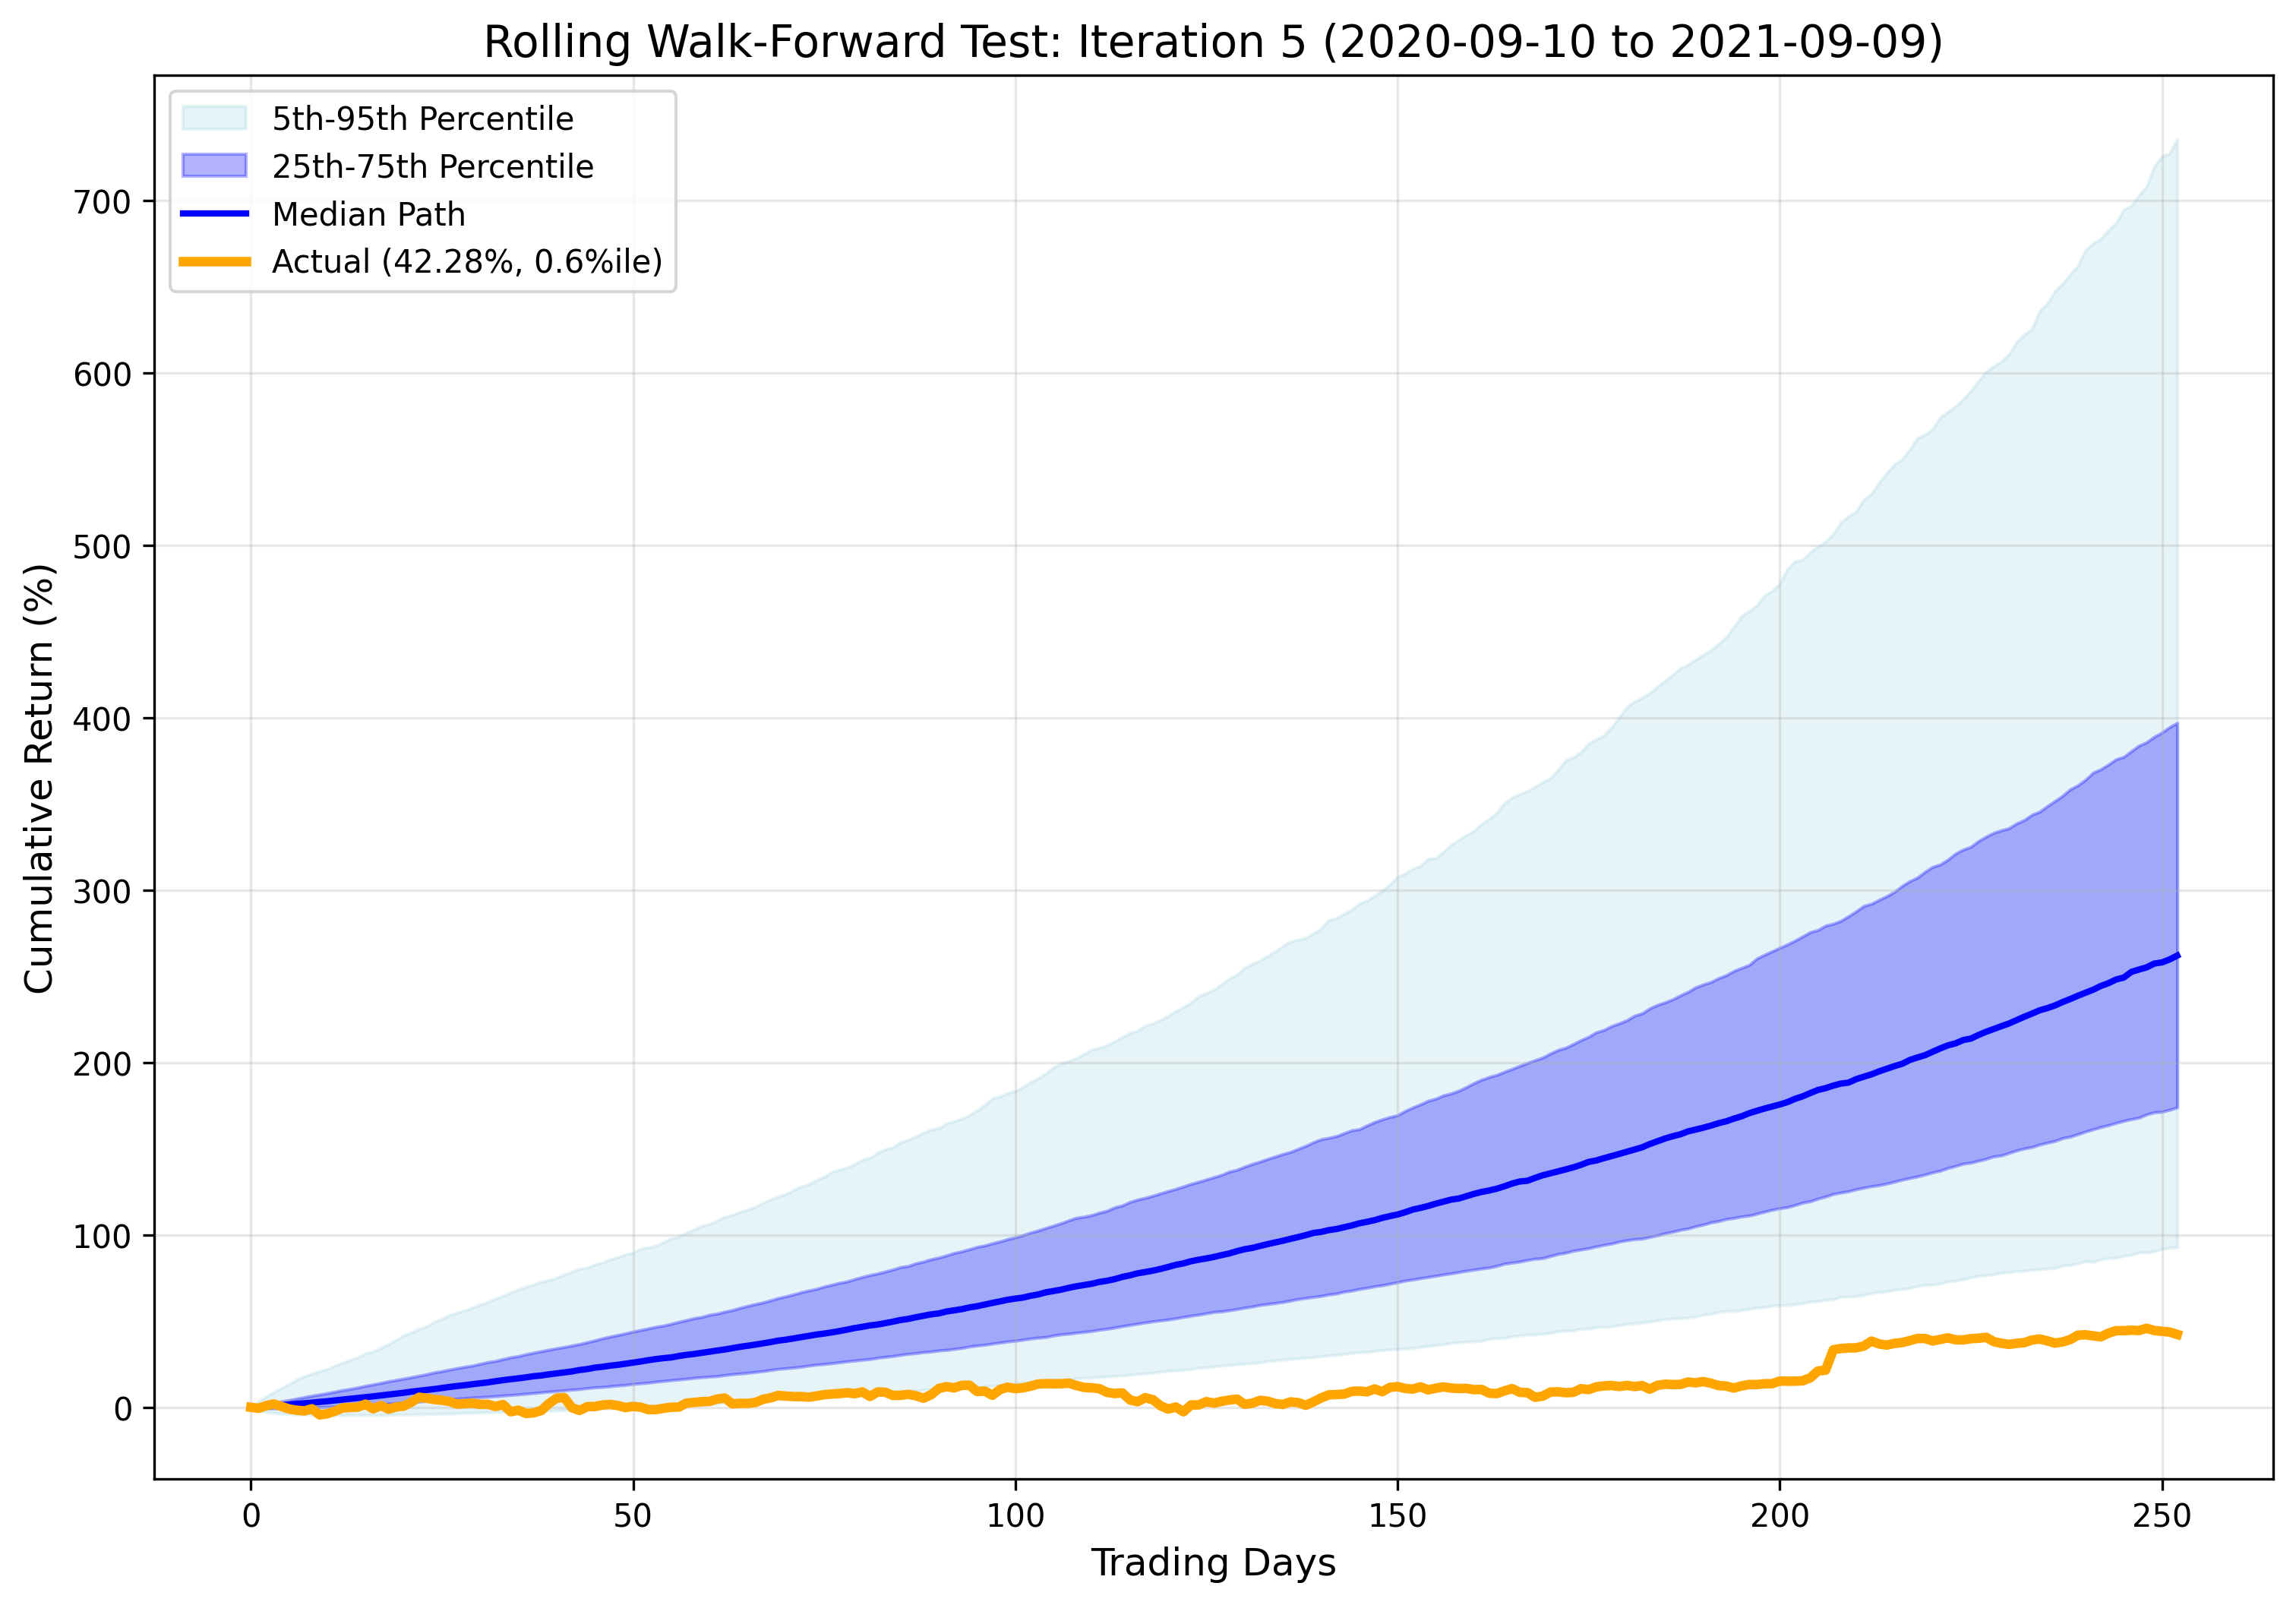
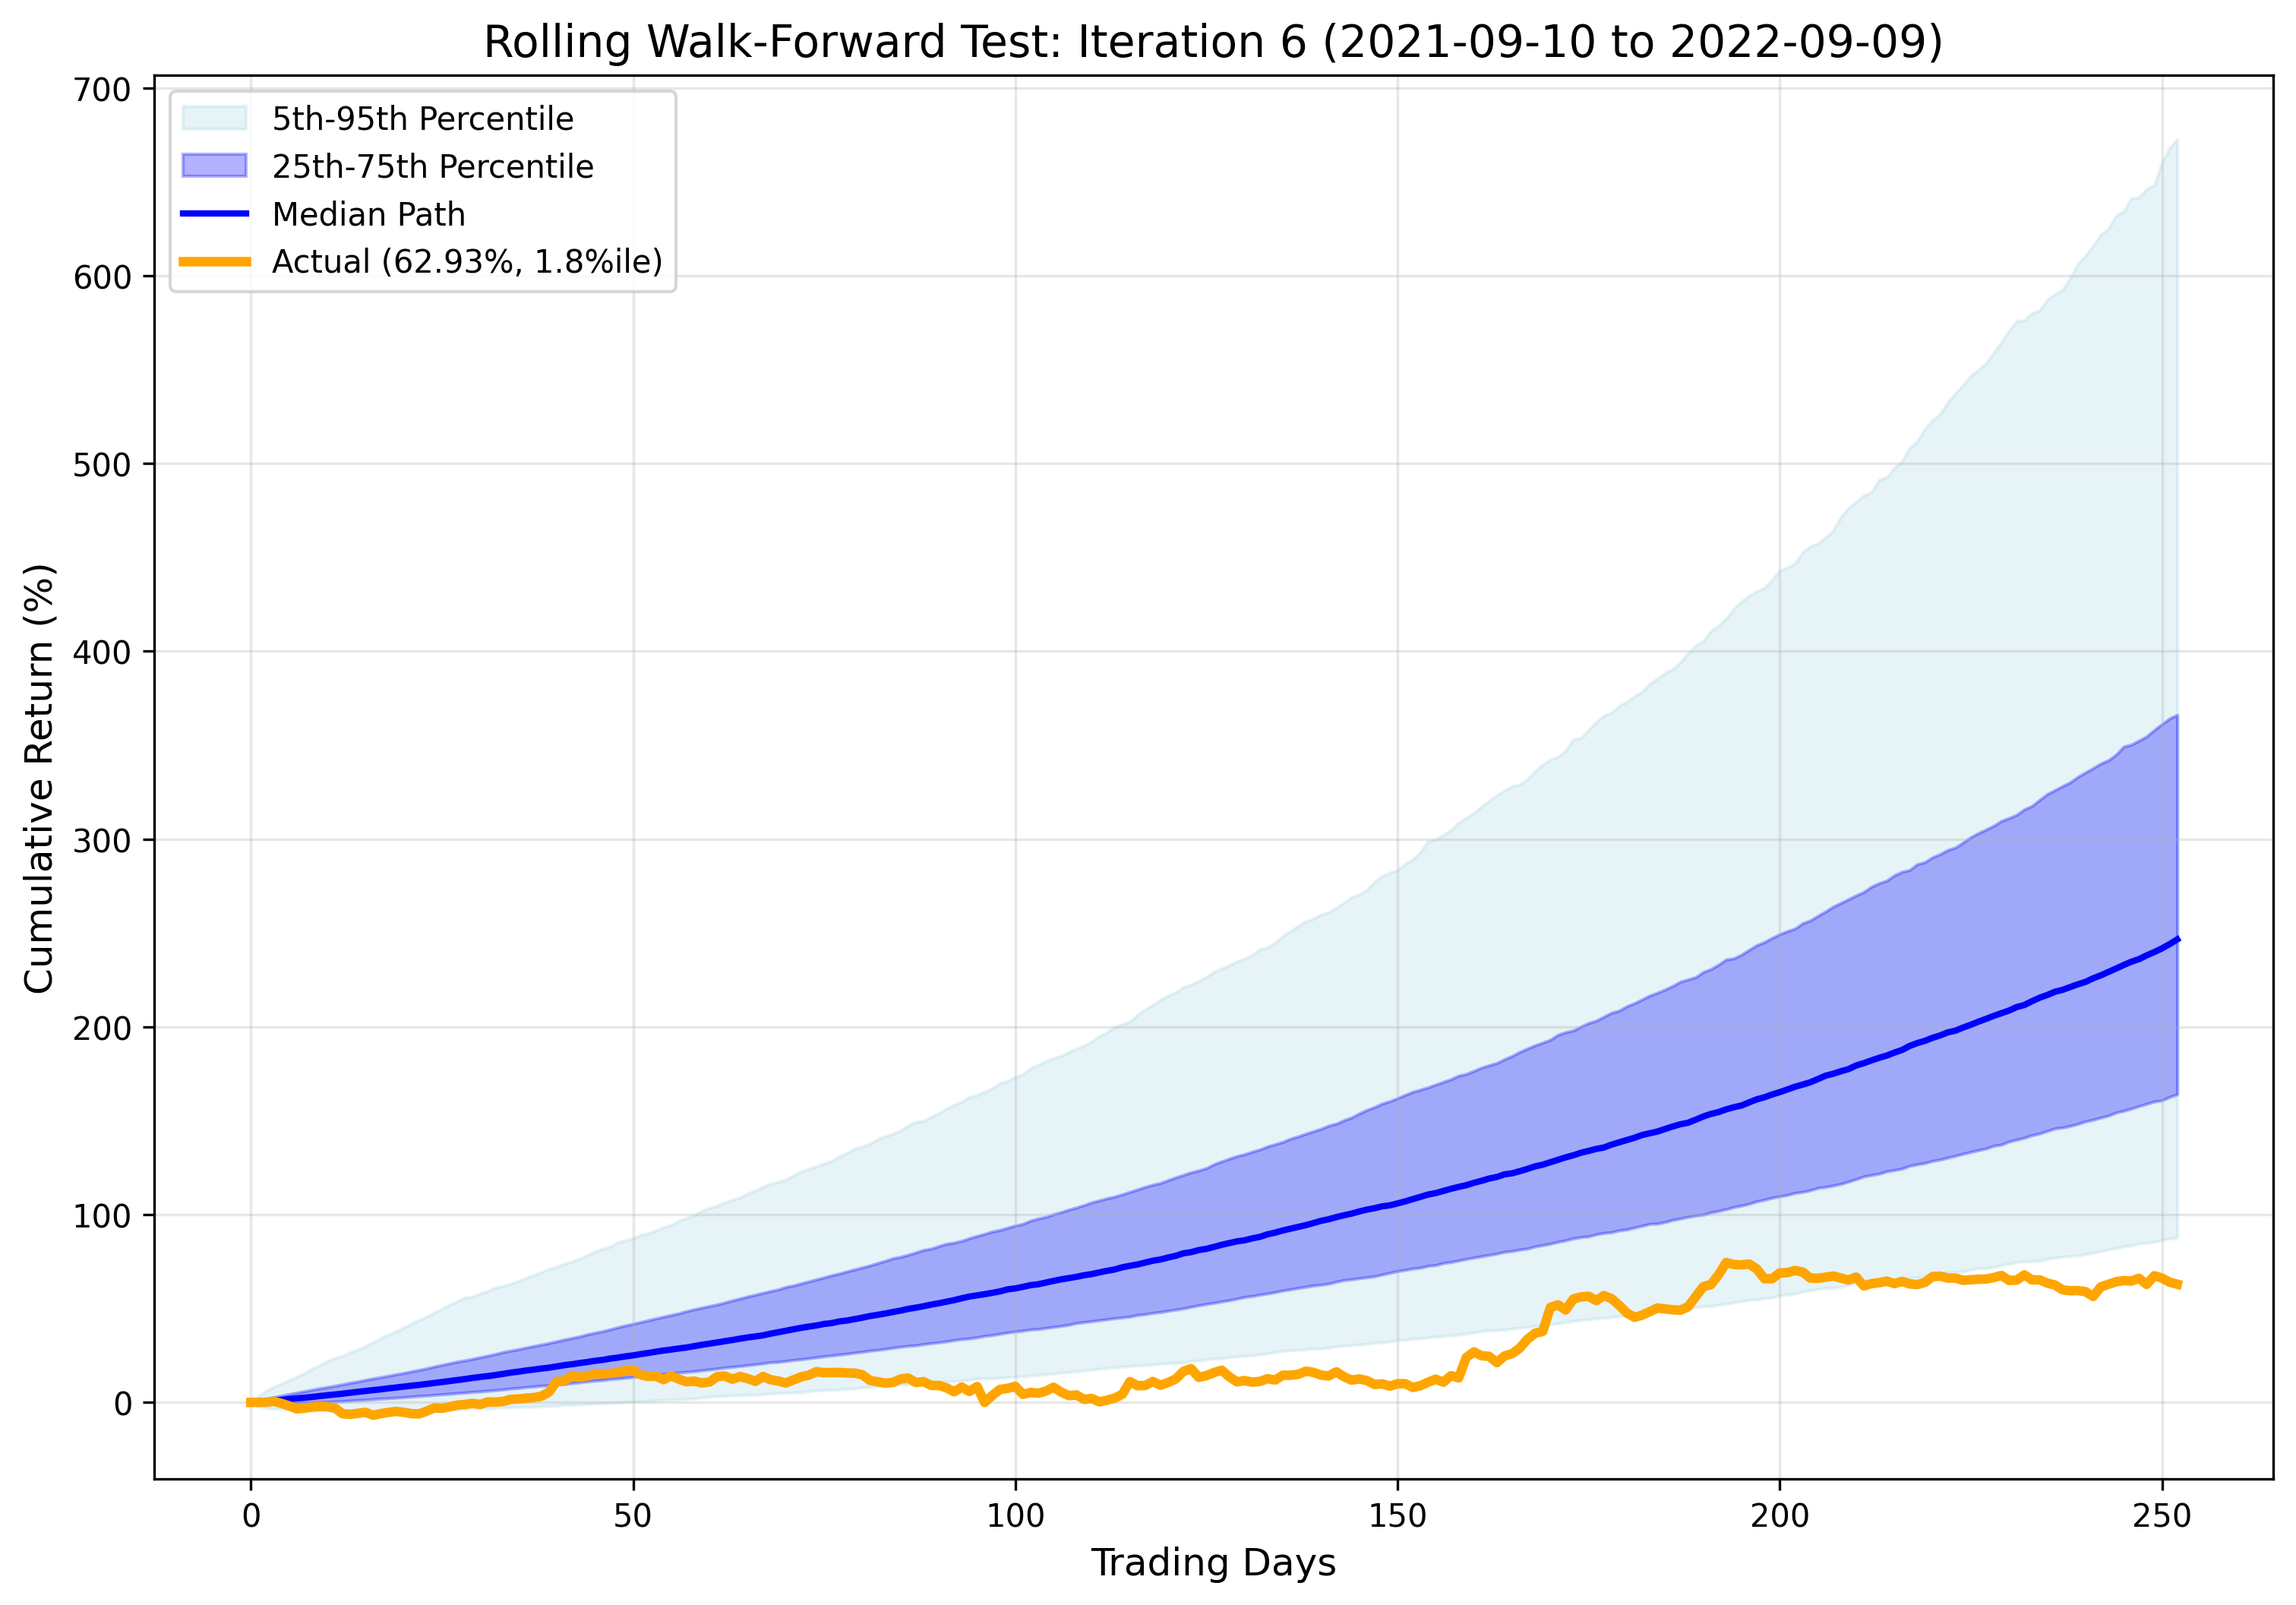
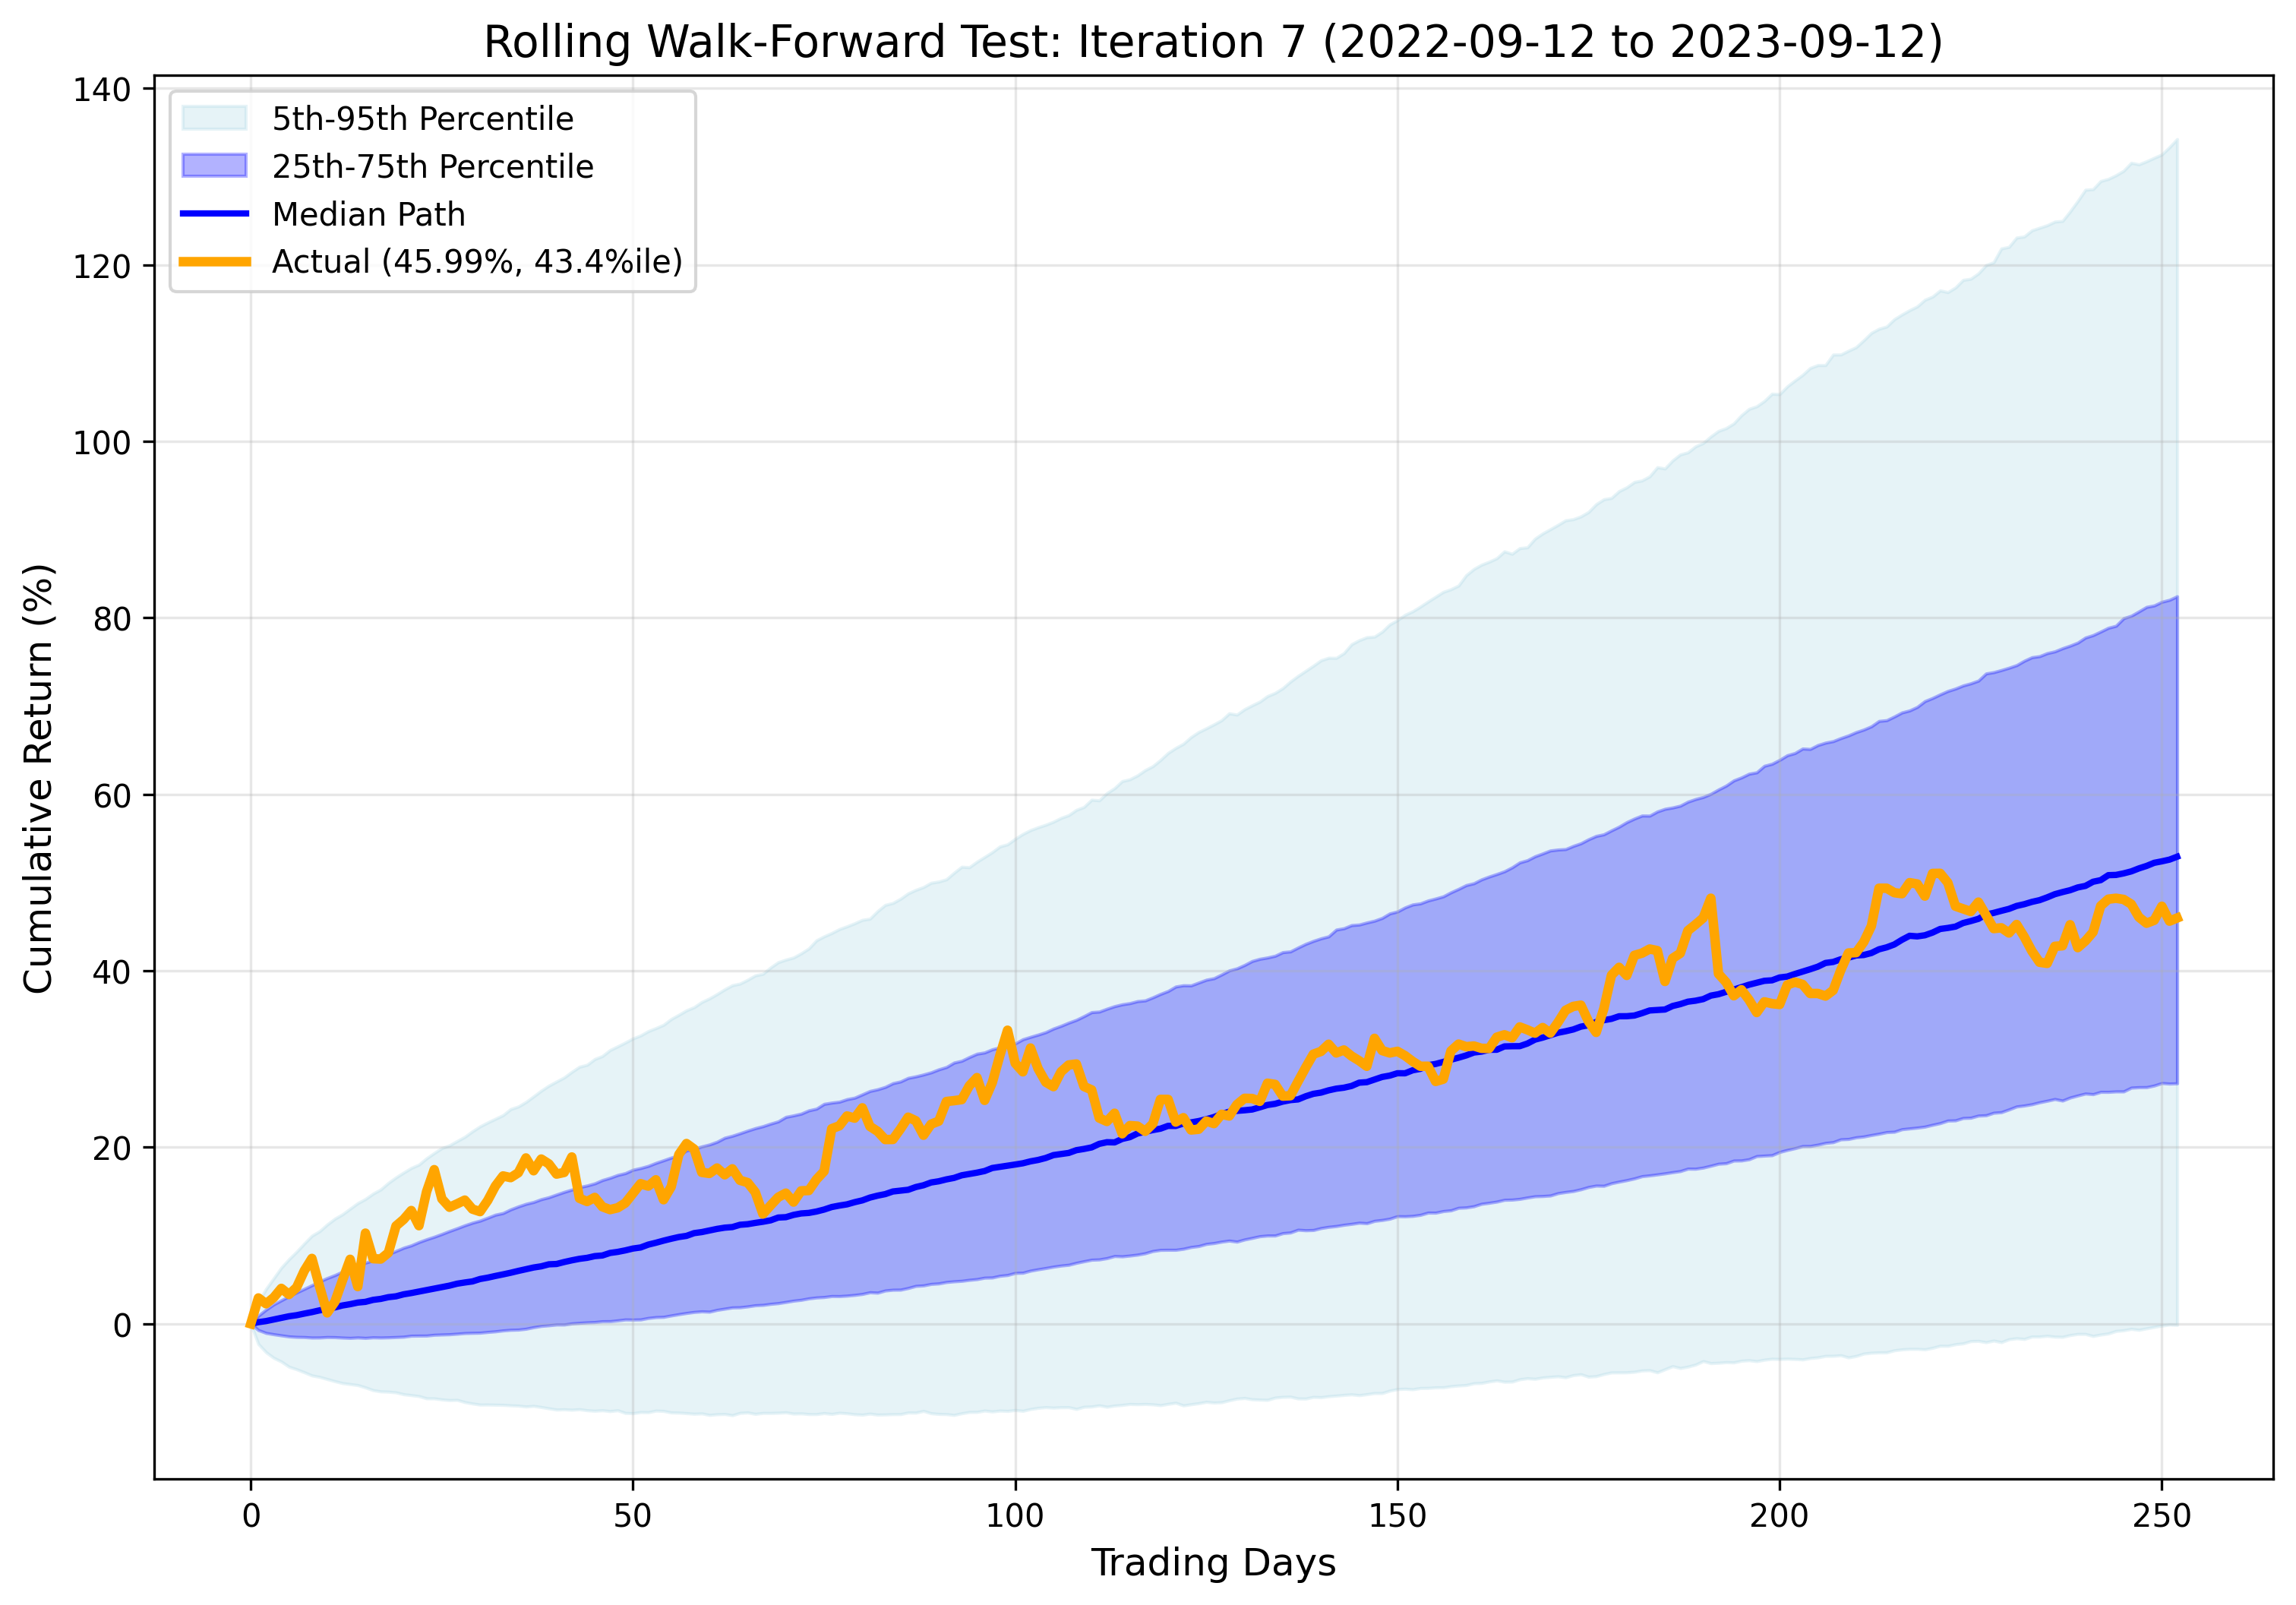
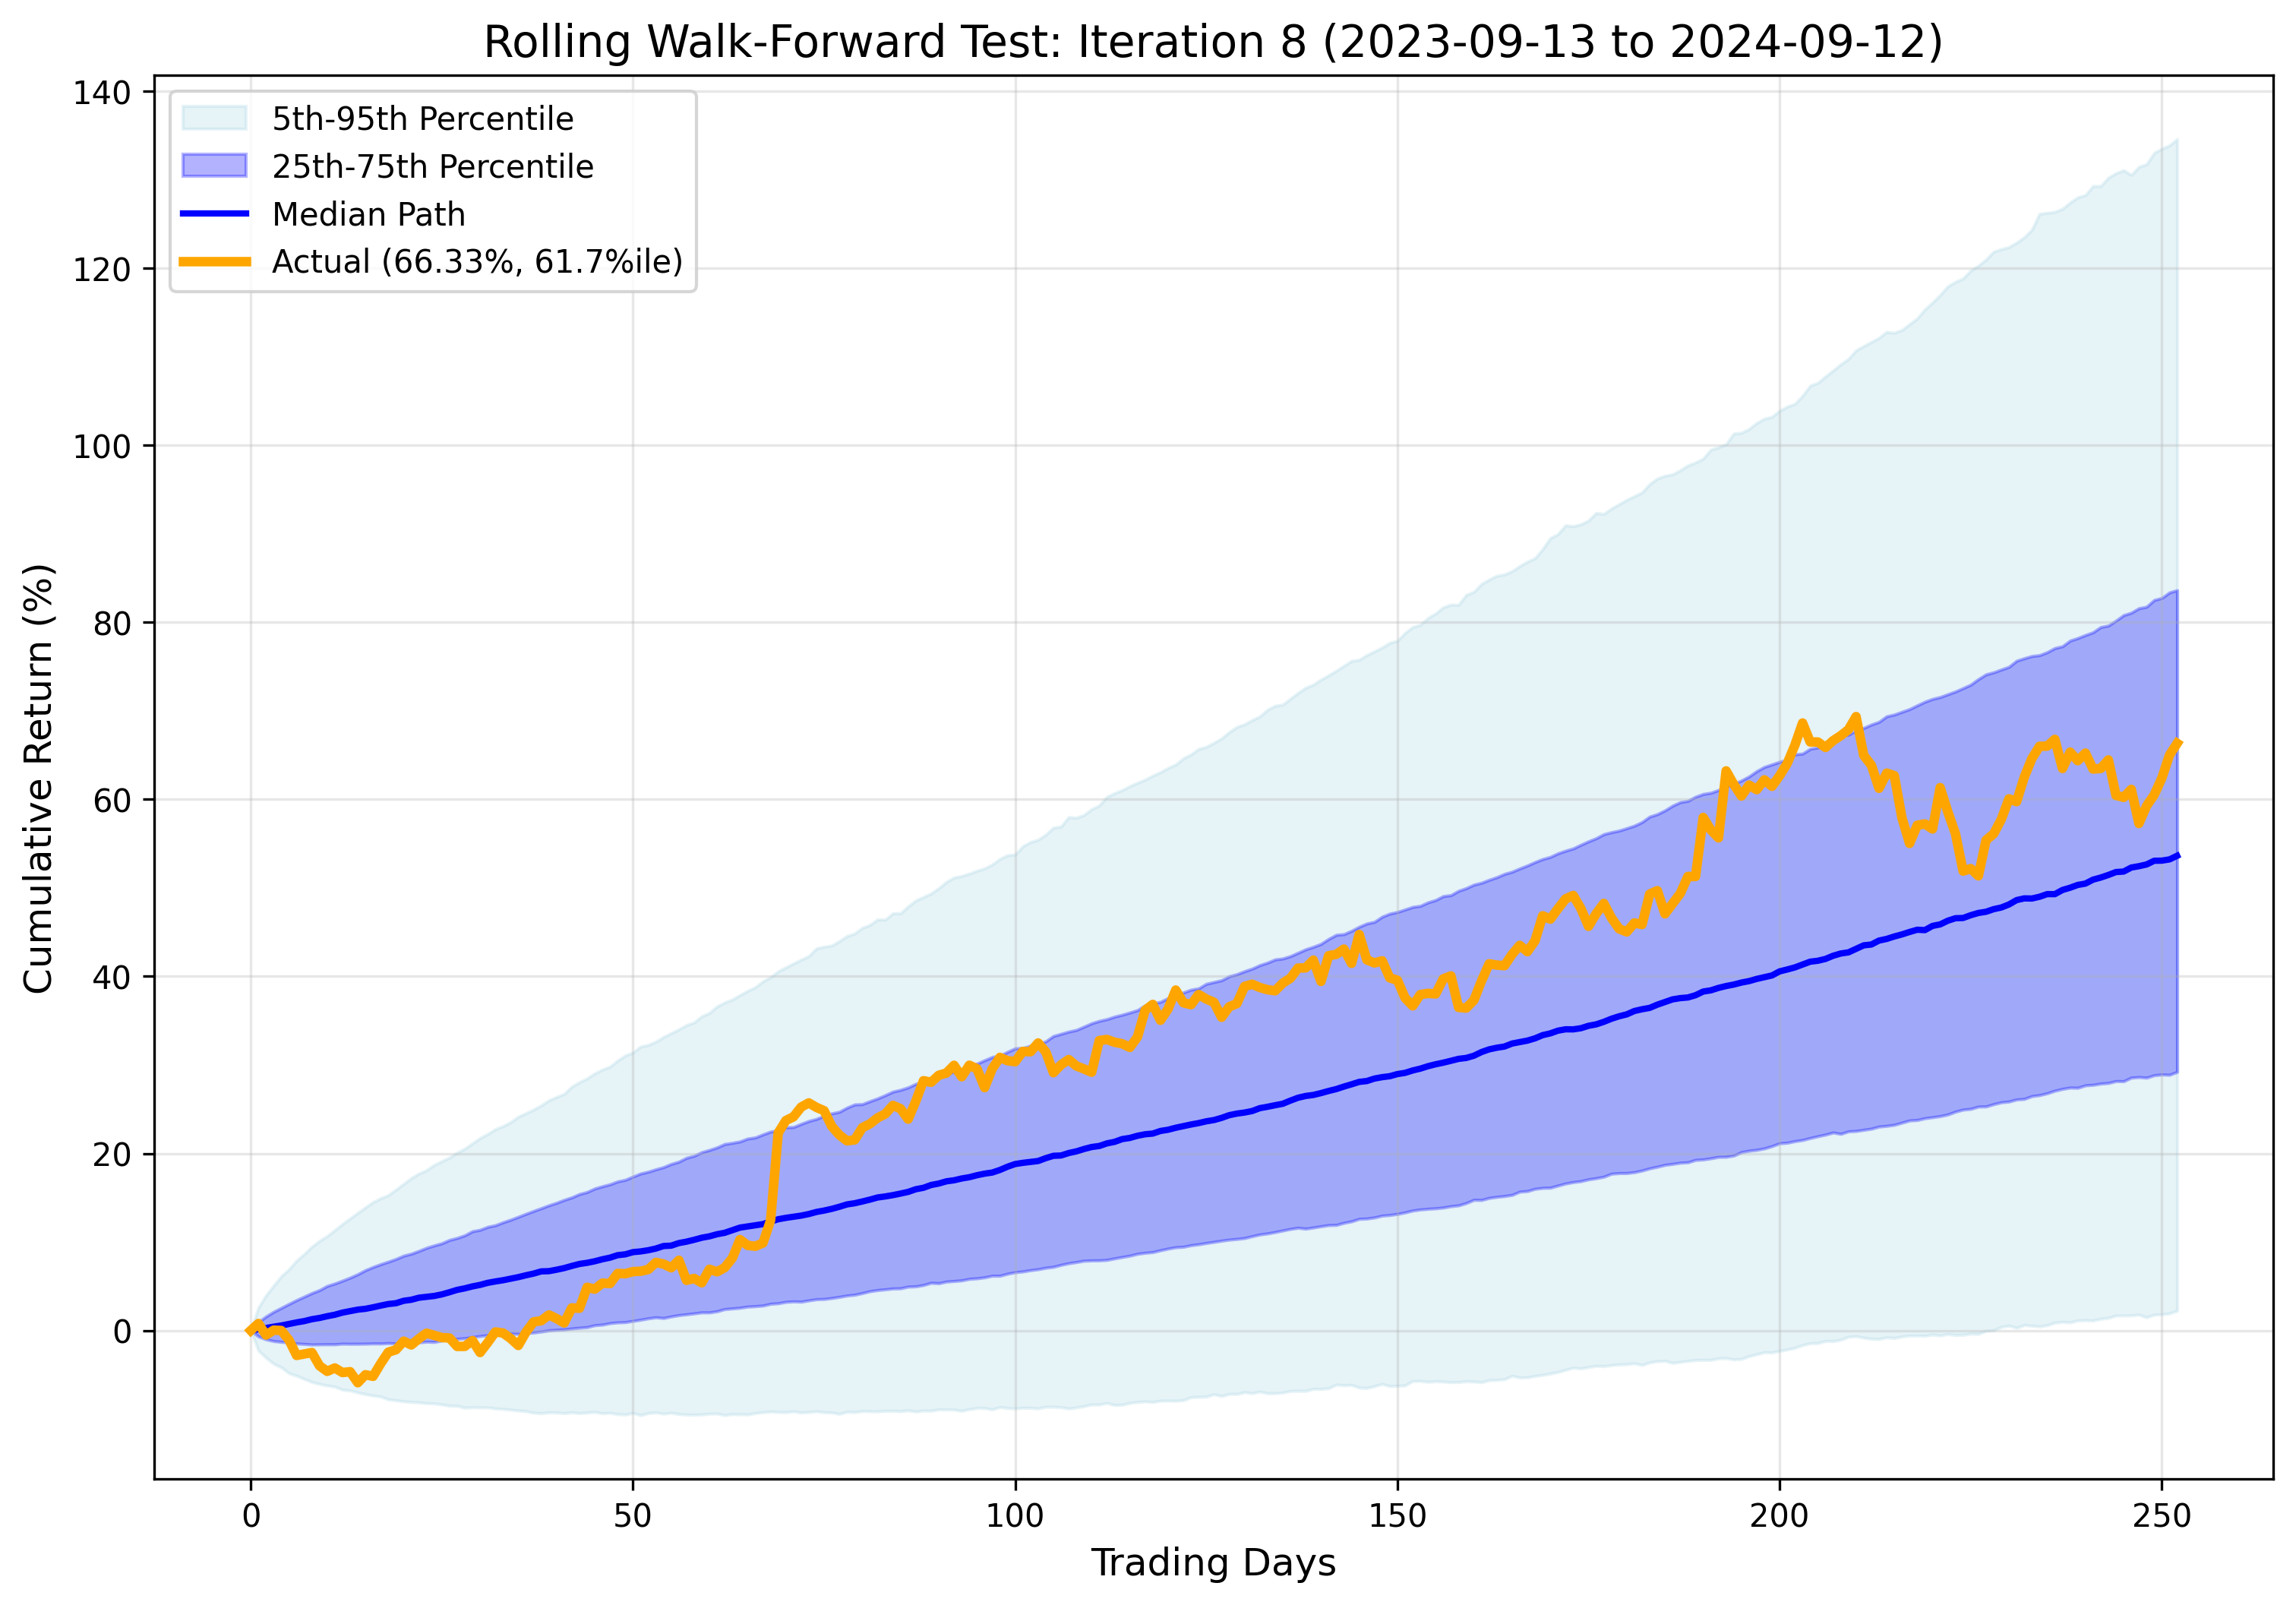
Monte Carlo robustness analysis to evaluate strategy's performance predictability using 10,000 simulations per test period within a rolling walk-forward framework
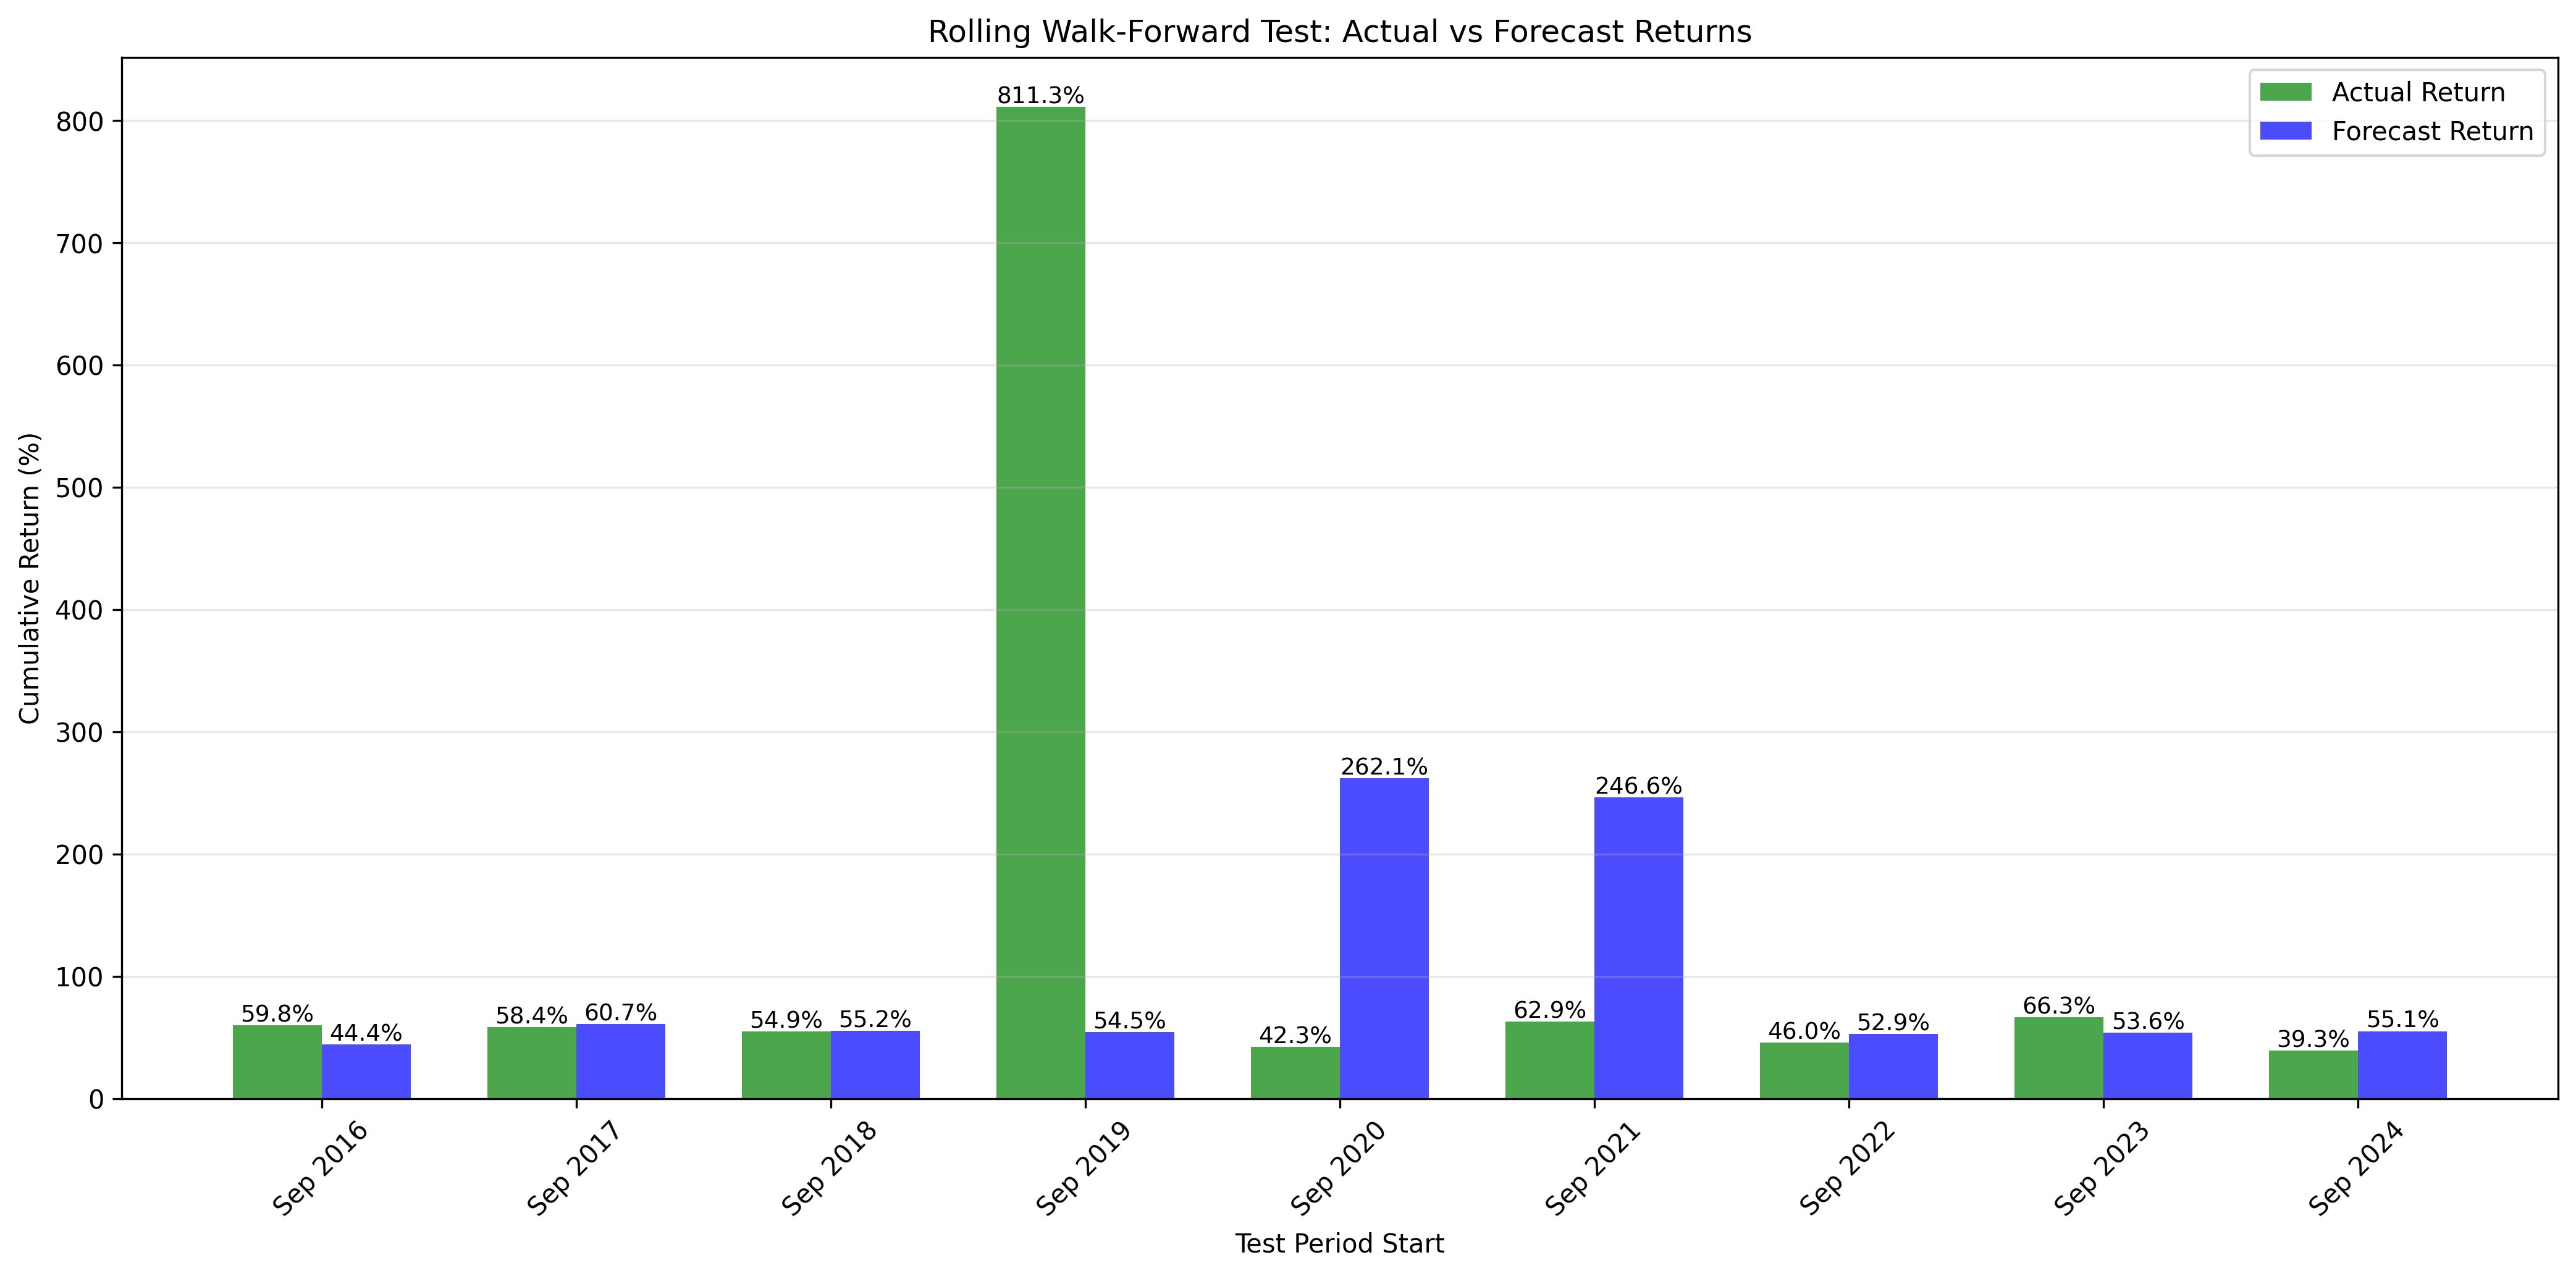
There is no evidence of curve-fitting to a single regime. Even excluding the anomaly year (Iteration 4), the strategy consistently delivered outstanding returns.
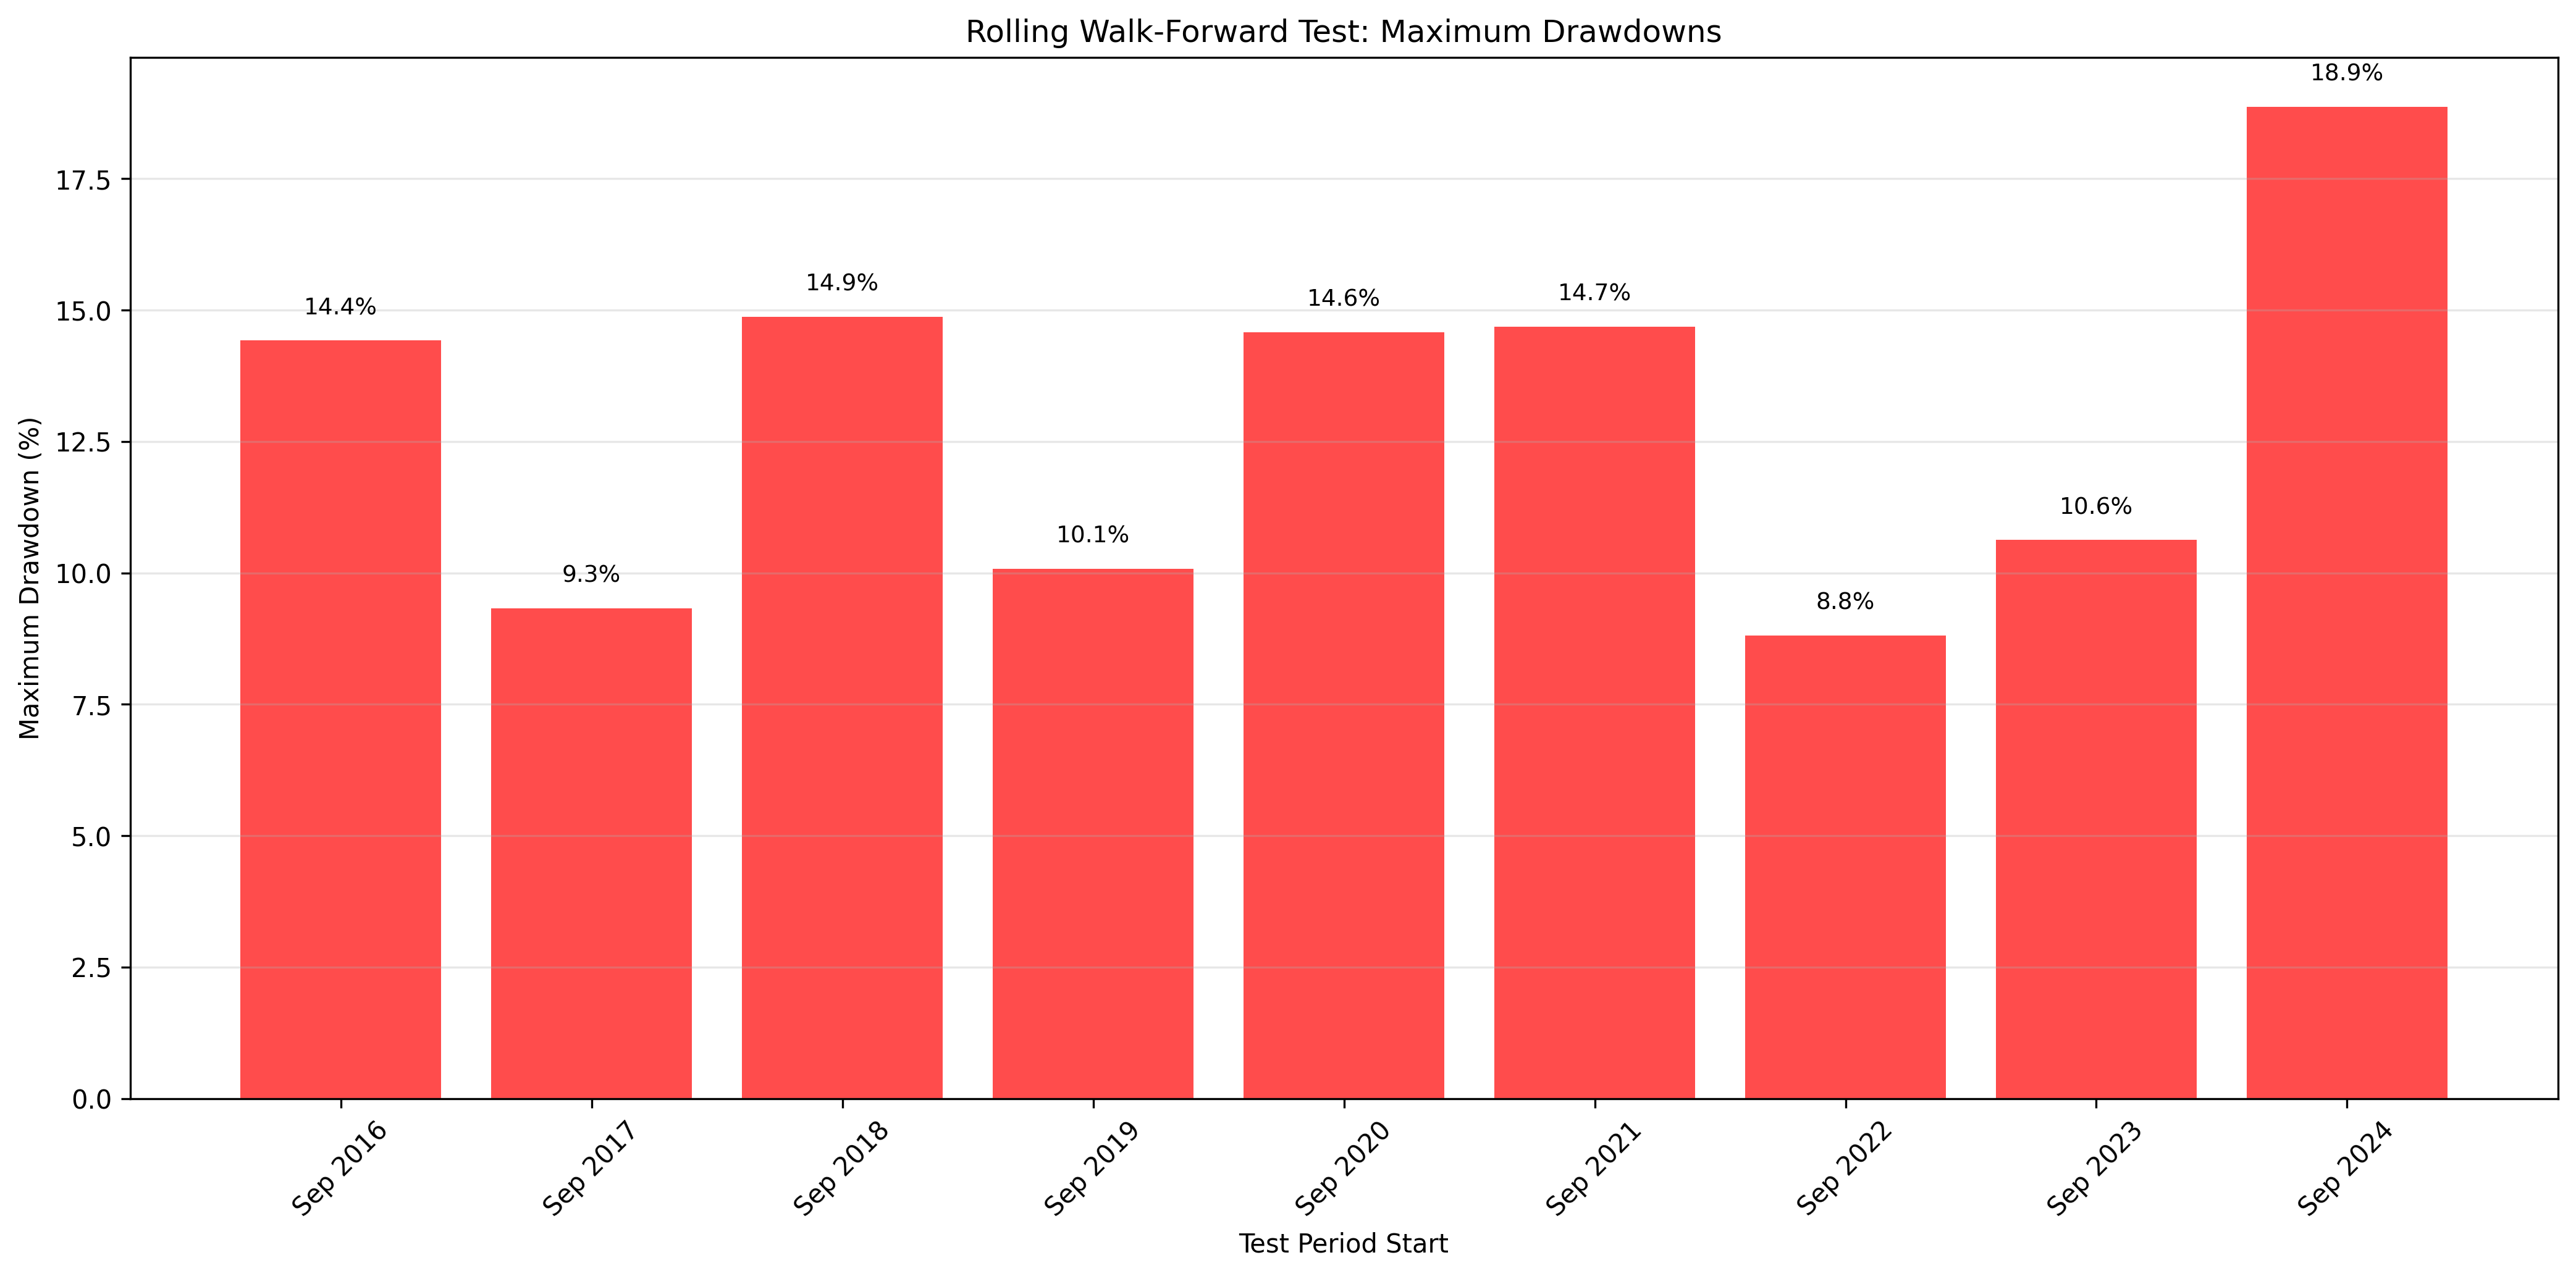
Across all distinct market environments (2015 chop, 2018 rate scares, 2020 crash, 2022 inflation bear), the strategy never suffered a big drawdown. This consistency allows for aggressive compounding without the “math of recovery” penalty that plagues buy-and-hold investors.
NOTE: This strategy is intentionally designed to capture outlier returns during specific market conditions. Following the periods of exceptional performance, Monte Carlo forecasts may appear overly optimistic in subsequent iterations, consequently making the strategy appear to underperform during those iterations. This is expected behavior as the simulations incorporate recent extreme returns into their probability distributions.
| Rank | Trading Days | Calendar Days | Max Drawdown | Start Date | End Date |
|---|---|---|---|---|---|
| 1 | 85 | 125 | 10.36% | 2016-09-22 | 2017-01-25 |
| 2 | 58 | 83 | 7.30% | 2017-06-07 | 2017-08-29 |
| Rank | Trading Days | Calendar Days | Max Drawdown | Start Date | End Date |
|---|---|---|---|---|---|
| 1 | 28 | 39 | 9.33% | 2018-01-29 | 2018-03-09 |
| 2 | 60 | 86 | 8.12% | 2018-03-12 | 2018-06-06 |
| 3 | 27 | 40 | 5.41% | 2018-06-14 | 2018-07-24 |
| 4 | 24 | 34 | 4.64% | 2018-07-25 | 2018-08-28 |
| 5 | 22 | 30 | 3.40% | 2017-09-12 | 2017-10-12 |
| Rank | Trading Days | Calendar Days | Max Drawdown | Start Date | End Date |
|---|---|---|---|---|---|
| 1 | 90 | 134 | 14.87% | 2018-11-07 | 2019-03-21 |
| 2 | 27 | 40 | 8.44% | 2019-04-25 | 2019-06-04 |
| 3 | 16 | 22 | 7.79% | 2018-10-02 | 2018-10-24 |
| 4 | 25 | 36 | 5.62% | 2019-07-29 | 2019-09-03 |
| Rank | Trading Days | Calendar Days | Max Drawdown | Start Date | End Date |
|---|---|---|---|---|---|
| 1 | 39 | 56 | 10.08% | 2020-03-24 | 2020-05-19 |
| 2 | 24 | 34 | 3.83% | 2019-09-12 | 2019-10-16 |
| Rank | Trading Days | Calendar Days | Max Drawdown | Start Date | End Date |
|---|---|---|---|---|---|
| 1 | 80 | 117 | 14.58% | 2021-02-12 | 2021-06-09 |
| 2 | 46 | 65 | 8.92% | 2020-10-12 | 2020-12-16 |
| 3 | 17 | 23 | 6.23% | 2020-09-15 | 2020-10-08 |
| Rank | Trading Days | Calendar Days | Max Drawdown | Start Date | End Date |
|---|---|---|---|---|---|
| 1 | 72 | 108 | 14.69% | 2021-11-19 | 2022-03-07 |
| 2 | 59 | 85 | 10.35% | 2022-06-16 | 2022-09-09 |
| 3 | 35 | 50 | 8.50% | 2022-03-08 | 2022-04-27 |
| 4 | 30 | 42 | 7.36% | 2021-09-15 | 2021-10-27 |
| Rank | Trading Days | Calendar Days | Max Drawdown | Start Date | End Date |
|---|---|---|---|---|---|
| 1 | 66 | 96 | 8.81% | 2023-02-02 | 2023-05-09 |
| 2 | 21 | 33 | 8.74% | 2023-06-15 | 2023-07-18 |
| 3 | 31 | 43 | 6.76% | 2023-07-31 | 2023-09-12 |
| 4 | 18 | 27 | 6.63% | 2022-12-01 | 2022-12-28 |
| Rank | Trading Days | Calendar Days | Max Drawdown | Start Date | End Date |
|---|---|---|---|---|---|
| 1 | 42 | 58 | 10.63% | 2024-07-16 | 2024-09-12 |
| 2 | 35 | 49 | 6.64% | 2023-09-14 | 2023-11-02 |
| 3 | 23 | 33 | 5.74% | 2024-04-11 | 2024-05-14 |
| 4 | 13 | 21 | 3.41% | 2023-12-27 | 2024-01-17 |
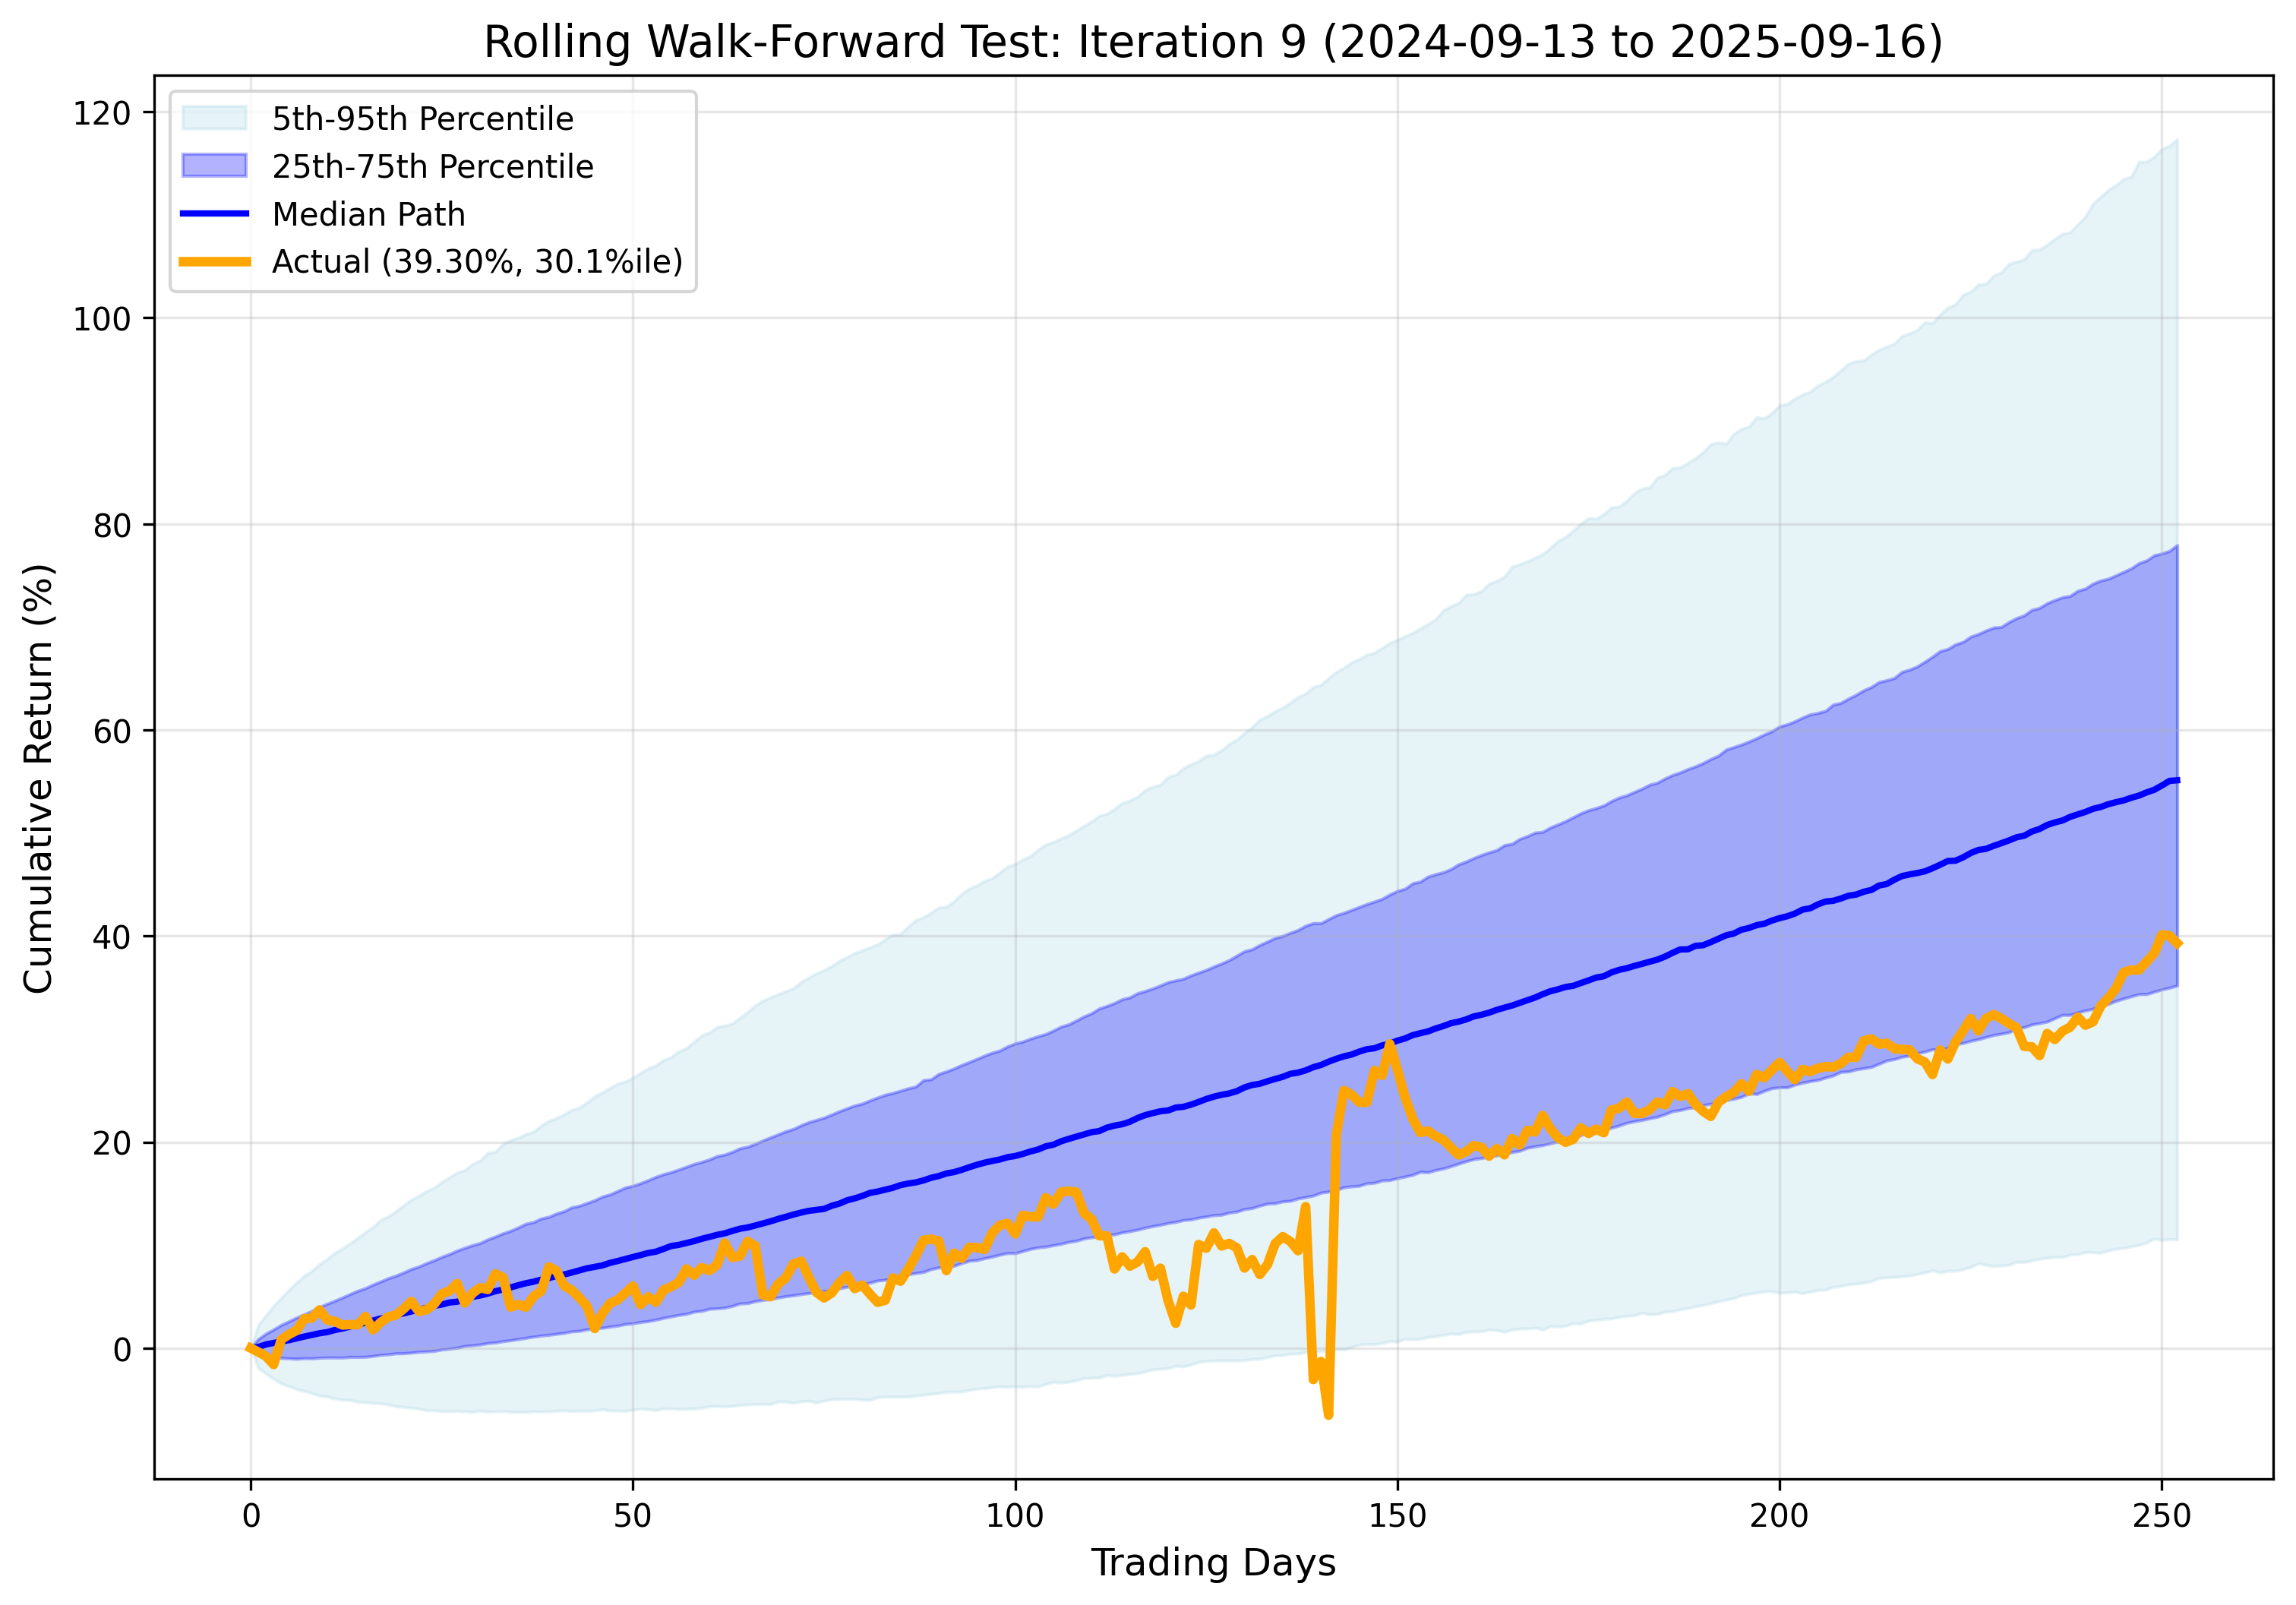
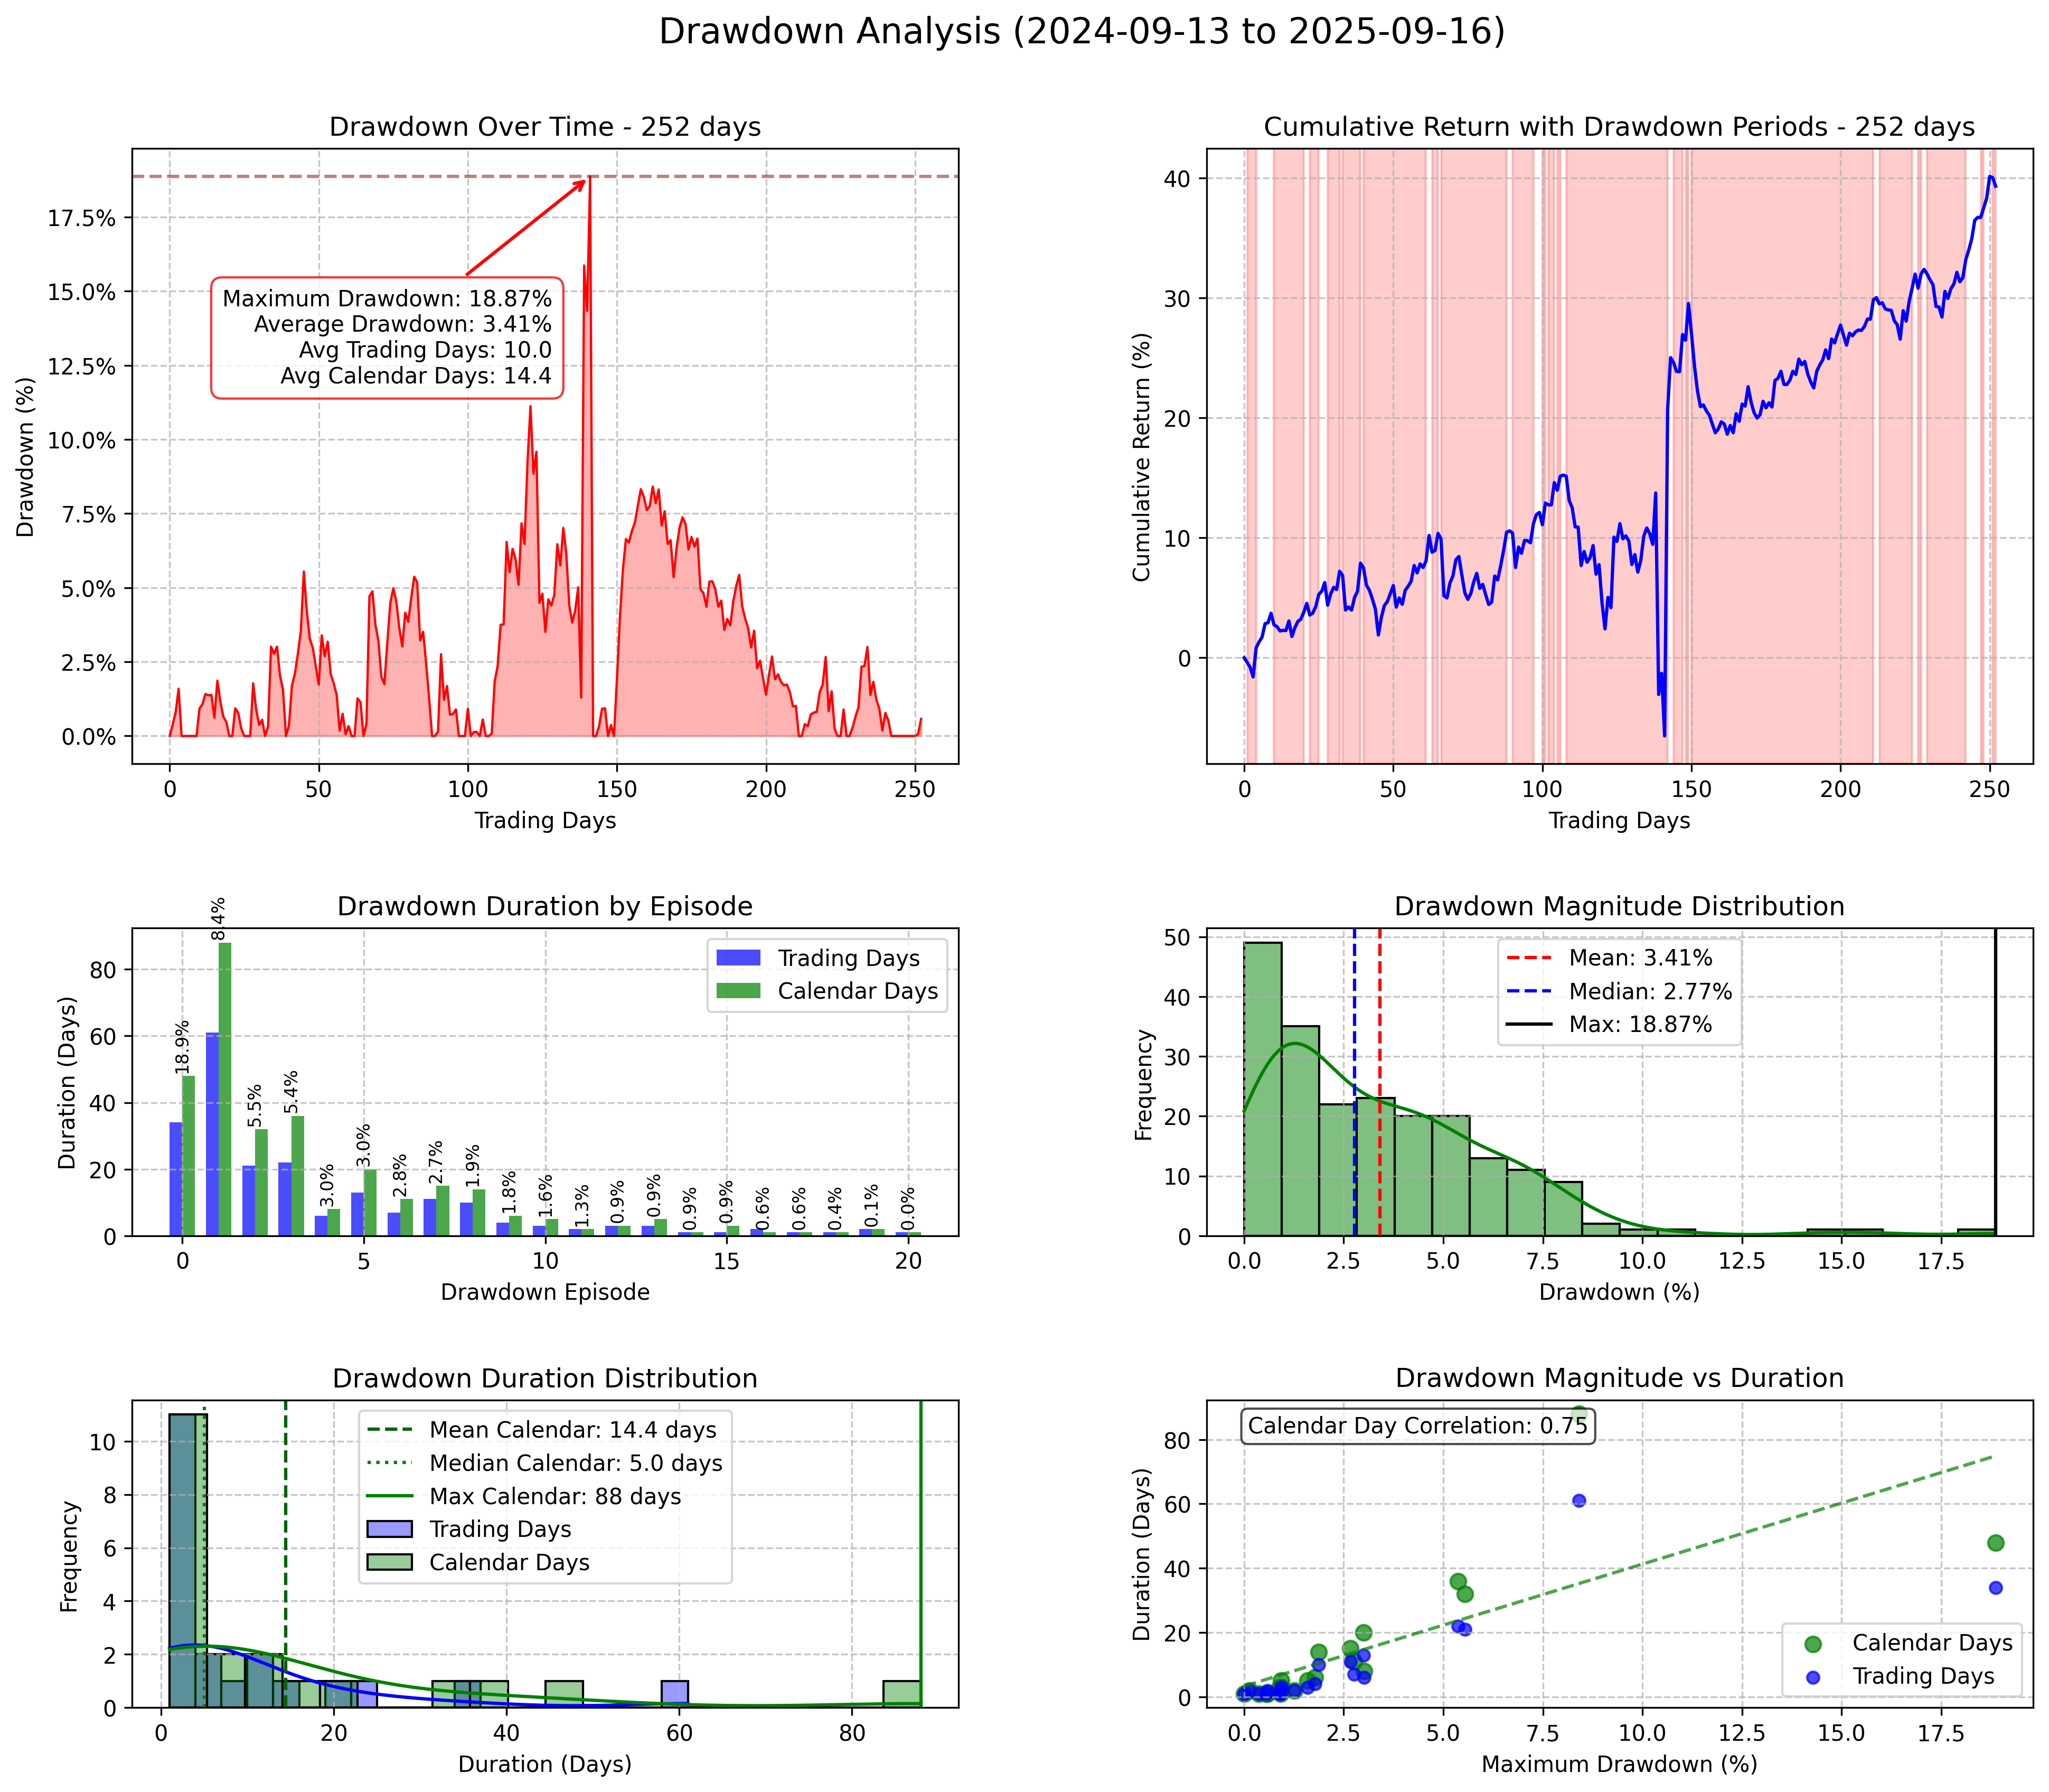
| Rank | Trading Days | Calendar Days | Max Drawdown | Start Date | End Date |
|---|---|---|---|---|---|
| 1 | 34 | 48 | 18.87% | 2025-02-19 | 2025-04-08 |
| 2 | 61 | 88 | 8.41% | 2025-04-21 | 2025-07-18 |
| 3 | 21 | 32 | 5.55% | 2024-11-07 | 2024-12-09 |
| 4 | 22 | 36 | 5.37% | 2024-12-16 | 2025-01-21 |
| Metric | Value |
|---|---|
| Average Actual Return | 137.91% |
| Average Forecast Return | 98.35% |
| Average Error | 39.56% |
| Average Percentile | 44.8% |
| Average Max Drawdown | 12.92% |
| Average Actual CAGR | 137.91% |
| Average Forecast CAGR | 98.35% |
Please wait while we get Zehnvisor on the line for you...